Immune System
STATUS: NORMAL
No elevated stress detected. Cross-asset behavior is within normal ranges. Standard risk management applies.
What does this mean?
The market's vital signs look healthy. Different types of investments (stocks, bonds, gold, etc.) are behaving normally relative to each other. No unusual stress detected. Your portfolio doesn't need any special attention right now.
What's Driving It
- [FORWARD-LOOK] ⬇ BKLN BELOW 200-day MA -- credit market confirmation Tracks risky corporate loans (the kind private equity firms use for buyouts). When this drops below its long-term average, it signals that stress is spreading from stocks into corporate debt — a serious escalation
- [CURRENT STATE] ● Dispersion ELEVATED -- above-normal name-level divergence Tracks whether individual stocks are moving together or going in wildly different directions. High dispersion under a calm surface is a hidden warning sign
- [CURRENT STATE] ○ Software NORMAL -- software stress in line with market Compares how much software/tech stocks are swinging versus the overall market. When this sector is stressed beyond normal, it often spreads
- [CURRENT STATE] ○ Turbulence NORMAL -- cross-asset stress within range Measures how many different investments are moving in unusual ways at the same time — like a fever thermometer for the whole market
- [CURRENT STATE] ⬆ Breadth BROADENING -- healthy participation across names Measures whether the whole market is moving together, or if gains are concentrated in just a few big stocks. Narrow breadth (only a few stocks going up) is a warning that the rally is fragile
INTERPRETATION
The market regime is calm. No stress-related adjustments needed. Standard risk management applies.
In plain English
In plain English: everything is fine. The market is behaving normally. Standard investing rules apply.
RECOMMENDED ACTIONS (NORMAL)
- No action required -- turbulence within normal range
- Continue standard position sizing and risk management
- Leveraged loans below 200-day MA -- equity stress may be crossing into credit; reduce risk in leveraged names
Detailed Metrics
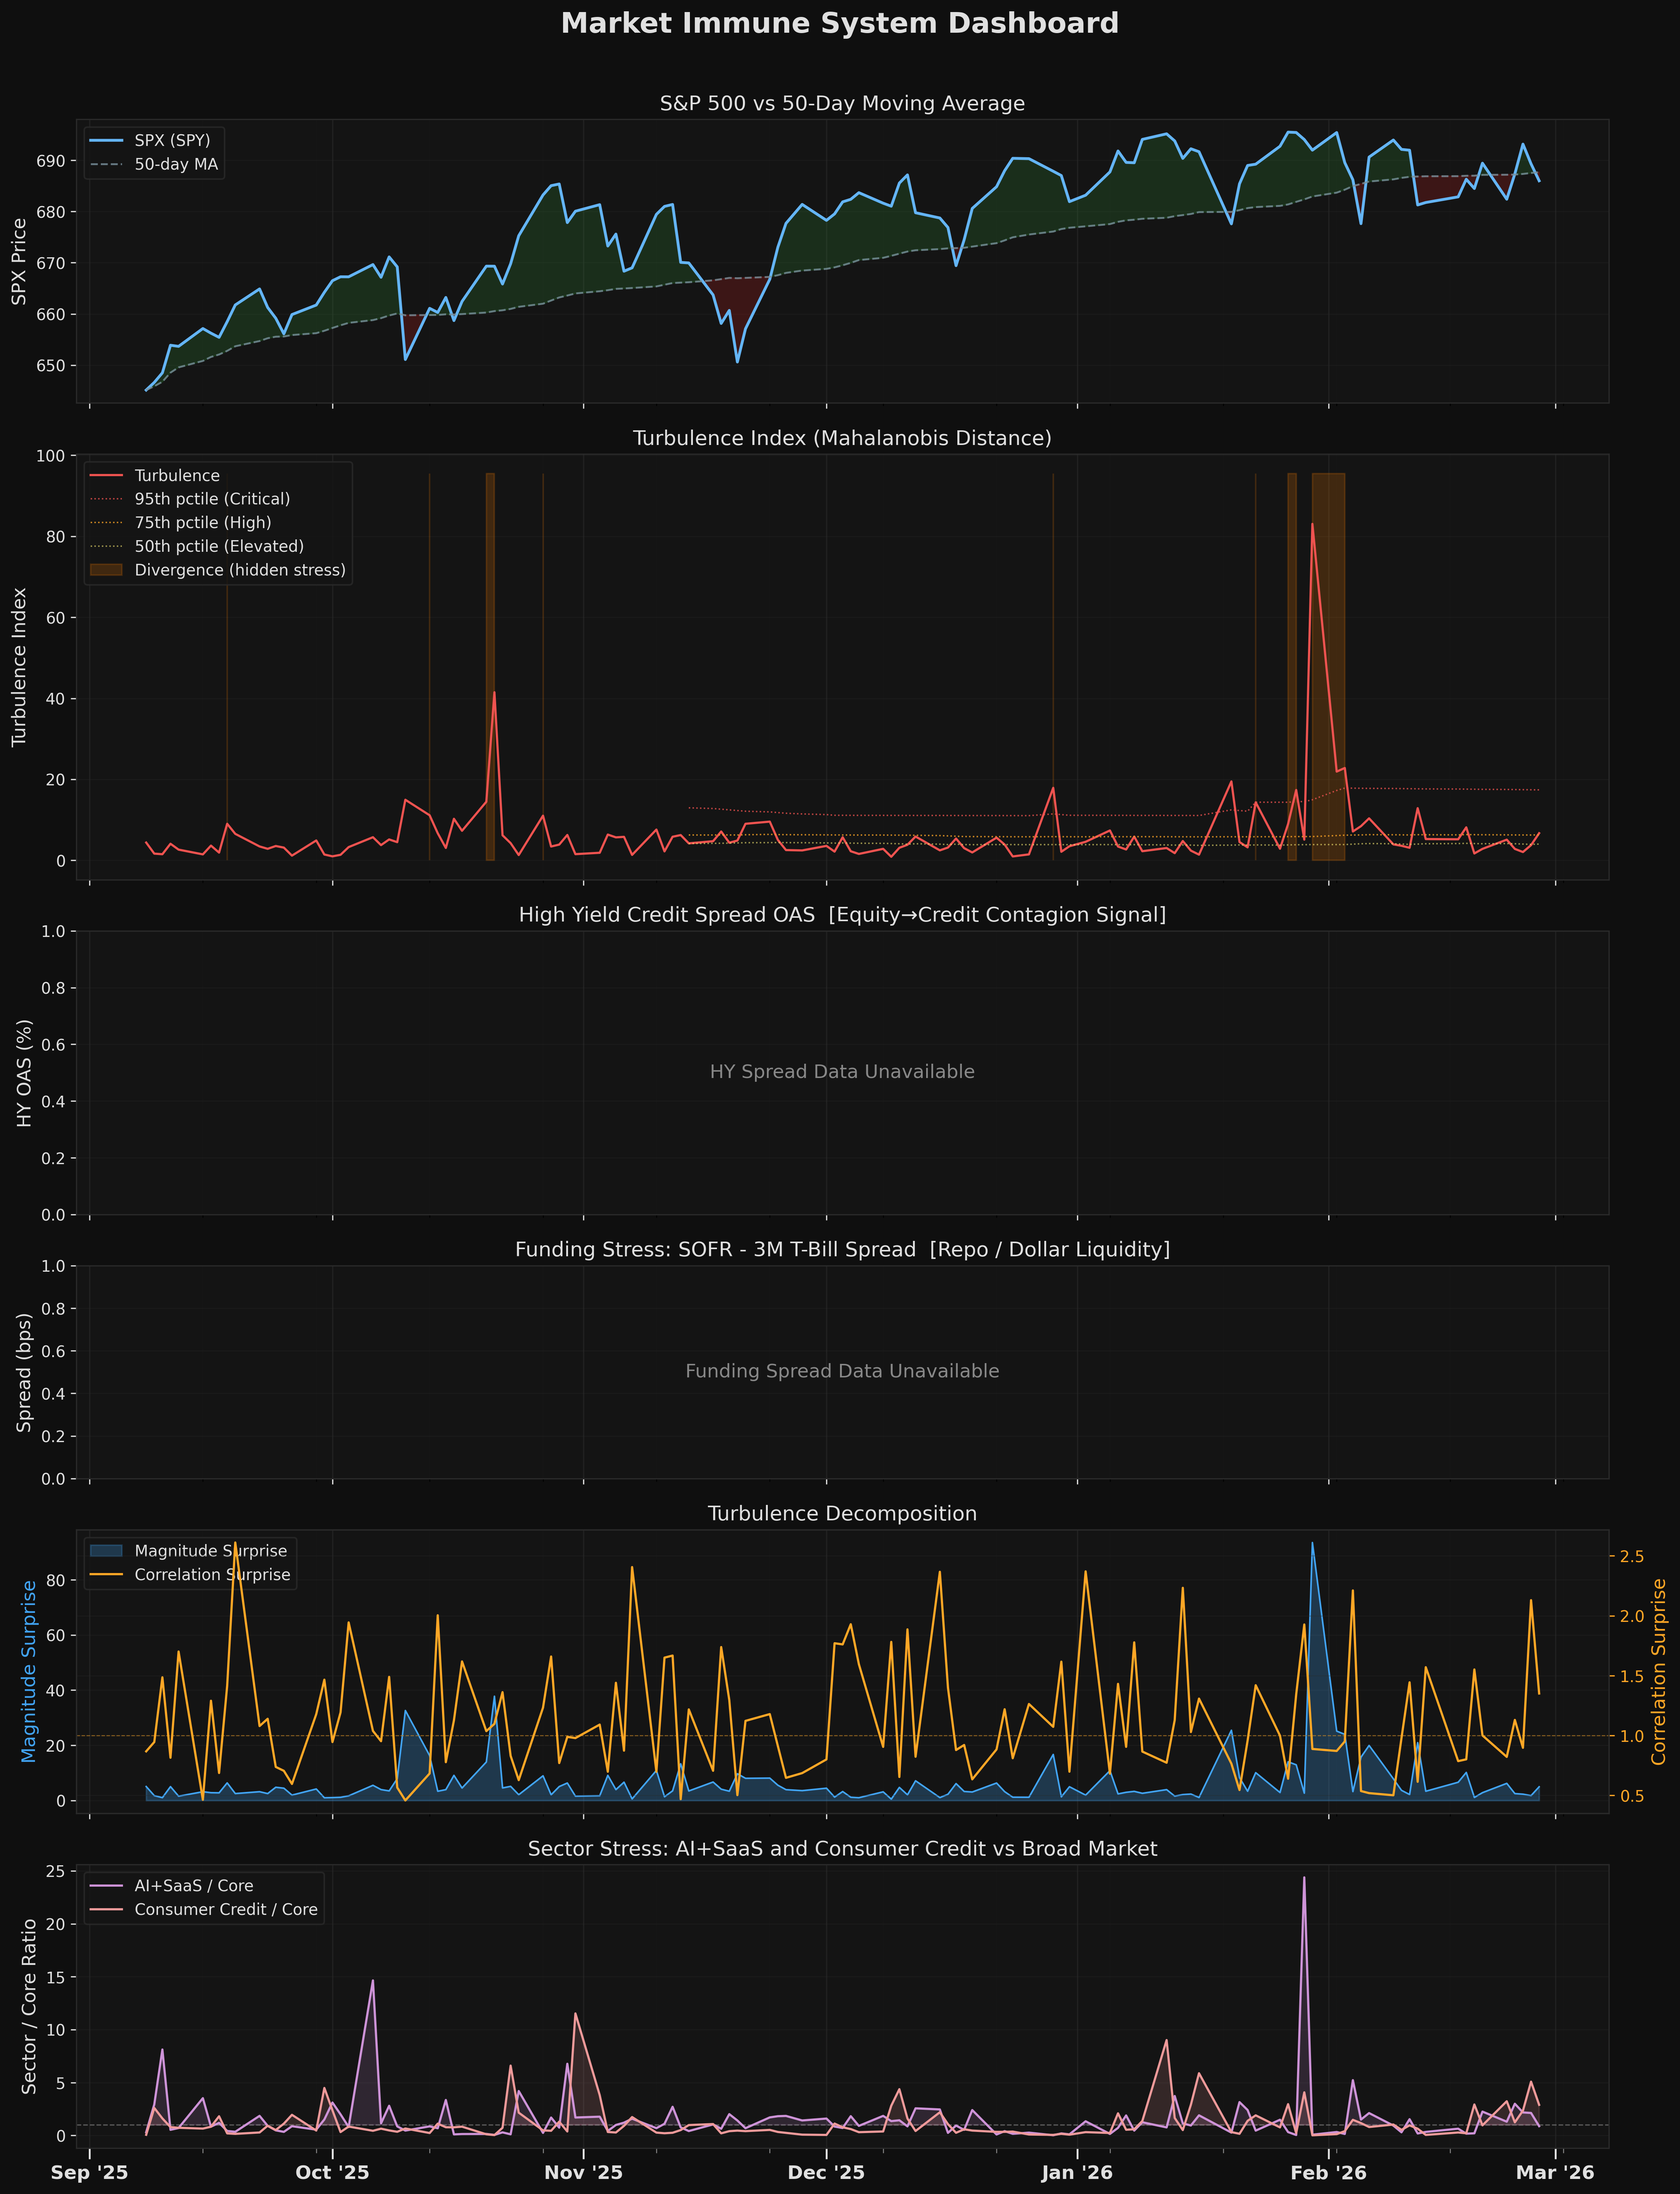
Turbulence: 0.03 (0th percentile)How unusual is today's market behavior compared to the past year? Higher = more unusual.
Magnitude Surprise: 0.1How extreme are today's price moves in absolute size? A bigger number means larger-than-expected moves.
Correlation Surprise: 0.57xAre investments moving together in unusual ways? Above 1.0x means correlations are higher than normal (things are moving in lockstep).
Days Elevated: 0 daysHow many consecutive days has stress been above normal? Longer streaks suggest persistent stress, not a one-day blip.
Divergence Active: NOIs there a contradiction between what the market surface looks like and what's happening underneath? YES means the index looks calm but stress is building below the surface.
Dispersion Ratio: 2.23 (78th percentile)How spread out are individual stock returns? A high number means stocks are going in very different directions — the market can't agree on a direction.
Stealth Stress: NOIs stress hiding? This fires when individual stocks are diverging sharply but the overall index looks calm — a classic sign that trouble is building before it shows up in the headlines.
Breadth (RSP/SPY): 1.04 (broad)Are most stocks going up, or just a few big ones? Below 0.97 = narrow (bad), above 1.03 = broad (good), in between = balanced.
BKLN Trend: BELOW 200-day MAIs the risky loan market healthy? BELOW the 200-day average means loans are under pressure — a sign that stress is spreading beyond stocks.
Sector Stress Ratios:
How volatile is each sector compared to the overall market? Above 1.0x means that sector is more stressed than average. Above 1.5x is a red flag.
AI / Core: 0.63x
Software / Core: 0.44x
Consumer Credit / Core: 0.15x
HY OAS: N/AThe 'high yield spread' — the extra interest rate that risky companies must pay to borrow. Higher = more fear about corporate defaults. The percentile tells you where this sits versus the past 2 years.
Funding Spread: N/AThe cost of short-term borrowing between banks. Negative = cheaper than normal (good). Positive = more expensive than normal (stress in the financial plumbing).
SPX vs 50-day MA: 686.38 (BELOW 50-day MA)Is the S&P 500 above or below its 50-day trend line? Below = the market is in a short-term downtrend.
VIX: 25.2The 'fear index.' Measures expected market volatility over the next 30 days. Below 15 = calm. 15-25 = normal. 25-35 = elevated fear. Above 35 = extreme fear.
Charts