Immune System
STATUS: HIGH
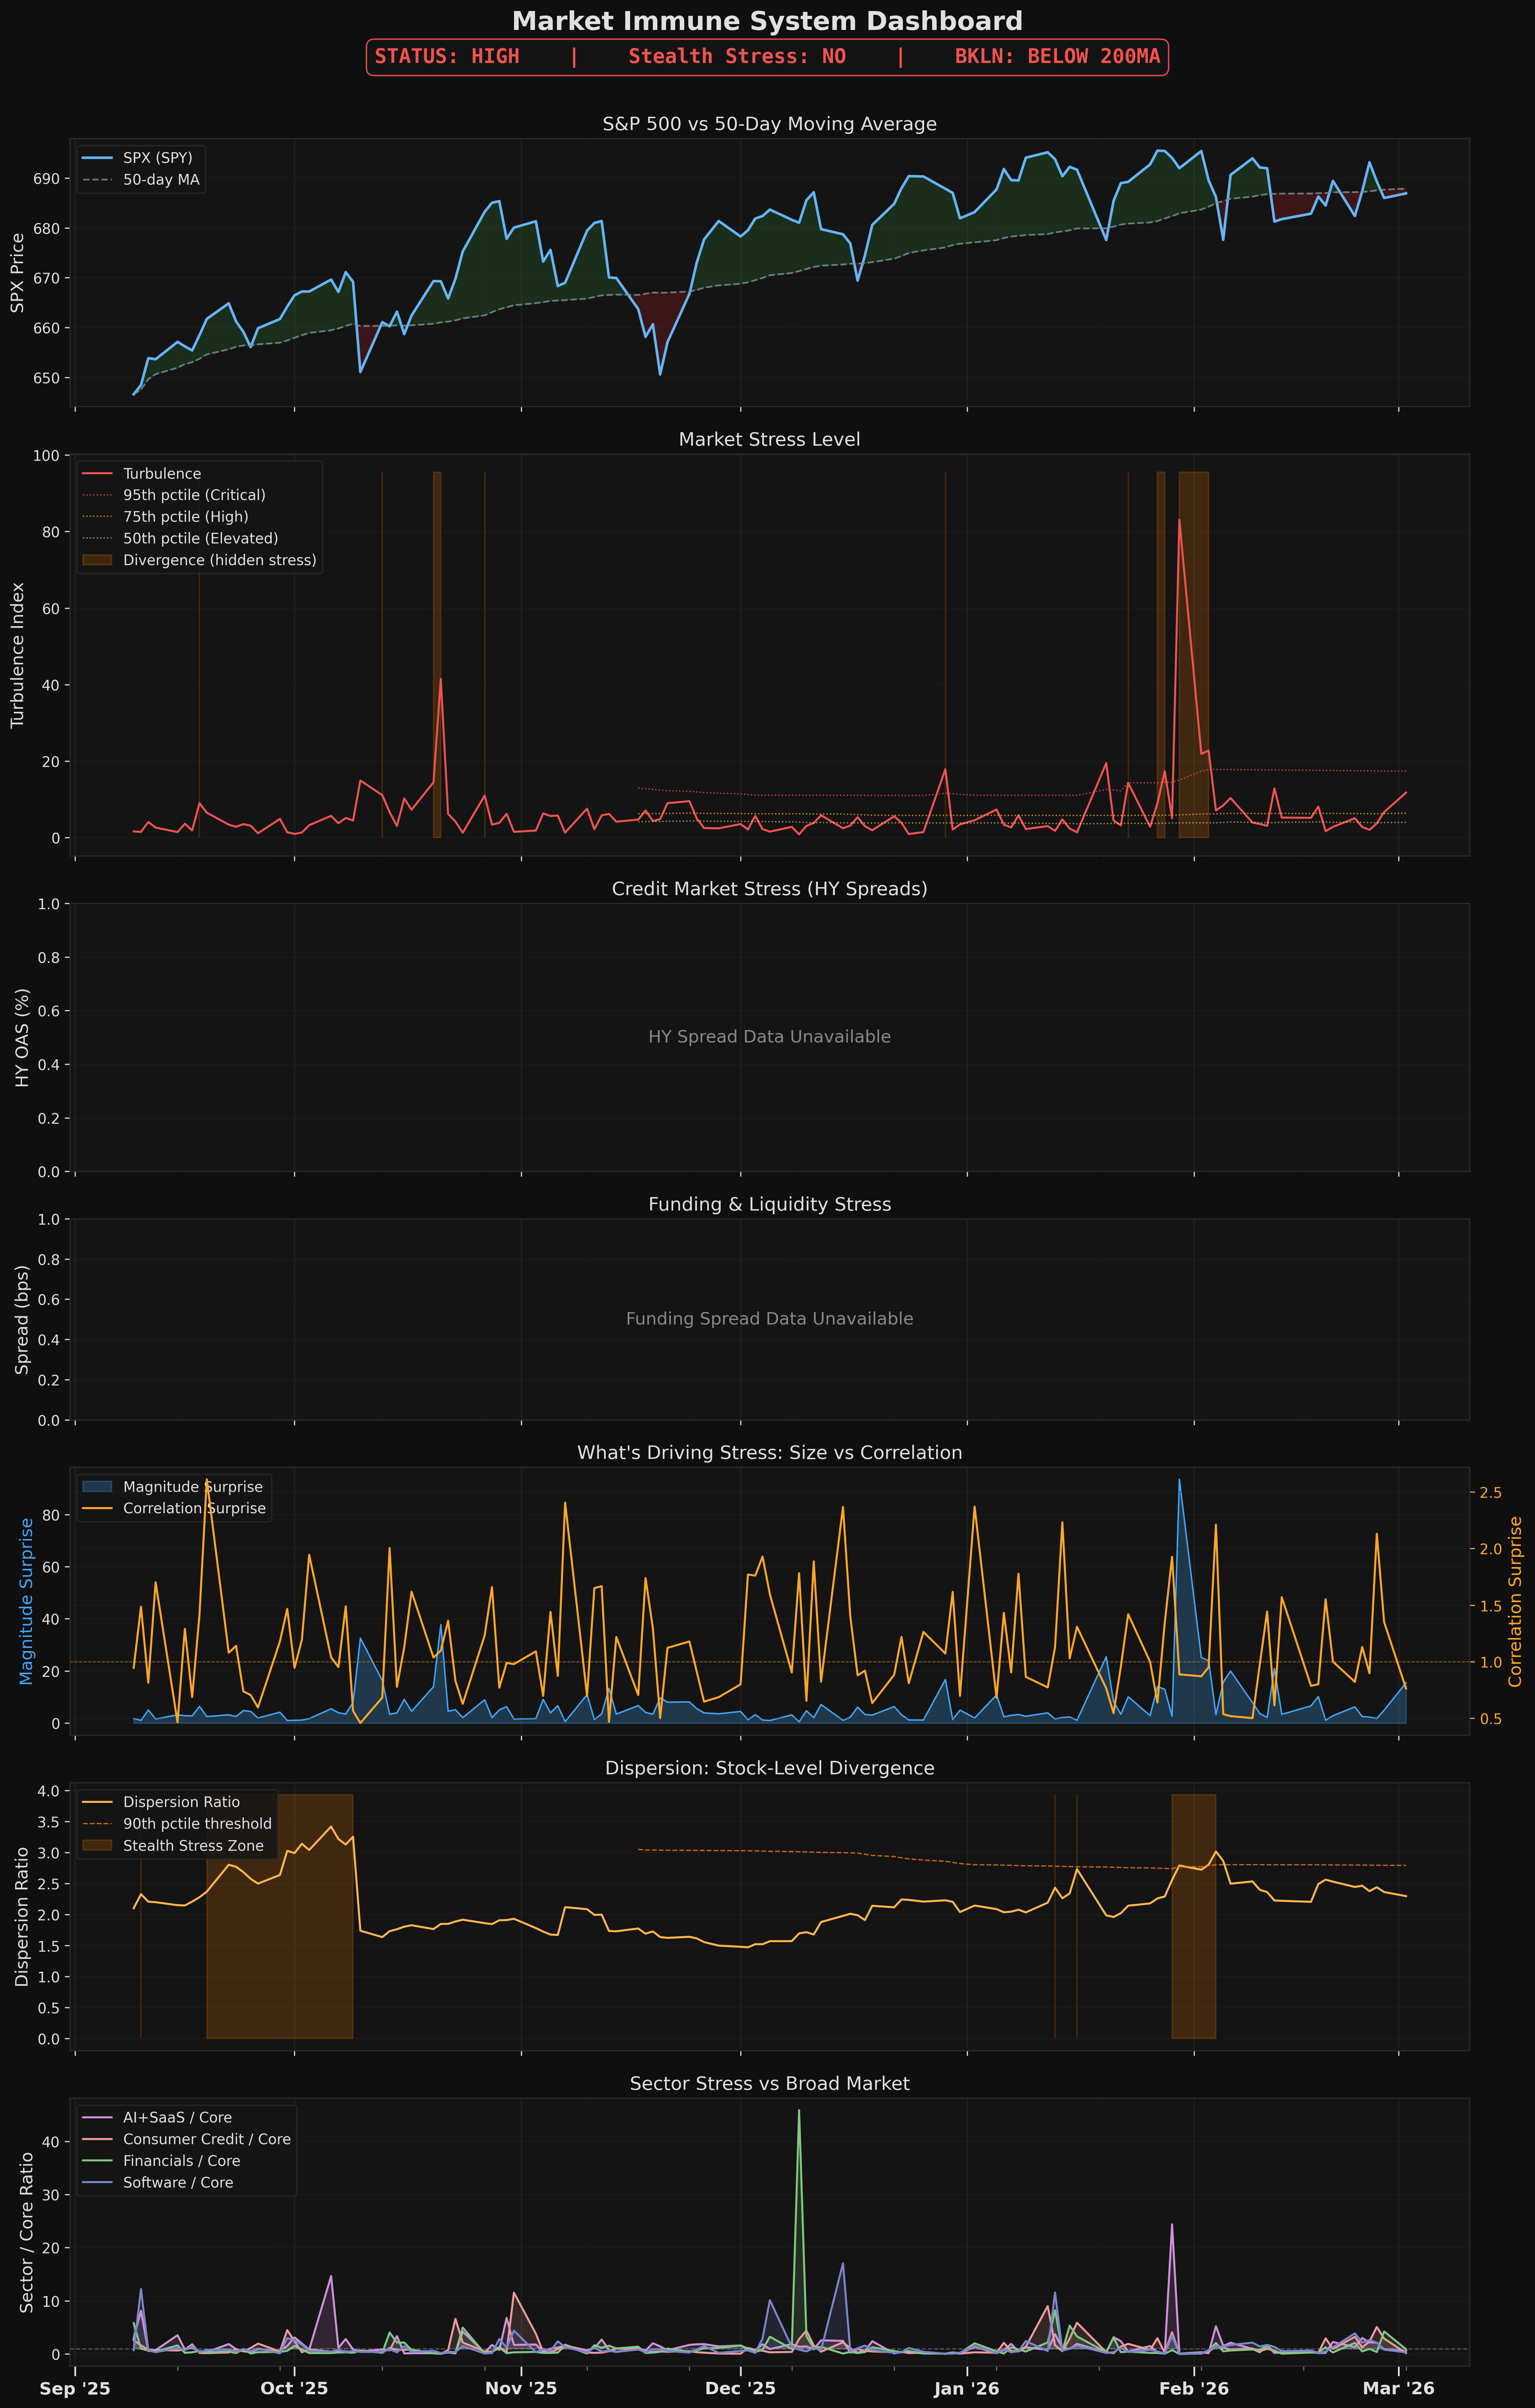
Market stress is high. Cross-asset turbulence is well above normal levels, indicating significant risk-off pressure. Monitor for escalation to critical.
What does this mean?
The market is under significant stress. Multiple types of investments are moving in unusual, correlated ways — like when everything sells off together. Historically, this level of stress actually marks the worst of the selloff more often than the start of one. But if credit markets are also stressed (check the Credit Stress report), the combination is much more dangerous.
What's Driving It
- ⬆ Turbulence HIGH -- cross-asset stress well above normal Measures how many different investments are moving in unusual ways at the same time — like a fever thermometer for the whole market
- ● Dispersion ELEVATED -- above-normal name-level divergence Tracks whether individual stocks are moving together or going in wildly different directions. High dispersion under a calm surface is a hidden warning sign
- ○ Financials NORMAL -- bank stress in line with market
- ○ Software NORMAL -- software stress in line with market Compares how much software/tech stocks are swinging versus the overall market. When this sector is stressed beyond normal, it often spreads
- ⬆ Breadth BROADENING -- healthy participation across names Measures whether the whole market is moving together, or if gains are concentrated in just a few big stocks. Narrow breadth (only a few stocks going up) is a warning that the rally is fragile
- -> Reduce position sizes by 25-50%
- -> Tighten trailing stops on all positions
- -> Raise cash allocation
- -> Monitor daily for escalation to Critical
- -> Leveraged loans below 200-day MA -- equity stress may be crossing into credit; reduce risk in leveraged names
- Detailed Metrics
- Turbulence: 11.8 (84th percentile) Measures how many different investments are moving in unusual ways at the same time — like a fever thermometer for the whole market
- Magnitude Surprise: 15.5
- Correlation Surprise: 0.76x
- Days Elevated: 1 days
- Divergence Active: NO
- Dispersion Ratio: 2.30 (81th percentile) Tracks whether individual stocks are moving together or going in wildly different directions. High dispersion under a calm surface is a hidden warning sign
- Stealth Stress: NO
- Breadth (RSP/SPY): 1.04 (broad) Measures whether the whole market is moving together, or if gains are concentrated in just a few big stocks. Narrow breadth (only a few stocks going up) is a warning that the rally is fragile
- BKLN Trend: BELOW 200-day MA Tracks risky corporate loans (the kind private equity firms use for buyouts). When this drops below its long-term average, it signals that stress is spreading from stocks into corporate debt — a serious escalation
- Sector Stress Ratios:
- AI / Core: 0.53x
- Software / Core: 0.30x Compares how much software/tech stocks are swinging versus the overall market. When this sector is stressed beyond normal, it often spreads
- Financials / Core: 0.88x
- Consumer Credit / Core: 0.17x
- Market Reference:
- SPX: 686.92 (BELOW 50-day MA)
- VIX: 20.97
Detailed Metrics
Turbulence: 11.79 (84th percentile)How unusual is today's market behavior compared to the past year? Higher = more unusual.
Magnitude Surprise: 15.5How extreme are today's price moves in absolute size? A bigger number means larger-than-expected moves.
Correlation Surprise: 0.76xAre investments moving together in unusual ways? Above 1.0x means correlations are higher than normal (things are moving in lockstep).
Days Elevated: 1 daysHow many consecutive days has stress been above normal? Longer streaks suggest persistent stress, not a one-day blip.
Divergence Active: NOIs there a contradiction between what the market surface looks like and what's happening underneath? YES means the index looks calm but stress is building below the surface.
Dispersion Ratio: 2.3 (81th percentile)How spread out are individual stock returns? A high number means stocks are going in very different directions — the market can't agree on a direction.
Stealth Stress: NOIs stress hiding? This fires when individual stocks are diverging sharply but the overall index looks calm — a classic sign that trouble is building before it shows up in the headlines.
Breadth (RSP/SPY): 1.04 (broad)Are most stocks going up, or just a few big ones? Below 0.97 = narrow (bad), above 1.03 = broad (good), in between = balanced.
BKLN Trend: BELOW 200-day MAIs the risky loan market healthy? BELOW the 200-day average means loans are under pressure — a sign that stress is spreading beyond stocks.
Sector Stress Ratios:
How volatile is each sector compared to the overall market? Above 1.0x means that sector is more stressed than average. Above 1.5x is a red flag.
AI / Core: 0.53x
Software / Core: 0.3x
Consumer Credit / Core: 0.17x
HY OAS: N/AThe 'high yield spread' — the extra interest rate that risky companies must pay to borrow. Higher = more fear about corporate defaults. The percentile tells you where this sits versus the past 2 years.
Funding Spread: N/AThe cost of short-term borrowing between banks. Negative = cheaper than normal (good). Positive = more expensive than normal (stress in the financial plumbing).
SPX vs 50-day MA: 686.92 (BELOW 50-day MA)Is the S&P 500 above or below its 50-day trend line? Below = the market is in a short-term downtrend.
VIX: 21.0The 'fear index.' Measures expected market volatility over the next 30 days. Below 15 = calm. 15-25 = normal. 25-35 = elevated fear. Above 35 = extreme fear.
Charts