Immune System
STATUS: CRITICAL
Cross-asset turbulence is at extreme levels. The market is in crisis-mode. While turbulence alone does not predict forward drawdowns, extreme readings indicate regime fragility. Check credit stress for forward risk.
What does this mean?
The market is in crisis mode. This is the highest stress level. Different investments are moving in extreme, unusual patterns all at once. Think of it like a severe storm warning — the storm is already here. If credit markets are also flashing red, this is when you want to be reducing risk and raising cash.
What's Driving It
- [CURRENT STATE] ⬆ Turbulence CRITICAL -- cross-asset stress well above normal Measures how many different investments are moving in unusual ways at the same time — like a fever thermometer for the whole market
- [FORWARD-LOOK] ⬇ BKLN BELOW 200-day MA -- credit market confirmation Tracks risky corporate loans (the kind private equity firms use for buyouts). When this drops below its long-term average, it signals that stress is spreading from stocks into corporate debt — a serious escalation
- [CURRENT STATE] ● Dispersion ELEVATED -- above-normal name-level divergence Tracks whether individual stocks are moving together or going in wildly different directions. High dispersion under a calm surface is a hidden warning sign
- [CURRENT STATE] ○ Software NORMAL -- software stress in line with market Compares how much software/tech stocks are swinging versus the overall market. When this sector is stressed beyond normal, it often spreads
- [CURRENT STATE] ⬆ Breadth BROADENING -- healthy participation across names Measures whether the whole market is moving together, or if gains are concentrated in just a few big stocks. Narrow breadth (only a few stocks going up) is a warning that the rally is fragile
INTERPRETATION
The market is in a crisis regime. While turbulence alone does not predict drawdowns, extreme turbulence combined with elevated credit stress produces significantly worse outcomes (MDD -4.42% vs -2.18% for neither stressed). If credit stress is simultaneously elevated, take defensive action.
In plain English
In plain English: this is the worst it gets. The market is in full crisis mode. If credit markets are also stressed (check the Credit Stress report), history shows this combination leads to significantly worse losses (-4.4% average max drawdown vs -2.2% normally). This is when capital preservation matters most.
RECOMMENDED ACTIONS (CRITICAL)
- TAKE ACTION NOW -- reduce position sizes significantly
- Raise cash levels significantly (Cash is the only asset that doesn't lose value in a crisis. Having cash ready means you can buy opportunities when the storm passes)
- Hedge long exposure (puts, inverse ETFs)
- Avoid adding any new positions
- Monitor DAILY until turbulence subsides
- Leveraged loans below 200-day MA -- equity stress may be crossing into credit; reduce risk in leveraged names
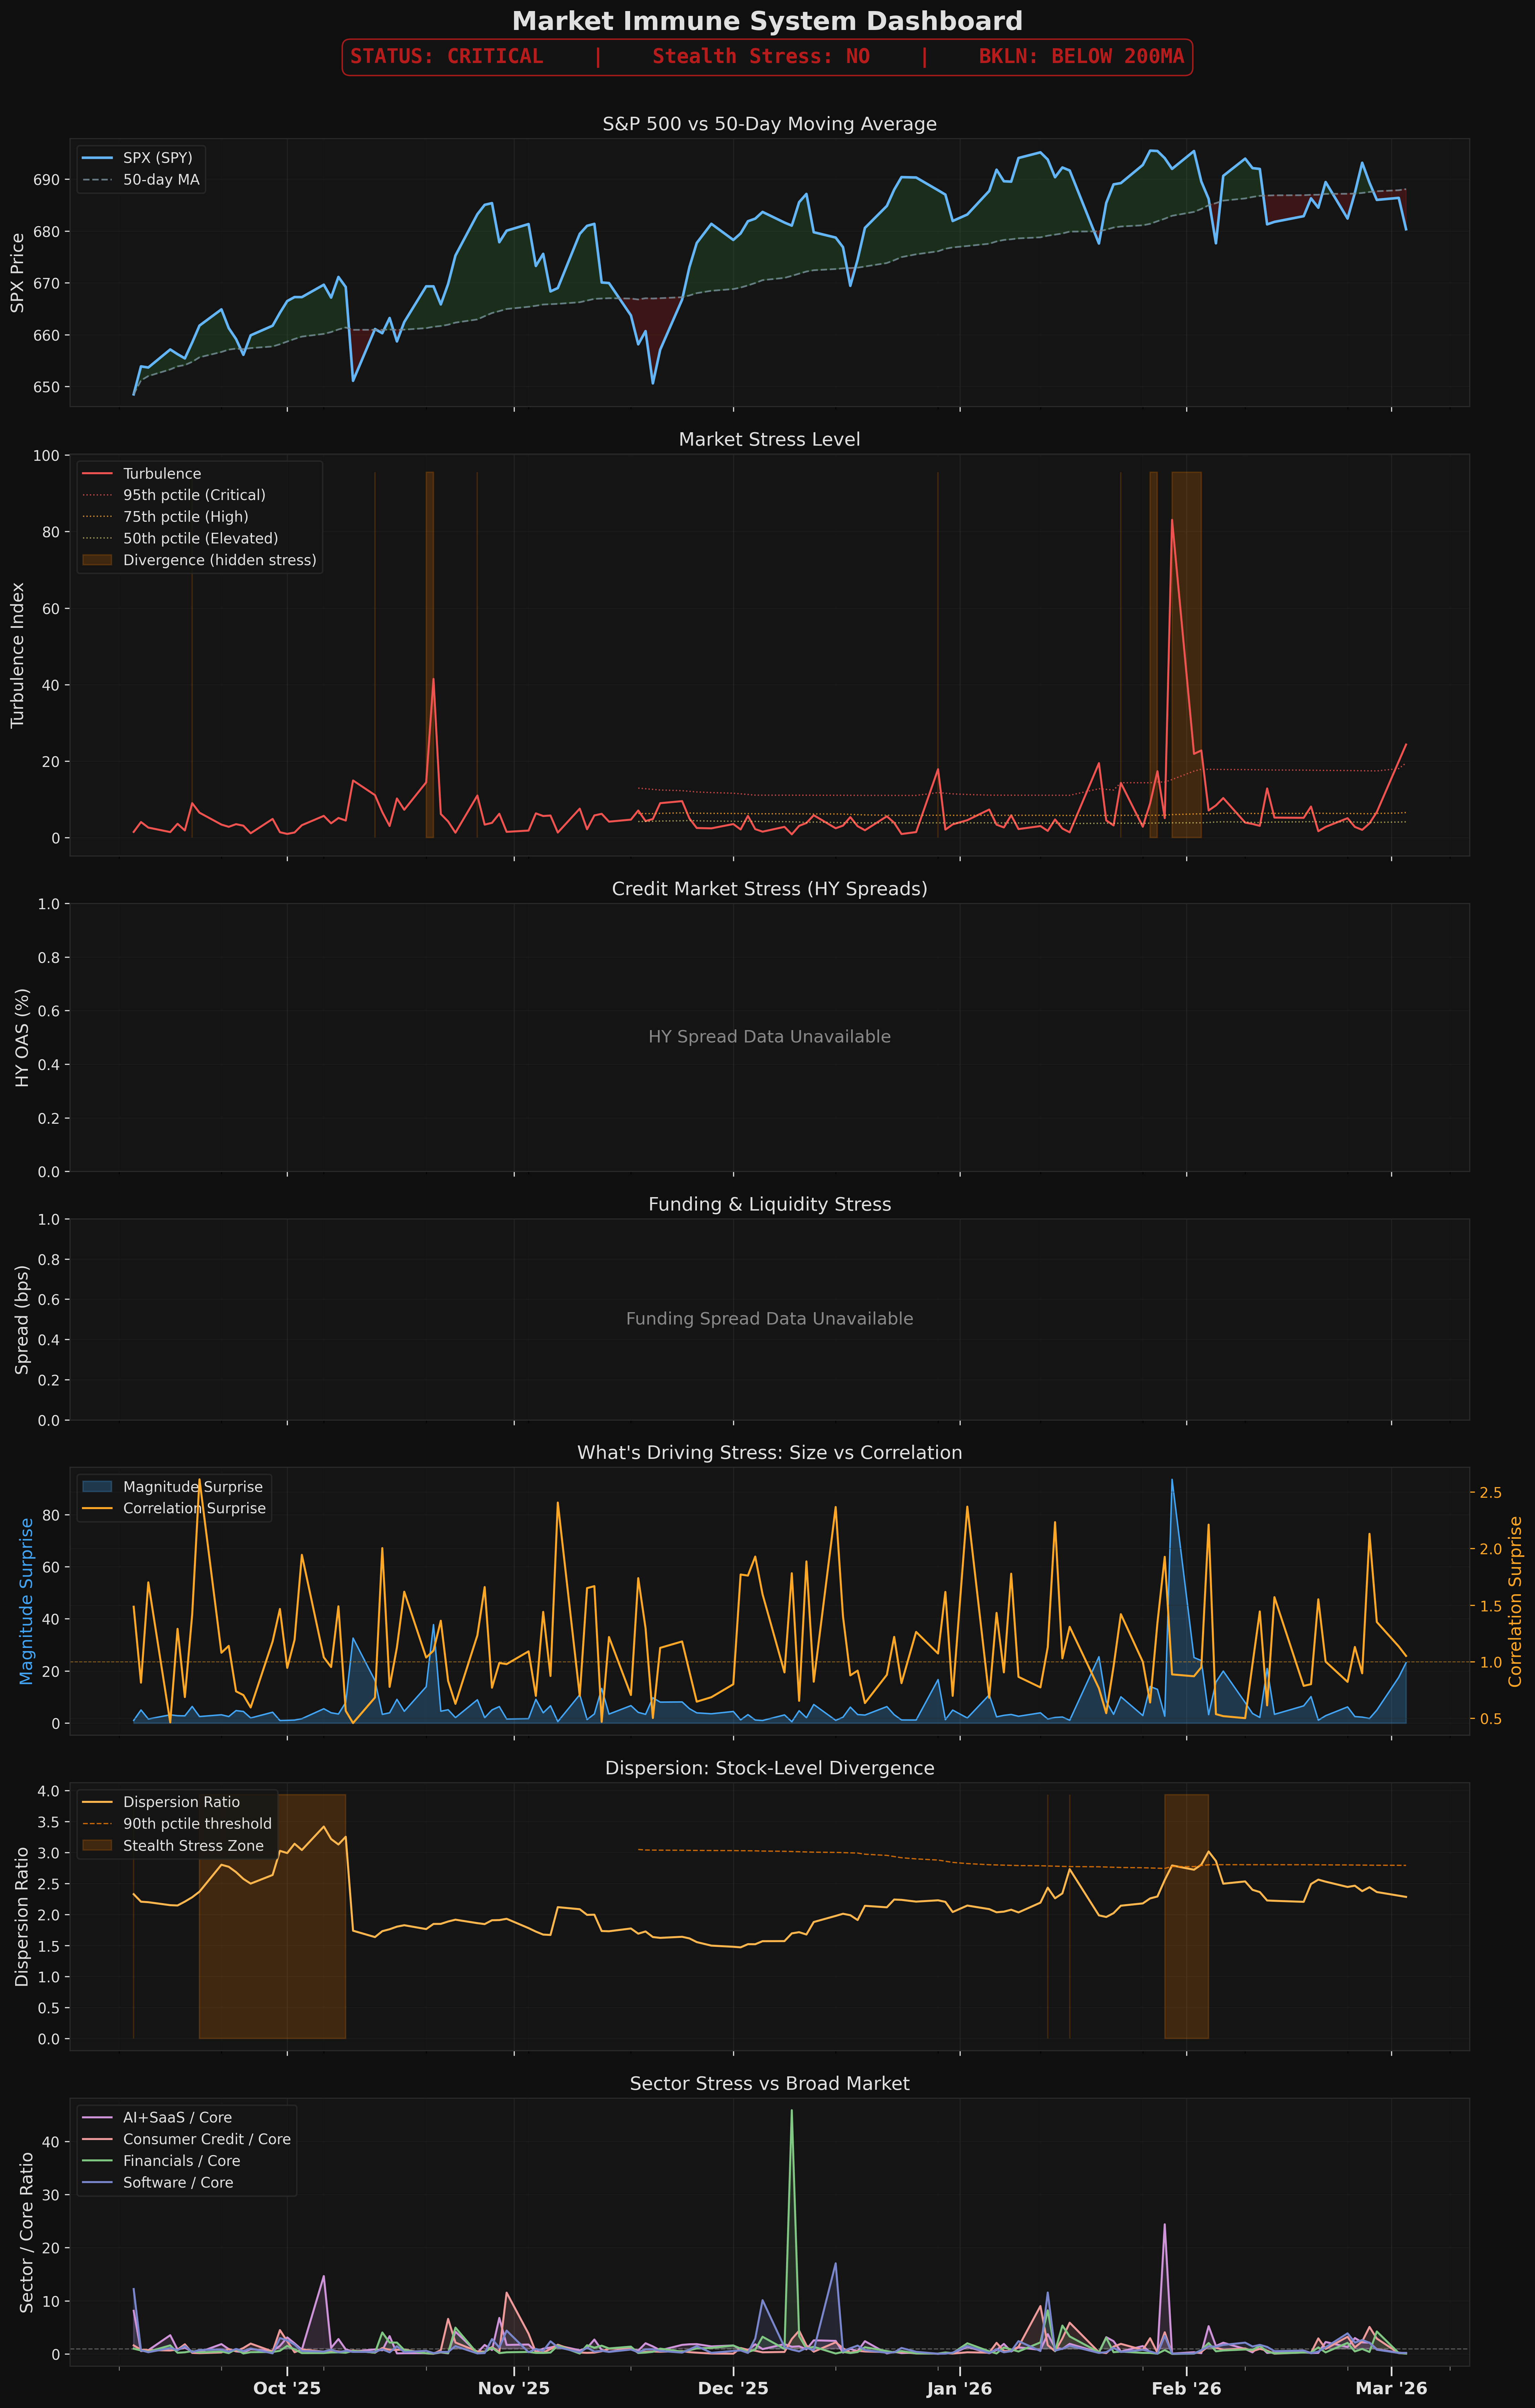
Detailed Metrics
Charts