UAMY
Conviction 3UAMY -- Combined Deep Dive Assessment
Date: 2026-03-01 Asset Class: Equity Ticker: UAMY (United States Antimony Corporation)
Fundamental Summary
| Metric | Value |
|---|---|
| Overall Score | 43.2/100 |
| Verdict | AVOID |
Key Strengths: - Genuine North American antimony monopoly with $351M contracted pipeline (DLA $245M IDIQ + $106.7M industrial) - Clean balance sheet: near-zero debt, current ratio 5.1x, $38.5M in liquid assets
Key Risks: - Extreme valuation (P/S 38x, P/B 16.4x, fwd P/E 82x) prices in full execution of $125M 2026 guidance with zero margin of safety - Gross margin compressing 3 consecutive quarters (33.9% -> 27.0% -> 23.1%) as antimony prices declined ~40% from July 2025 peak; this deterioration is not widely priced in
(Full report: analysis/fundamentals/UAMY-synthesis.md)
Technical Summary
| Metric | Value |
|---|---|
| Overall Score | 7.9/10 |
| Bias | Bullish |
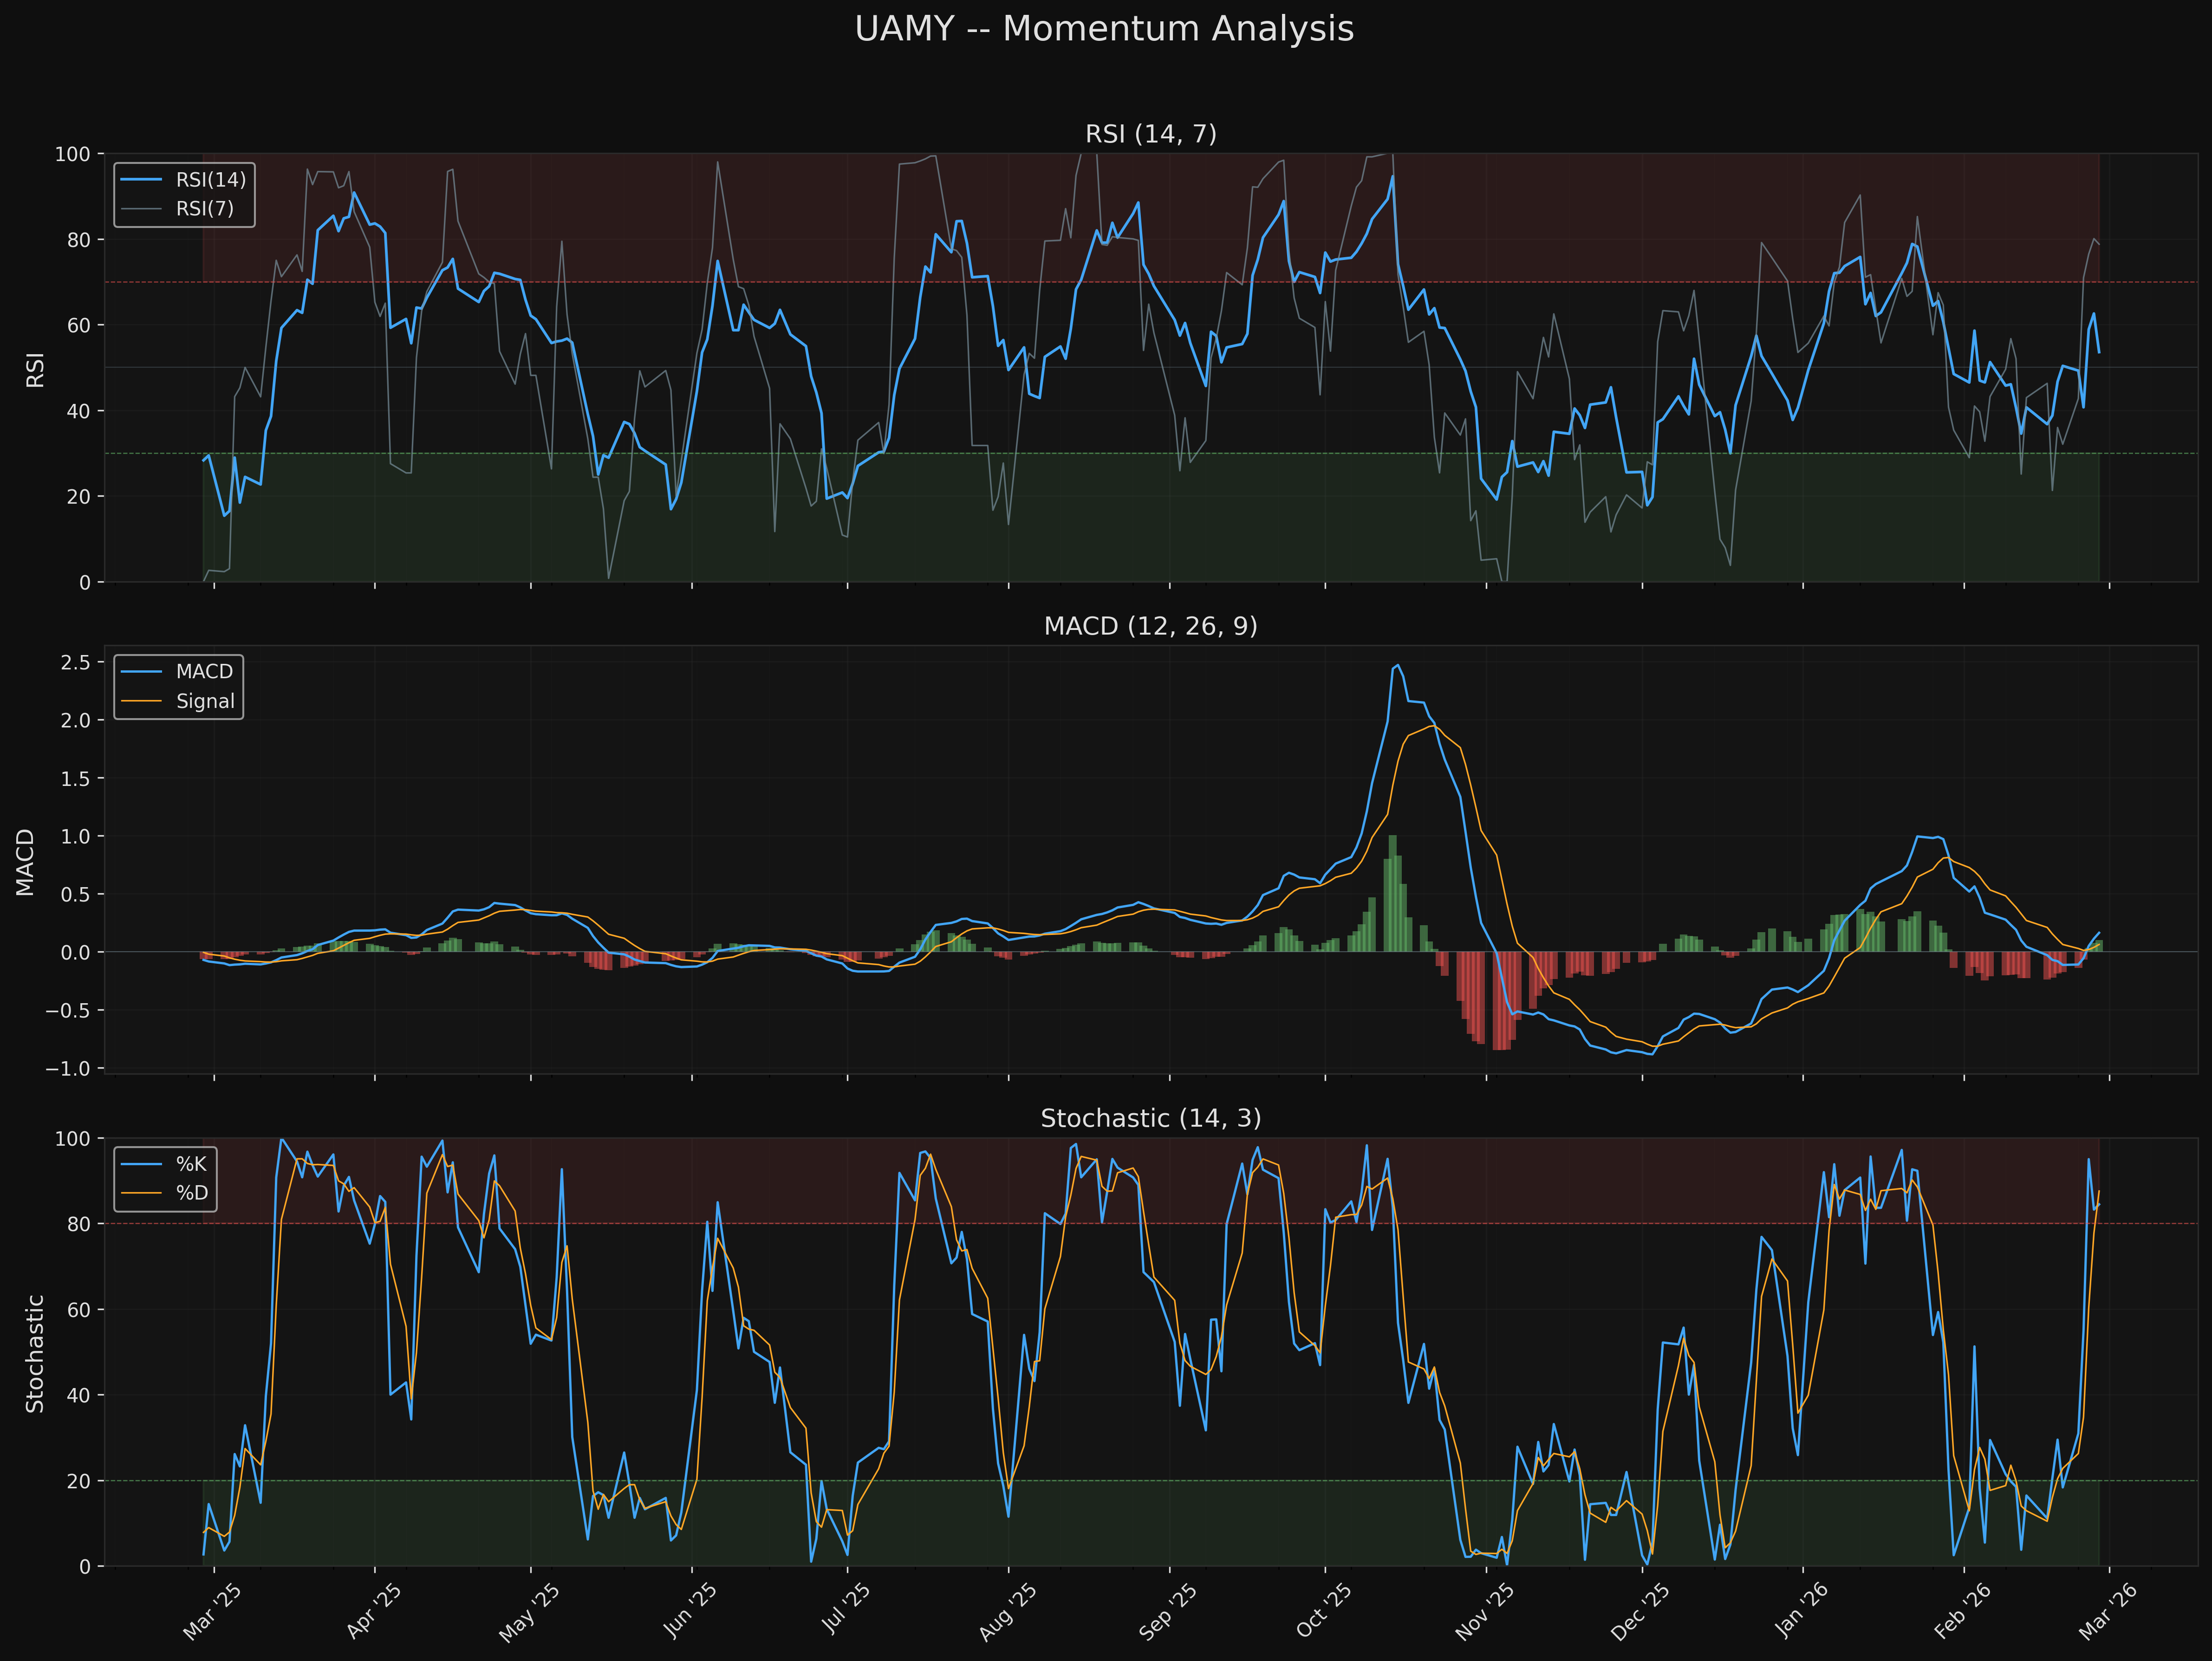
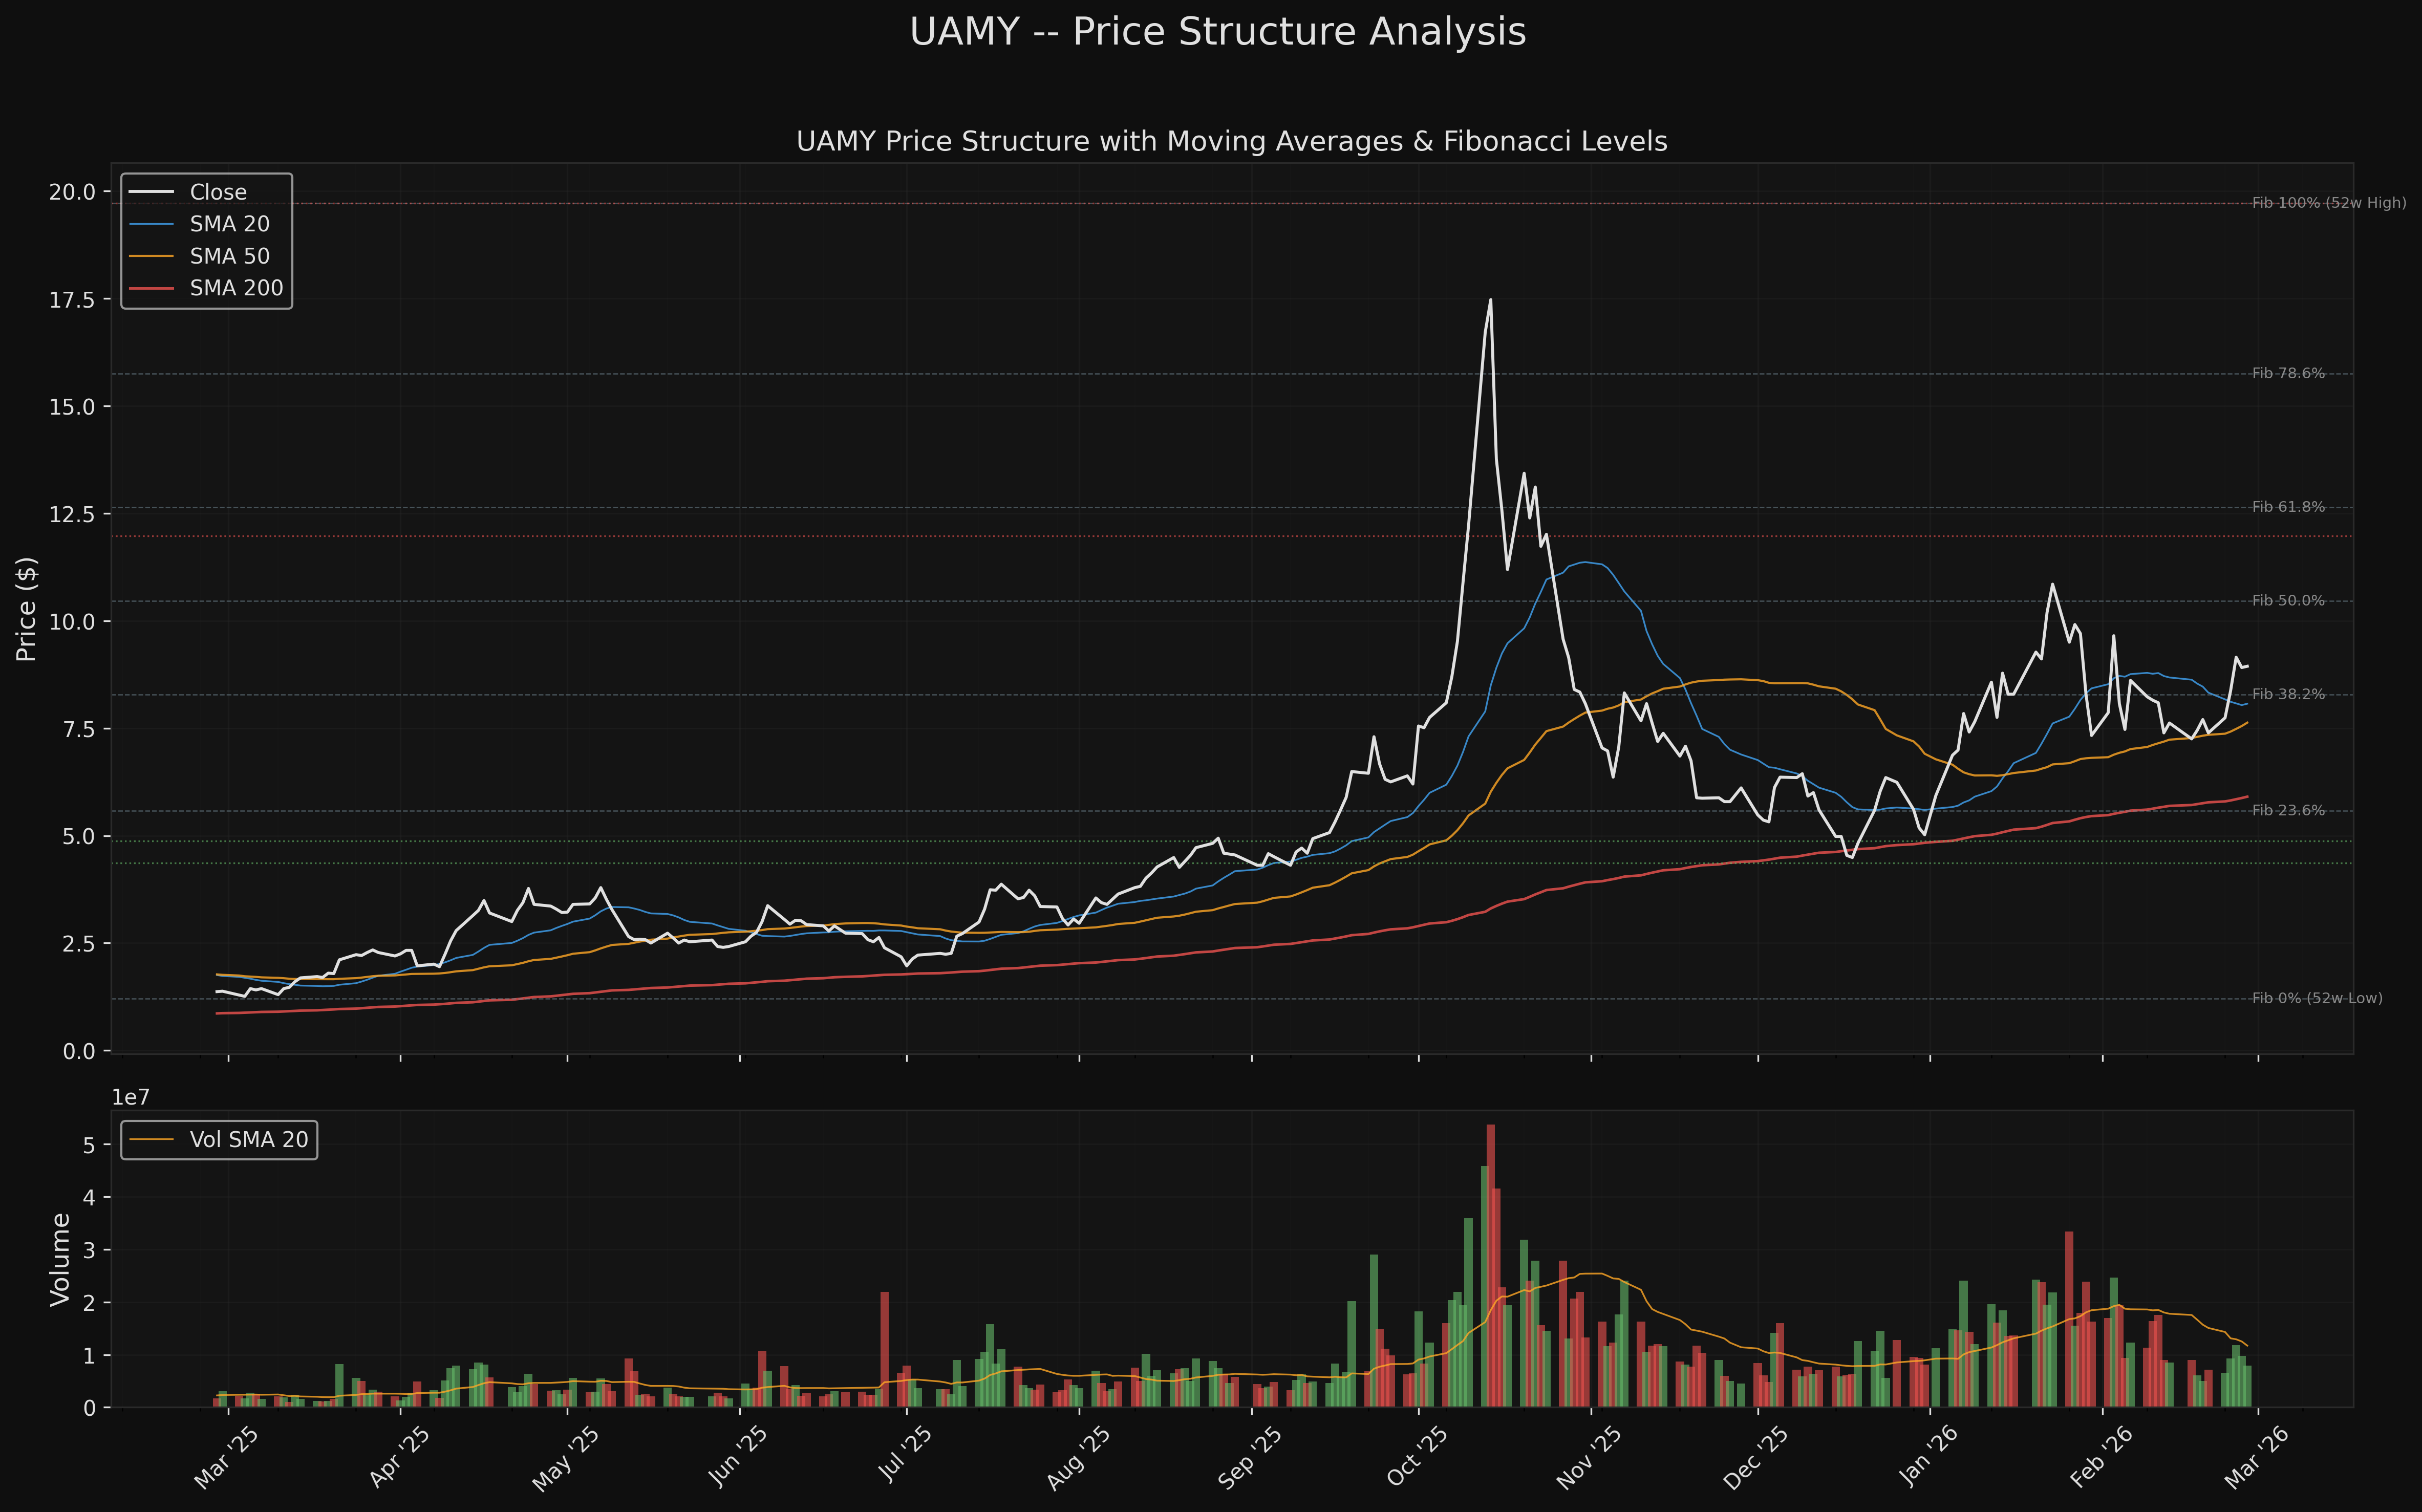
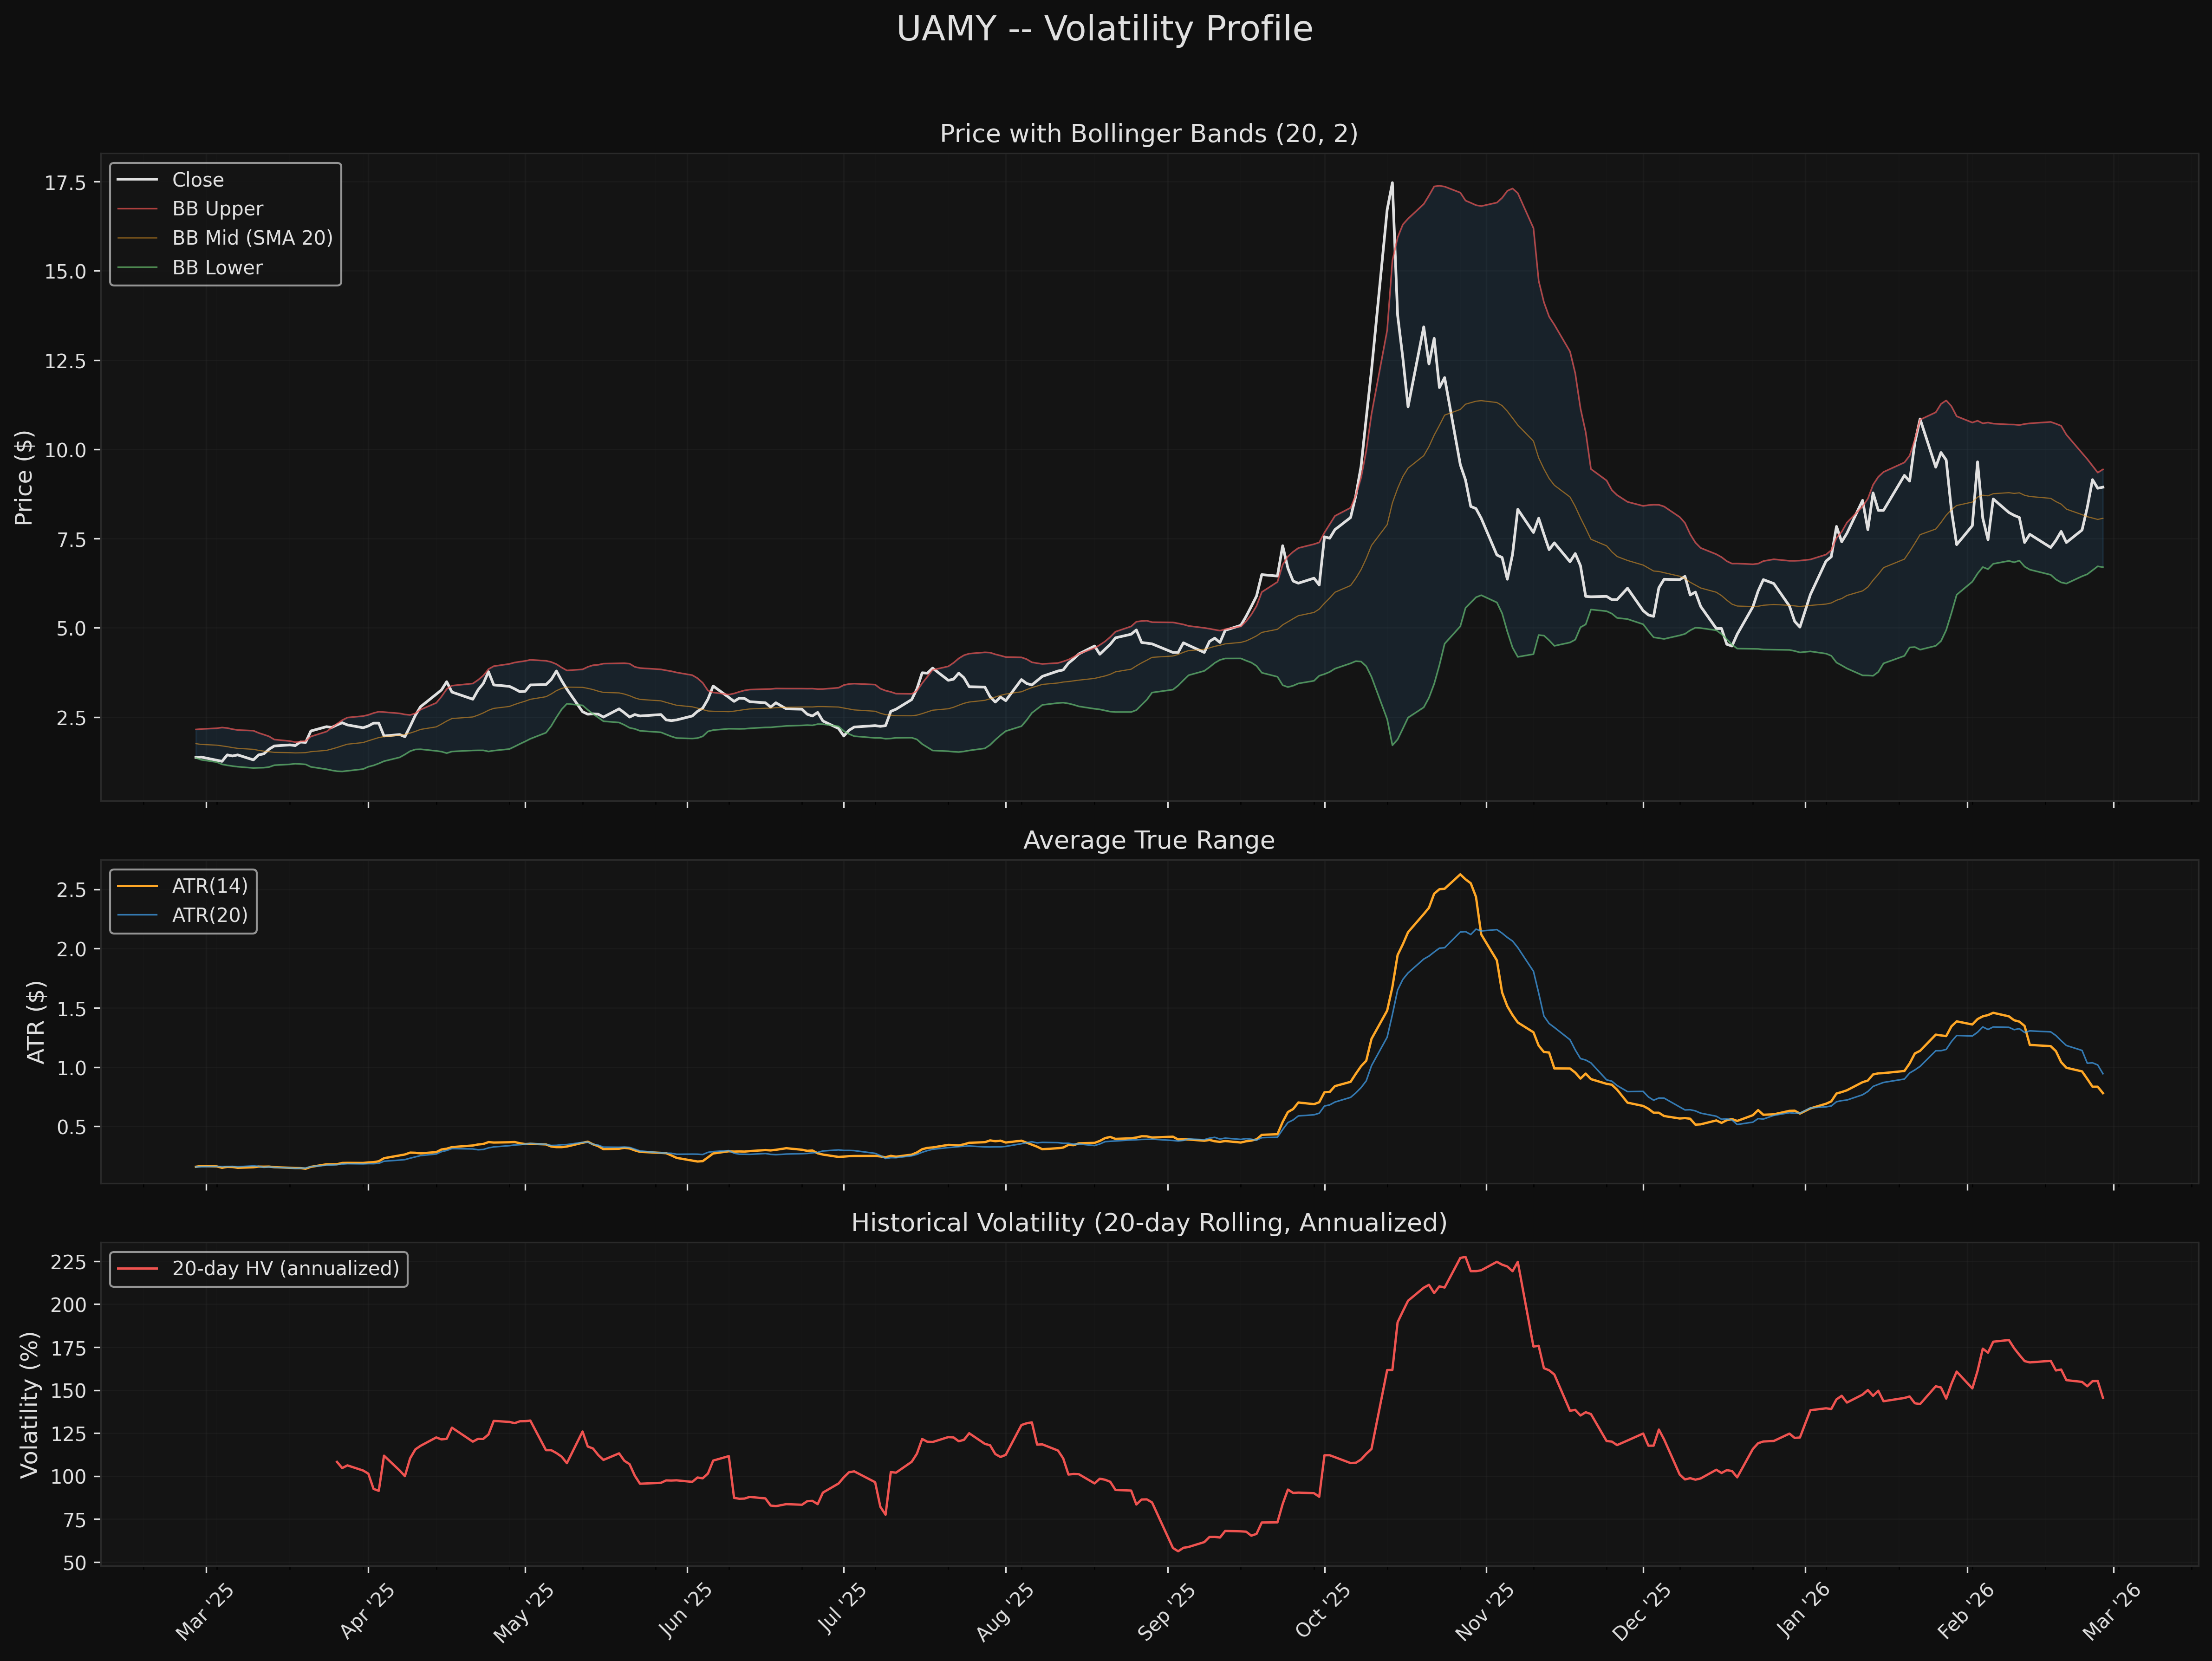
Trend: All MAs bullishly aligned (10>20>50>100>200 SMA); price +51.4% above 200 SMA; SMA 50 slope +12.03%. Momentum: Fresh MACD bullish crossover (Feb 25); RSI(14) neutral at 53.6; stochastics overbought at 84.4. Key Levels: Support $7.05 (consolidation lows), Resistance $11.97 (Jan 2026 swing high).
(Full report: analysis/quant-research/UAMY-technical-2026-03-01.md)
AGREEMENT Assessment
Fundamental-Technical Alignment: CONFLICTING
Fundamentals and technicals are in direct conflict on UAMY.
The fundamental analysis assigns a 43.2/100 score with an AVOID verdict, driven by extreme valuation multiples (P/S 38x on TTM revenue of ~$33M) and 3 distinct HIGH red flags including hidden margin compression (Q1 33.9% -> Q3 23.1%). The report concludes the $1.27B market cap prices in full delivery of $125M 2026 guidance that Q3 2025's 17% sequential revenue decline ($10.5M -> $8.7M) suggests may already be failing. Valuation scored 20/100 -- the lowest component -- reflecting zero margin of safety at current multiples.
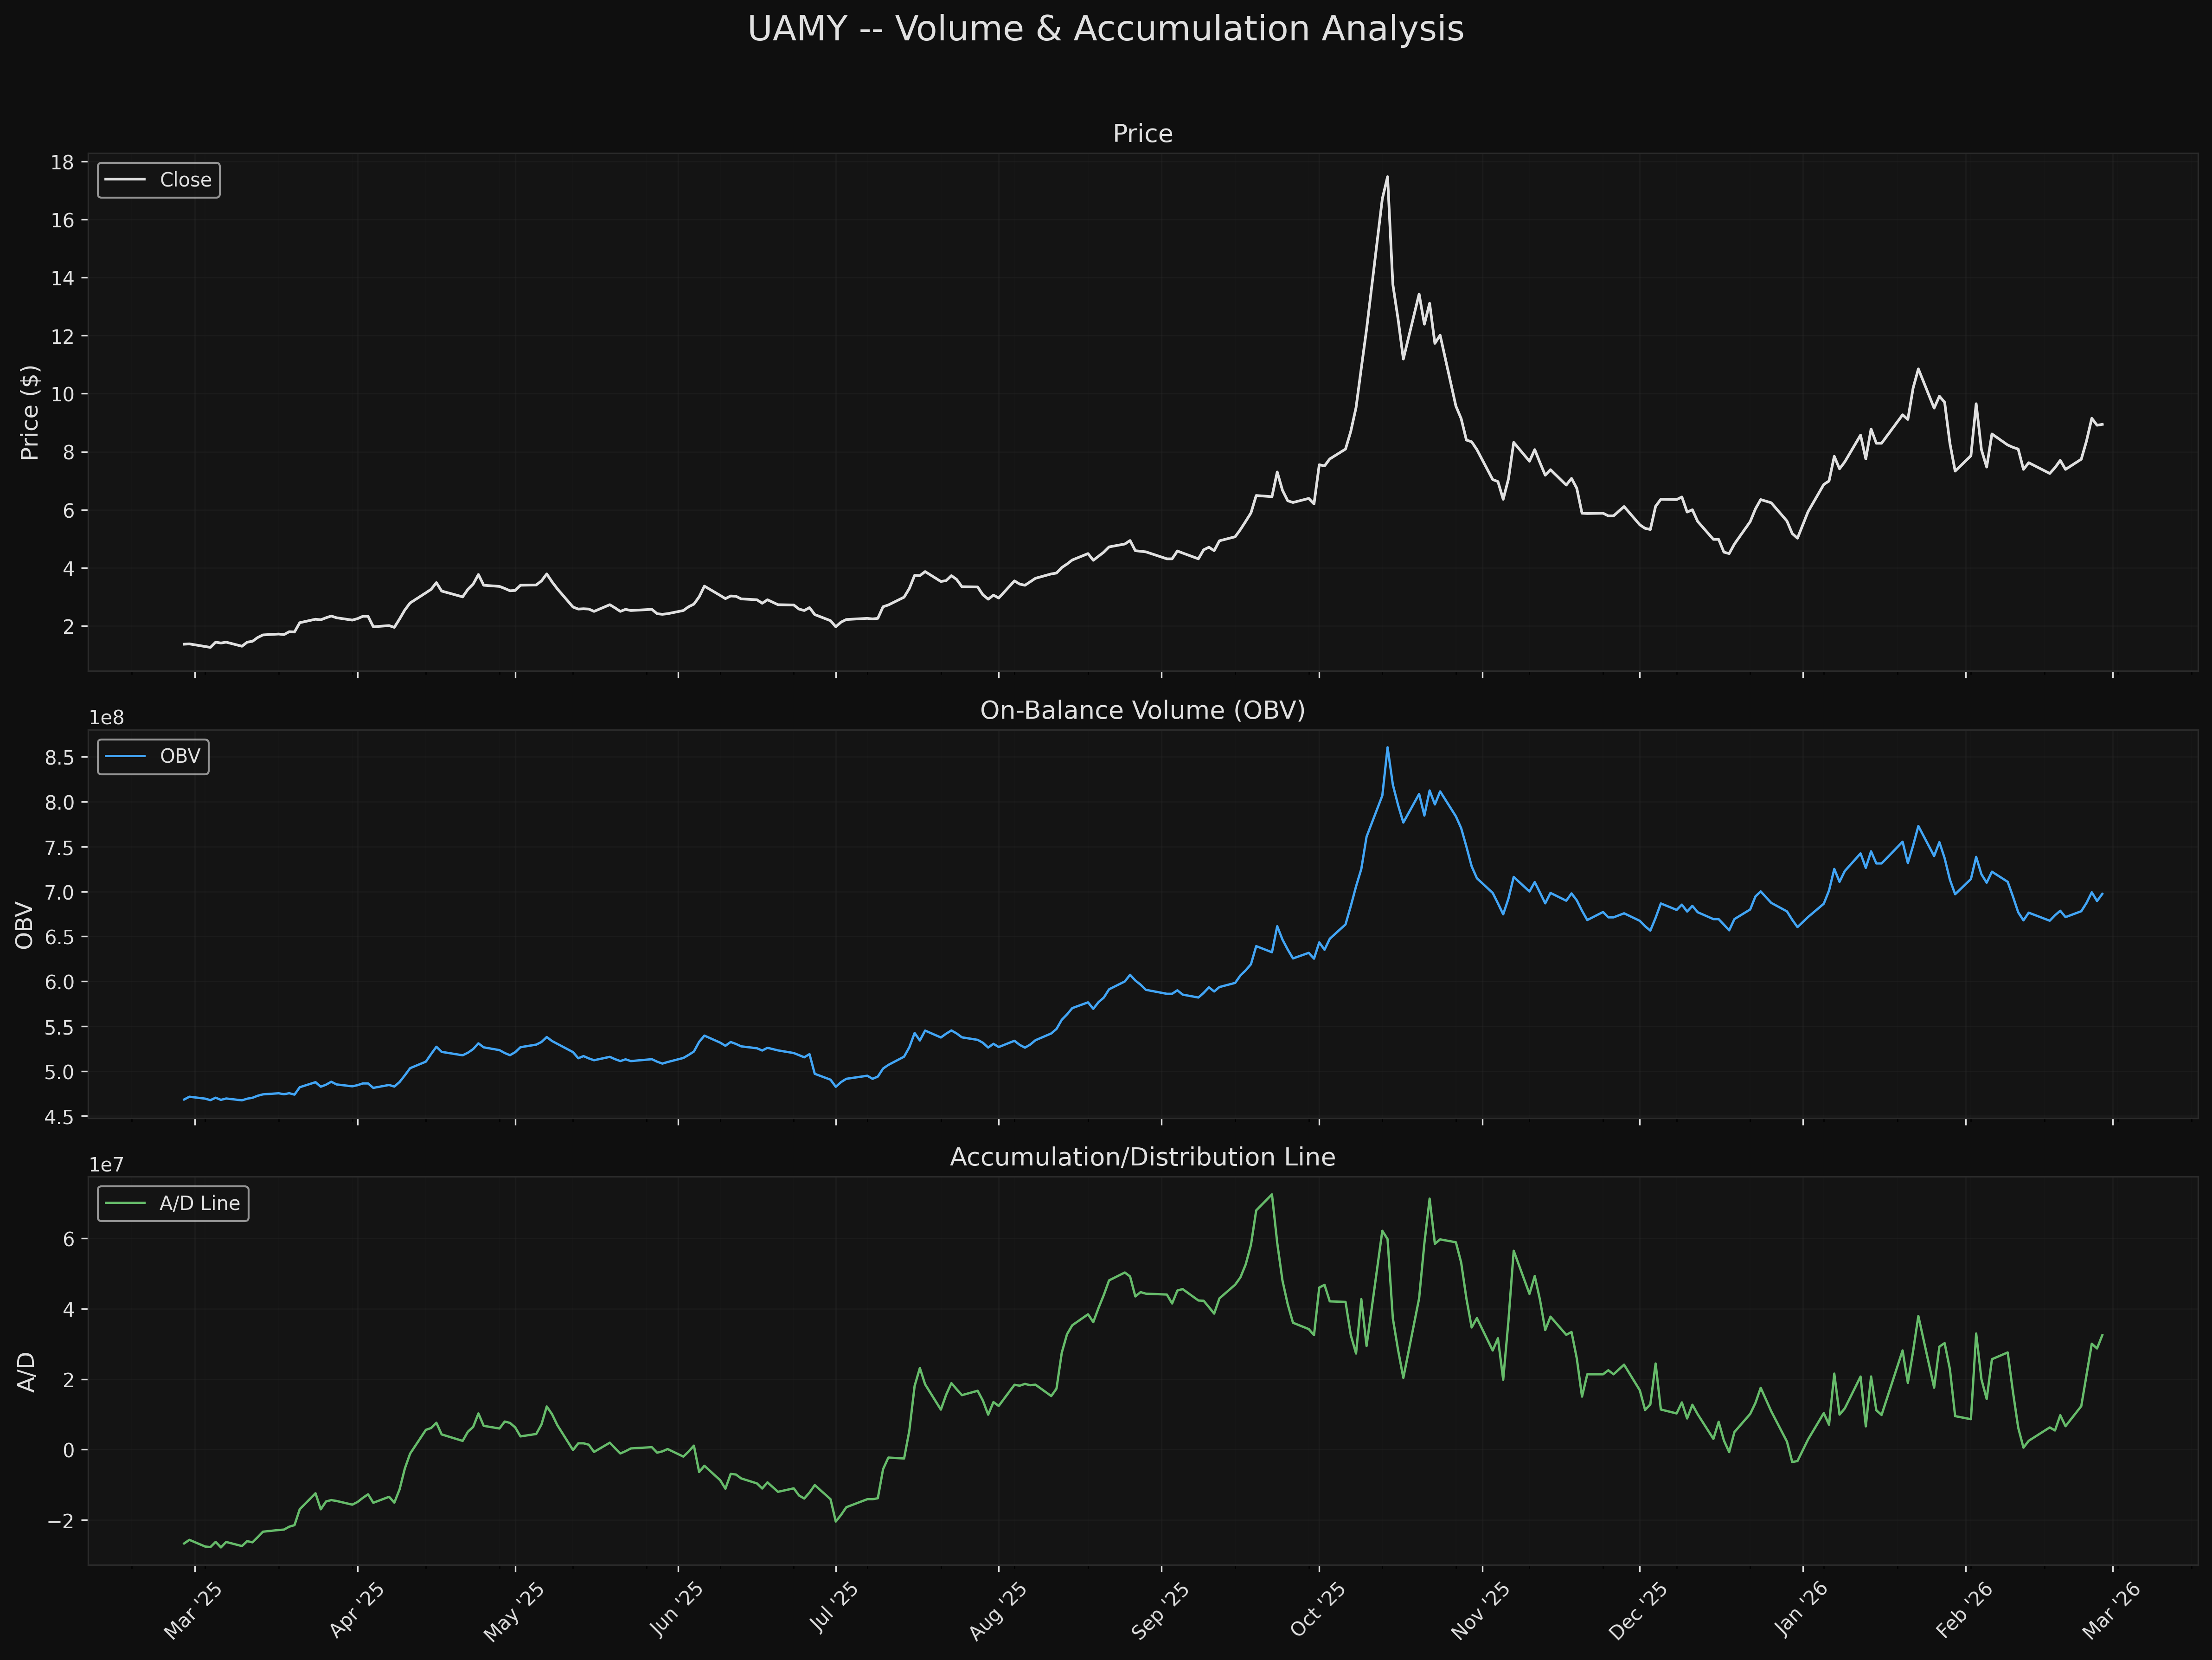
The technical analysis scores 7.9/10 with a Bullish bias, finding a textbook bullish MA alignment (all 5 SMAs positively stacked, scored 10.0/10 on trend), a fresh MACD bullish crossover (Feb 25), and a Wyckoff accumulation phase with range contracting 51% in the second half of the 120-day window. The accumulation base between $7-$10 shows net buying pressure via OBV (697.4M, rising) and A/D line confirmation (32.5M, trending up).
Specific conflict points:
-
Fundamentals flag the Q3 revenue miss (-32% vs. consensus) and sequential decline ($10.5M -> $8.7M) as evidence of failing execution. Technicals show the stock absorbed this news and is building a base with a +54.4% three-month return, suggesting the market may be looking past Q3.
-
Fundamentals score valuation at 20/100 (extreme). The technical trend alignment score of 10.0/10 implicitly validates the price -- the trend does not care about valuation. Price sits 51.4% above the 200 SMA.
-
The 19.2% short interest flagged by fundamentals (near extreme >20% threshold) has not prevented technical uptrend formation, but it represents sophisticated bearish conviction that could accelerate any breakdown.
-
Both analyses agree on extreme volatility: 146% annualized HV is flagged as HIGH risk technically, and the fundamental report's base case ($4-$7 re-rating) implies 44-78% downside from current levels.
Bottom line: This is a momentum/story trade, not a value trade. The technical setup is strong but the fundamental floor is extremely low if the narrative breaks. The Q4 earnings report (April 6) is the binary catalyst that will likely resolve the conflict between these two views.
Key Levels
| Level | Price | Source |
|---|---|---|
| Resistance 2 | $15.75 | Fibonacci 78.6% retracement of $1.21-$19.71 range |
| Resistance 1 | $11.97 | January 2026 swing high |
| Current Price | $8.94 | -- |
| Support 1 (Zone 1) | $7.00-$7.50 | SMA 50 ($7.63) / consolidation low cluster ($7.05) |
| Support 2 (Zone 2) | $5.80-$6.20 | 200 SMA ($5.91) / structural support ($6.09) |
Risk/Reward Framework
Scenario 1: Zone 1 Entry (SMA 50 Pullback)
- Entry: $7.00-$7.50 (pullback to SMA 50 / consolidation low cluster)
- Target: $11.97 (January 2026 swing high)
- Stop: $6.00 (below 200 SMA and structural support)
- R:R: 3.78:1 (to T1) / 6.80:1 (to T2)
- Probability: Moderate (aligns with Fib 38.2% anchor at $8.28 above)
Scenario 2: Zone 2 Entry (200 SMA Deep Pullback)
- Entry: $5.80-$6.20 (deep pullback to 200 SMA / structural support)
- Target: $11.97 (January 2026 swing high)
- Stop: $6.00 (below 200 SMA)
- R:R: 5.97:1 (to T1)
- Probability: Lower (requires significant correction, but maximum conviction entry)
Note: At current price ($8.94), the R:R to T1 is only 1.56:1, which does not meet a minimum 2:1 threshold for new entries. Patience for a pullback to Zone 1 is strongly recommended given the fundamental headwinds.
Conviction Assessment
| Component | Value | Rationale |
|---|---|---|
| Fund-Tech Agreement | 0.30 | Conflicting: AVOID (43.2/100) vs Bullish (7.9/10) |
| Catalyst Density | 0.60 | Moderate: Q4 earnings (Apr 6) binary, DLA orders ongoing, antimony price headwind |
| Data Quality | 0.40 | Small-cap ($1.3B) with 12 fundamental modules but RS Screener/Immune System unavailable, insider data web-scraped, single analyst coverage |
| Risk/Reward Asymmetry | 0.90 | Zone 1 entry ($7.25) / stop $6.00 / T1 $11.97 = R:R 3.78:1 (>3:1) |
| Red Flag Severity | 0.40 | Mixed: 3 structural/disclosed HIGH + 1 hidden/undisclosed HIGH (margin compression) |
Conviction Score: 3 (Moderate) Weighted Score: 51.0/100 Position Sizing: 50% of target (starter position)
Actionable Framework
Position Type: New (speculative starter only) Position Size: 2-3% of portfolio. Conviction is Moderate (3/5) but the extreme volatility (146% annualized) and conflicting fundamental/technical signals warrant sizing at the low end of the starter range. Standard 50% of target = 2.5-3.5%; volatility adjustment pulls toward 2%.
Entry Zones: - Zone 1: $7.00-$7.50 | Trigger: Pullback to SMA 50 ($7.63) / consolidation low cluster ($7.05). Preferred entry. Aligns with Fib 38.2% anchor at $8.28 above. R:R 3.78:1 to T1. - Zone 2: $5.80-$6.20 | Trigger: Deep pullback to 200 SMA ($5.91) / structural support ($6.09). Maximum conviction entry. R:R 5.97:1 to T1.
Stop Loss: $6.00 | Below 200 SMA ($5.91) and structural support at $6.09. A break below the 200 SMA invalidates the bullish trend structure and the Wyckoff accumulation thesis. Also below the fundamental base-case re-rating range ($4-$7 per fundamental thesis).
Targets: - Target 1: $11.97 | January 2026 swing high -- the most recent failed breakout attempt. A close above this level confirms accumulation phase is resolving into markup. - Target 2: $15.75 | Fibonacci 78.6% retracement of the $1.21-$19.71 52-week range. Represents meaningful recovery toward prior highs.
Key Monitoring Triggers:
Upgrade thesis if: - Q4 2025 earnings (April 6) show sequential revenue acceleration above $13M AND gross margin stabilization above 25% - 2026 guidance is reaffirmed or raised with specific delivery order evidence - Price closes above $11.97 (Jan high) on above-average volume, confirming markup phase
Downgrade thesis if: - Q4 revenue comes in below $10M (sequential decline continues) - Gross margin falls below 20% (compression accelerates) - 2026 guidance is reduced below $100M - Short interest exceeds 25% of float
Exit immediately if: - Price closes below $6.00 (200 SMA break + structural support loss) - Material equity dilution announced (fourth raise would push shares outstanding above 160M) - Antimony prices collapse below $20K/tonne, invalidating the revenue model
Limitations: - Fundamental analysis is 4 days older than technical (Feb 25 vs. Mar 1). No material events occurred between dates. - RS Screener and Immune System outputs were not available for the fundamental analysis, limiting cross-model validation. - Insider transaction data was sourced via web search rather than direct SEC EDGAR pulls and may be incomplete. - Short trading history at current price levels ($7-$10 zone has only ~5 months of data) reduces reliability of support/resistance levels. - Single analyst coverage (HC Wainwright, Buy, $10.25 PT) provides limited consensus validation. - Antimony pricing data quality is limited -- spot prices from Fastmarkets projections, not direct futures/contract data.
Charts