UAMY — Technical Summary
Conviction 3===========================================================
UAMY -- Technical Analysis 2026-03-01
Asset Class: Equity
Price: $8.94 | 52wk: $1.21 - $19.71
===========================================================
OVERALL SCORE: 7.9/10 BIAS: Bullish
COMPONENT SCORES
-----------------------------------------------------------
Trend Alignment 10.0/10 wt 25% All MAs bullishly aligned
Momentum 7.5/10 wt 20% MACD bullish, RSI neutral
Volume Confirmation 7.5/10 wt 20% OBV rising, volume declining
Volatility Profile 8.0/10 wt 15% Squeeze forming, positive skew
Market Structure 6.0/10 wt 20% Accumulation phase, -55% from ATH
KEY LEVELS
-----------------------------------------------------------
Resistance 2: $19.71 52-week / all-time high (Oct 2025)
Resistance 1: $11.97 January 2026 swing high
Current Price: $8.94
Support 1: $7.05 Recent consolidation low cluster
Support 2: $6.09 Structural support / December 2025 zone
RED FLAGS (2 found)
-----------------------------------------------------------
HIGH Extreme annualized volatility (146%) [Volatility]
-- significant risk of gap moves
MEDIUM Post-parabolic structure; -55% from [Structure]
ATH requires patience for base to mature
===========================================================
1. Executive Summary
UAMY scores 7.9/10 with a Bullish bias, driven by a textbook bullish moving average alignment and emerging accumulation structure following a dramatic parabolic advance and correction. The stock has rallied +553% over the past year from $0.17 (March 2024 all-time low) to its October 2025 all-time high of $19.71, subsequently pulling back ~55% to current levels near $8.94. All key moving averages (10/20/50/100/200 SMA) are positively stacked, the 50 SMA sits above the 200 SMA with a +8.3% 20-day slope, and the price trades well above every MA. Momentum is constructive with a fresh MACD bullish crossover (February 25), though stochastics are overbought at 84.4. The primary concern is extreme volatility (146% annualized) which demands disciplined position sizing and wide stops.
2. Price Structure
Current Position
| Metric | Value |
|---|---|
| Current Price | $8.94 |
| 52-Week High | $19.71 (Oct 14, 2025) |
| 52-Week Low | $1.21 |
| All-Time High | $19.71 (Oct 14, 2025) |
| All-Time Low | $0.17 (Mar 11, 2024) |
| % from 52w High | -54.6% |
| % from 52w Low | +638.8% |
| Position in 52w Range | 41.8% |
Recent Performance
| Period | Return |
|---|---|
| 1 Day | +0.34% |
| 1 Week | +15.50% |
| 1 Month | +7.84% |
| 3 Month | +54.40% |
| 6 Month | +95.62% |
| 1 Year | +552.55% |
| YTD 2026 | +50.76% |
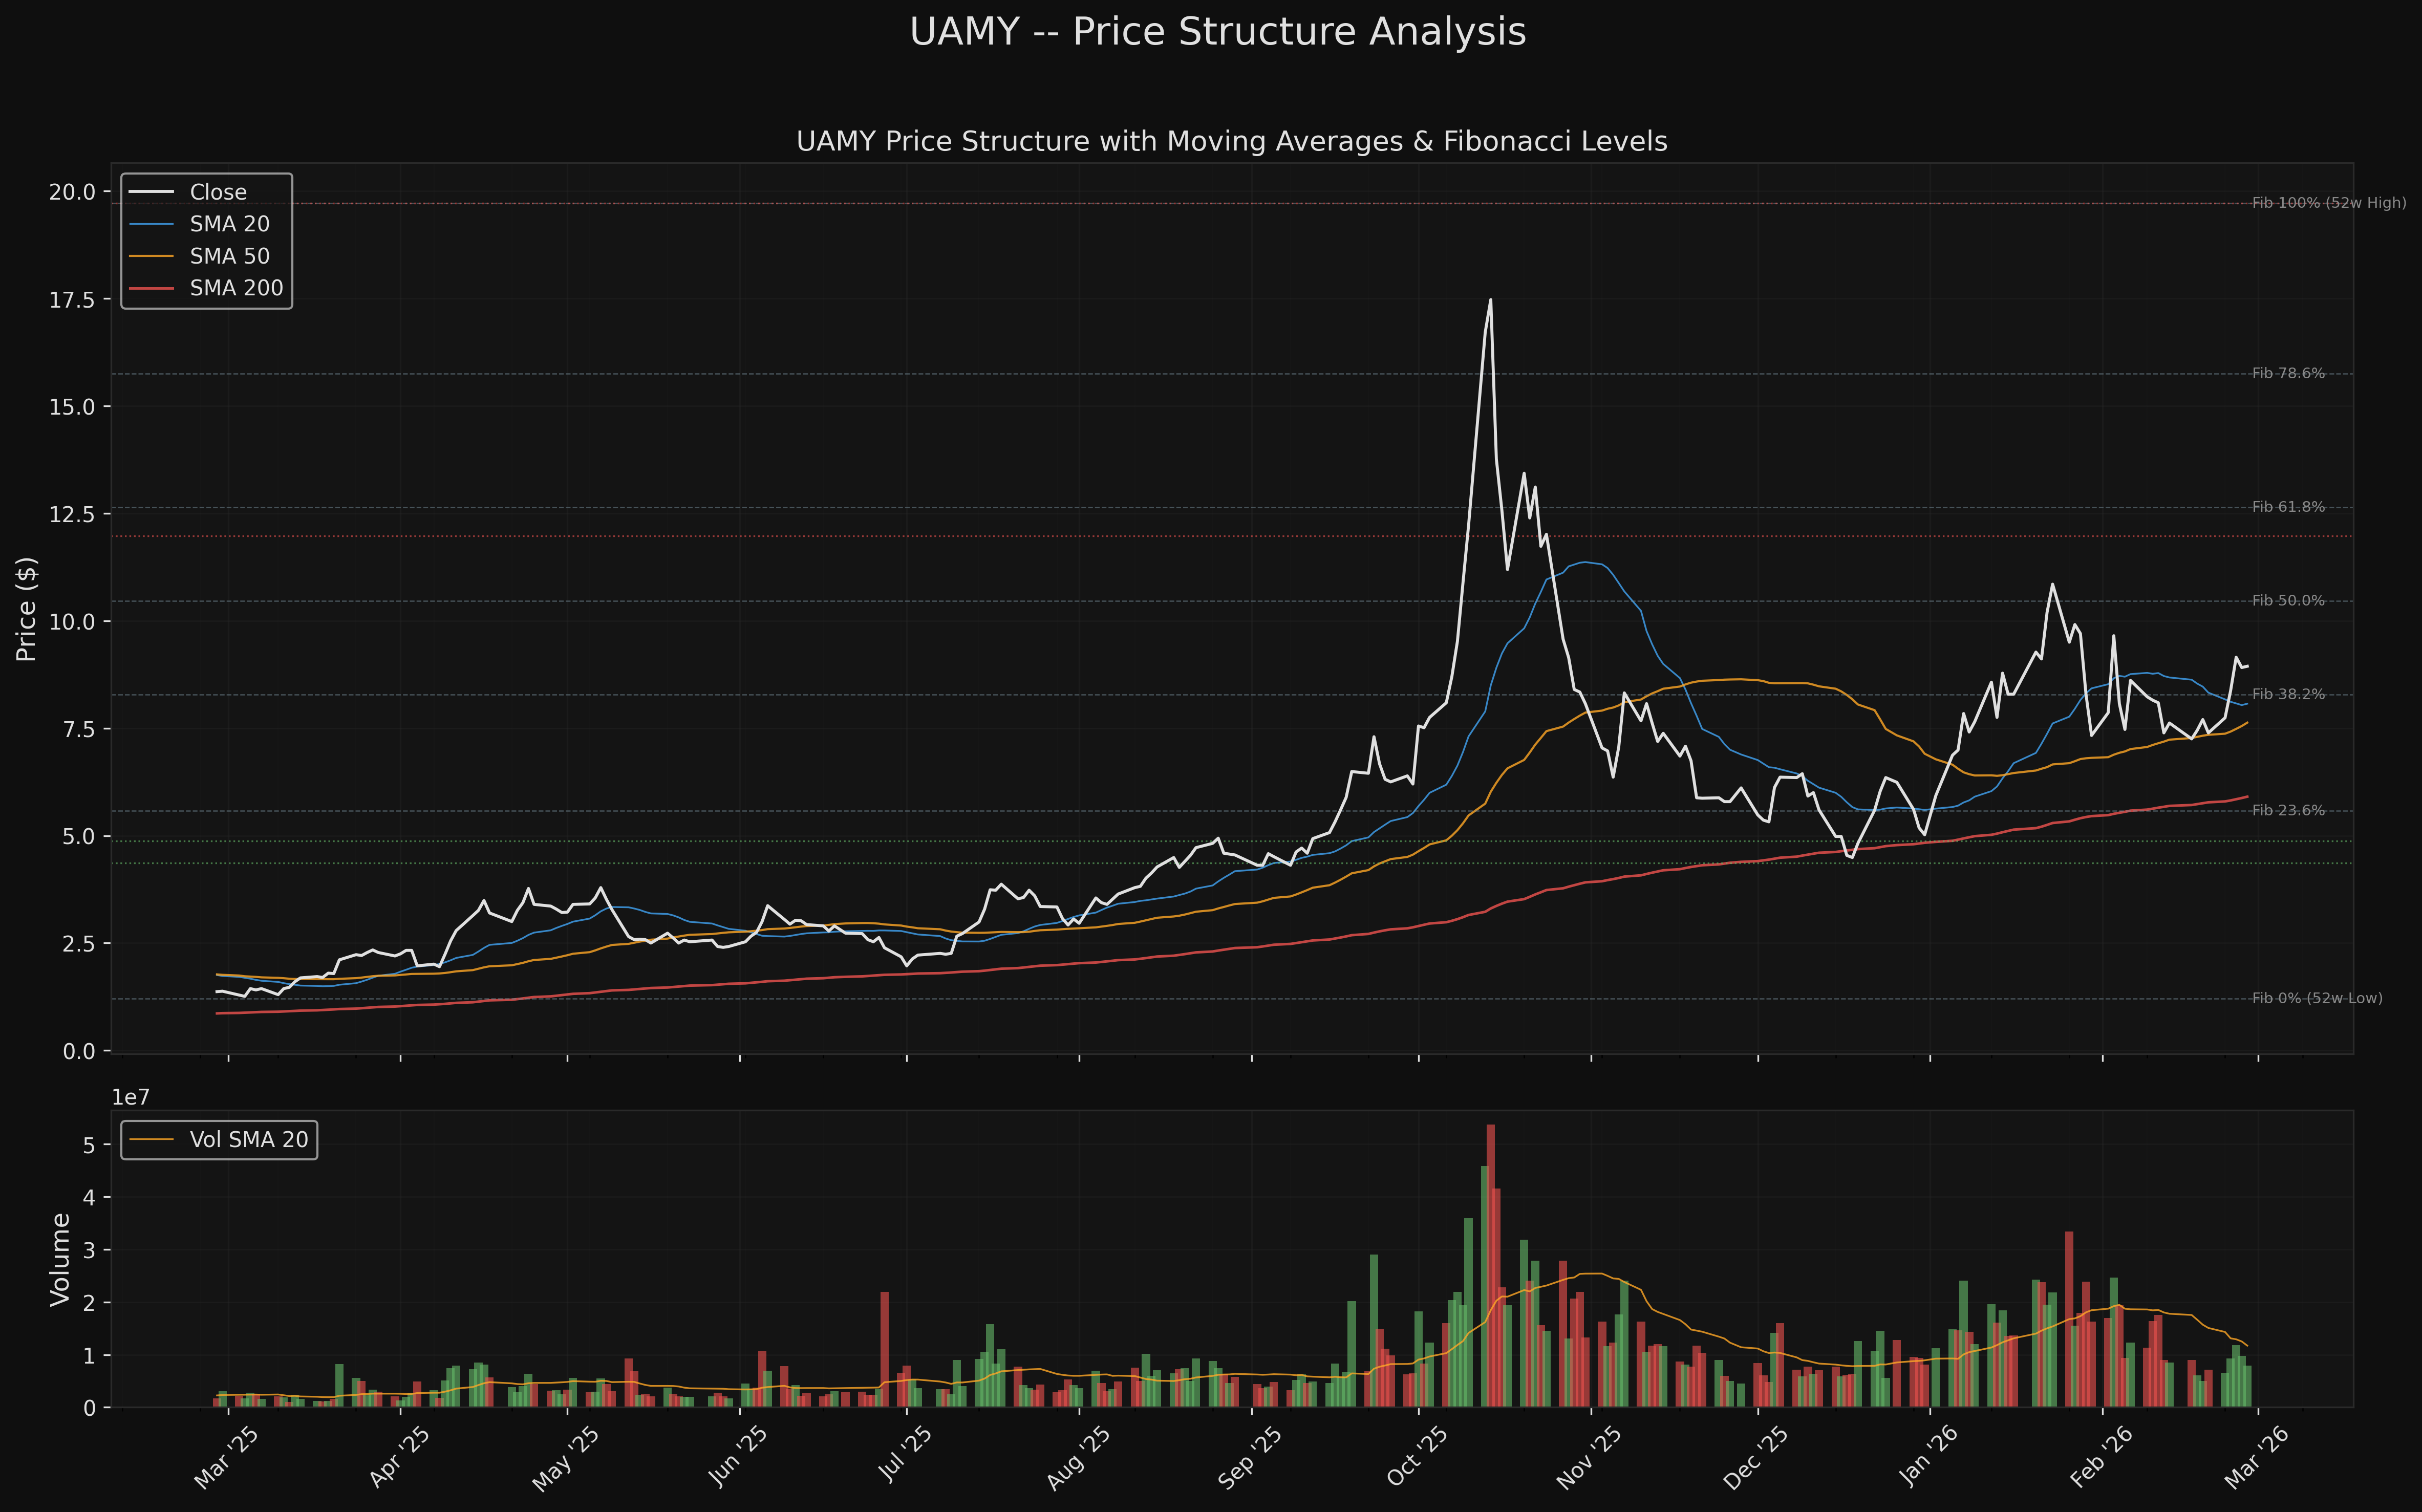
Fibonacci Retracement Levels (52-Week)
The 52-week range from $1.21 to $19.71 yields the following Fibonacci levels:
| Level | Price | Status |
|---|---|---|
| 100% (52w High) | $19.71 | Resistance |
| 78.6% | $15.75 | Resistance |
| 61.8% | $12.64 | Resistance |
| 50.0% | $10.46 | Resistance |
| 38.2% | $8.28 | Near current price |
| 23.6% | $5.58 | Support |
| 0% (52w Low) | $1.21 | Distant |
The current price ($8.94) sits just above the 38.2% Fibonacci retracement at $8.28, which acts as near-term support. The 50% retracement at $10.46 is the next upside Fibonacci target.
3. Market Structure (Wyckoff Phase)
Phase: ACCUMULATION
Quantitative evidence from the last 120 trading days:
| Metric | Value | Interpretation |
|---|---|---|
| Price trend (linear regression) | +2.2% | Near-flat with no statistical significance |
| R-squared of trend | 0.000 | No directional trend explains price movement |
| P-value | 0.8984 | Trend is statistically insignificant |
| Range ratio (2nd half / 1st half) | 0.49 | Range contracting sharply -- classic accumulation |
| Avg volume on up days | 15.36M | Higher than down days |
| Avg volume on down days | 13.37M | Moderate selling pressure |
| Up/Down volume ratio | 1.15 | Slight buying bias |
Interpretation: The 120-day window captures the aftermath of the October 2025 parabolic spike to $19.71. The first half of this window contained the volatile selloff (range $4.36 to $19.71), while the second half shows a dramatically tighter range ($6.88 to $11.97). This 51% contraction in range, combined with flat-to-sideways price action and a mild buying volume bias, is consistent with a Wyckoff accumulation schematic. The stock appears to be building a base between $7 and $10 after the parabolic blowoff.
Caution: The accumulation phase can be protracted. Post-parabolic bases often take 3-6 months (or longer) to mature before a sustained markup phase begins. We are approximately 4.5 months from the ATH. The January 2026 re-test of $11.97 (which failed to hold) and subsequent reversion to the $7-$9 range suggests the base is still forming.
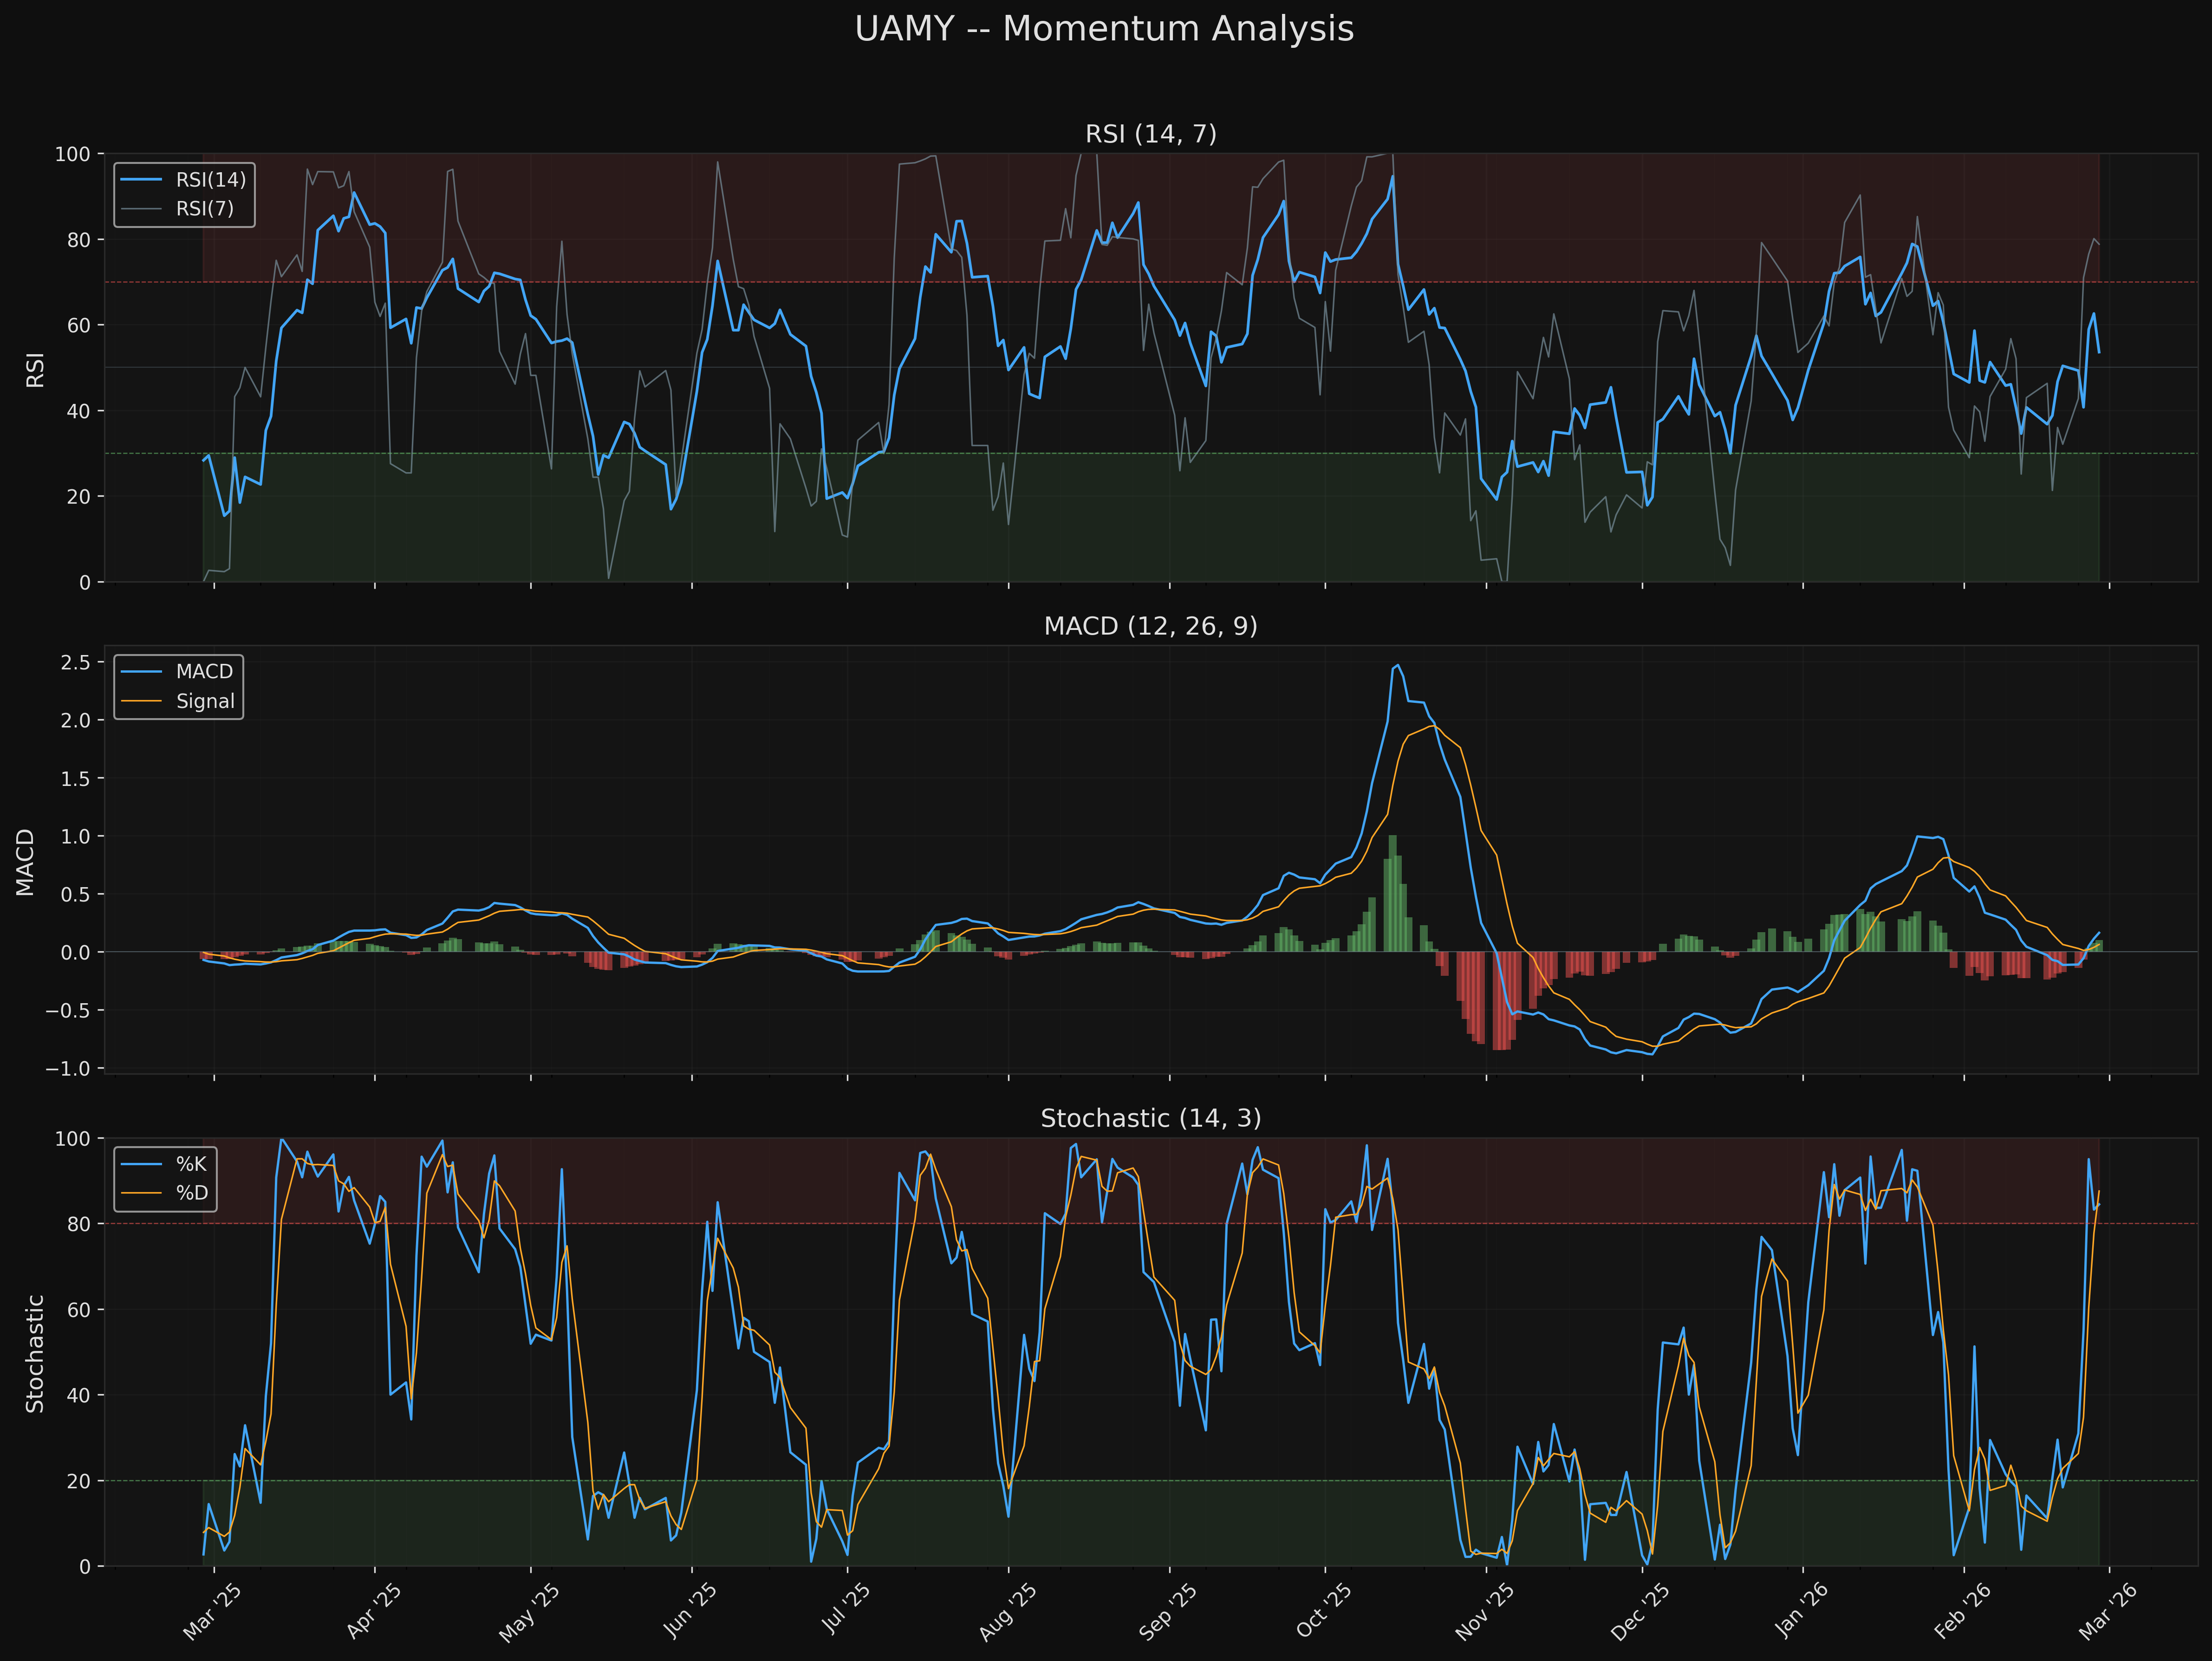
4. Momentum Analysis
RSI (Relative Strength Index)
| Period | Value | Zone |
|---|---|---|
| RSI(14) | 53.6 | Neutral |
| RSI(7) | 78.8 | Overbought (short-term) |
RSI(14) is neutral at 53.6, giving the stock room to run in either direction without being stretched. The short-term RSI(7) at 78.8 reflects the recent +15.5% weekly move but hasn't reached extreme levels yet. The neutral RSI(14) is constructive -- it indicates the recent rally from the $7 zone has not yet exhausted the stock's upside momentum capacity.
MACD (12, 26, 9)
| Component | Value |
|---|---|
| MACD Line | +0.1634 |
| Signal Line | +0.0630 |
| Histogram | +0.1004 |
| Crossover | Bullish (Feb 25, 2026) |
The MACD just generated a bullish crossover on February 25 -- the most recent signal. The histogram is positive and expanding, indicating building bullish momentum. This is a fresh signal (4 trading days old), which tends to have higher reliability in trending environments.
Stochastic Oscillator (14, 3)
| Component | Value | Zone |
|---|---|---|
| %K | 84.4 | Overbought |
| %D | 87.5 | Overbought |
Stochastics are in overbought territory above 80. In a strong uptrend, overbought stochastics can persist for extended periods (a feature, not a bug, of trending stocks). However, a %K cross below %D from above 80 would signal a short-term pullback and a potential entry opportunity.
Momentum Summary
The three oscillators present a constructive picture: RSI neutral (room to run), MACD freshly bullish (early-stage), and stochastics overbought (reflecting recent strength). The primary risk is that the overbought stochastics resolve through a pullback before the next leg higher.
5. Moving Average Analysis
Current MA Positioning
| Moving Average | Value | Price Relation | Distance |
|---|---|---|---|
| SMA 10 | $8.05 | ABOVE | +11.0% |
| SMA 20 | $8.07 | ABOVE | +10.8% |
| SMA 50 | $7.63 | ABOVE | +17.2% |
| SMA 100 | $8.02 | ABOVE | +11.4% |
| SMA 200 | $5.91 | ABOVE | +51.4% |
| EMA 12 | $8.32 | ABOVE | +7.5% |
| EMA 26 | $8.15 | ABOVE | +9.7% |
MA Slope Analysis (20-day rate of change)
| MA | 20-Day Slope |
|---|---|
| SMA 50 | +12.03% |
| SMA 100 | +5.03% |
| SMA 200 | +8.30% |
All slopes are positive and accelerating, with the SMA 50 leading at +12.03%. This is characteristic of a strong intermediate-term trend.
Golden/Death Cross Status
Current: 50 SMA ABOVE 200 SMA (bullish structure). No golden or death cross events occurred in the most recent 60 trading days. The current spread between the 50 SMA ($7.63) and 200 SMA ($5.91) is $1.72, representing a 29.1% gap -- wide enough to suggest this trend has durability but also that a mean-reversion toward the 200 SMA is far away.
MA Alignment Assessment
The MA stack is fully bullish: SMA 10 > SMA 20 > SMA 50 > SMA 200, and EMA 12 > EMA 26. This is the strongest possible moving average configuration. The 51.4% distance above the 200 SMA is notable -- it indicates strong trend participation but also means that any sharp reversal toward the 200 SMA would represent a significant drawdown from current levels.
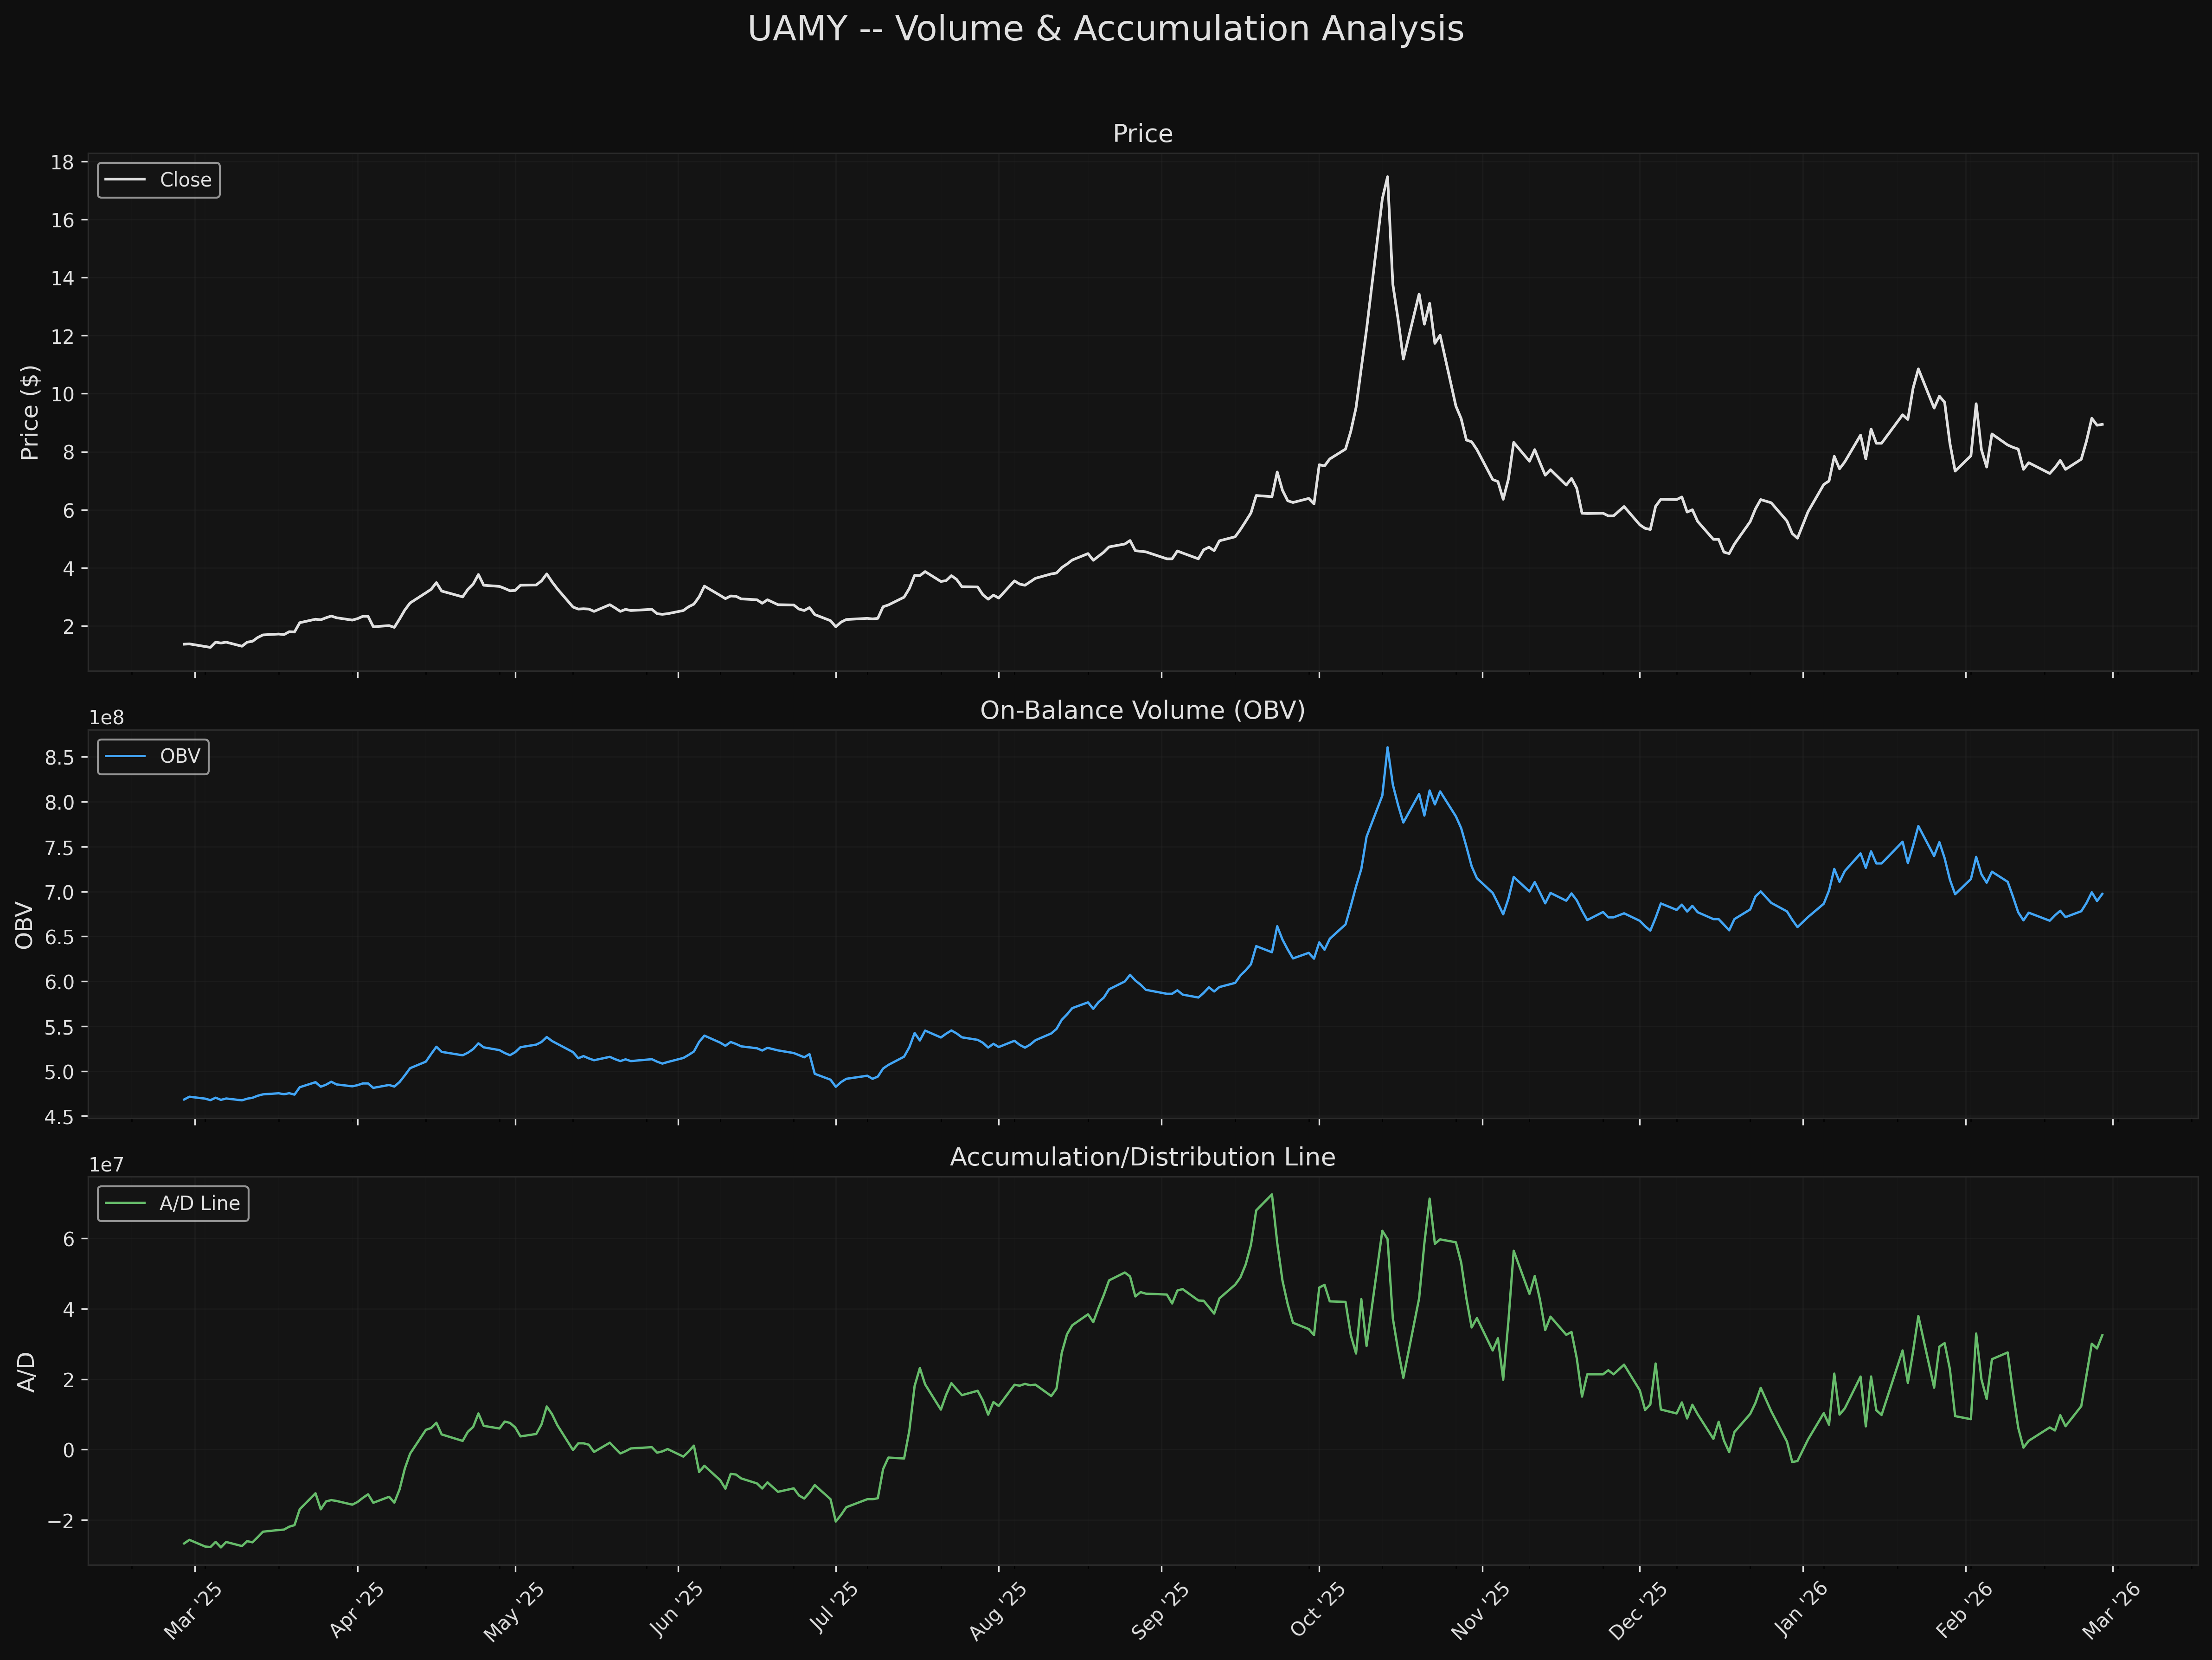
6. Volume Analysis
Volume Statistics
| Metric | Value |
|---|---|
| Last Session Volume | 7,922,900 |
| 20-Day Avg Volume | 11,703,815 |
| 50-Day Avg Volume | 13,761,760 |
| Last vs 20-Day Avg | -32.3% |
| 20-Day Volume Trend (vs prior 20d) | -35.1% |
| Daily Dollar Volume (20d avg) | ~$104.7M |
On-Balance Volume (OBV)
OBV is at 697.4M, rising and above its 20-day average. This confirms that the current price recovery is supported by net buying pressure. The OBV trend is consistent with the Wyckoff accumulation thesis -- buyers are absorbing supply at lower levels.
Accumulation/Distribution Line
The A/D line stands at 32.5M and has been trending upward over the past 20 sessions. This confirms that the close-location-value calculation (which weighs where within the daily range the close occurs) shows consistent accumulation.
Volume Trend Concerns
The -35.1% decline in 20-day average volume versus the prior 20-day period is the primary volume concern. Volume is declining as price recovers from the $7 zone -- this could indicate either:
- Benign: The parabolic blowoff volume (October 2025) is naturally normalizing, and current volume levels are healthy for the stock's normal trading range.
- Bearish: Buyer exhaustion is setting in, and the rally lacks sufficient participation to sustain.
Given that the up-day vs. down-day volume ratio is 1.15 (more volume on up days) and both OBV and A/D are confirming, interpretation #1 is more likely.
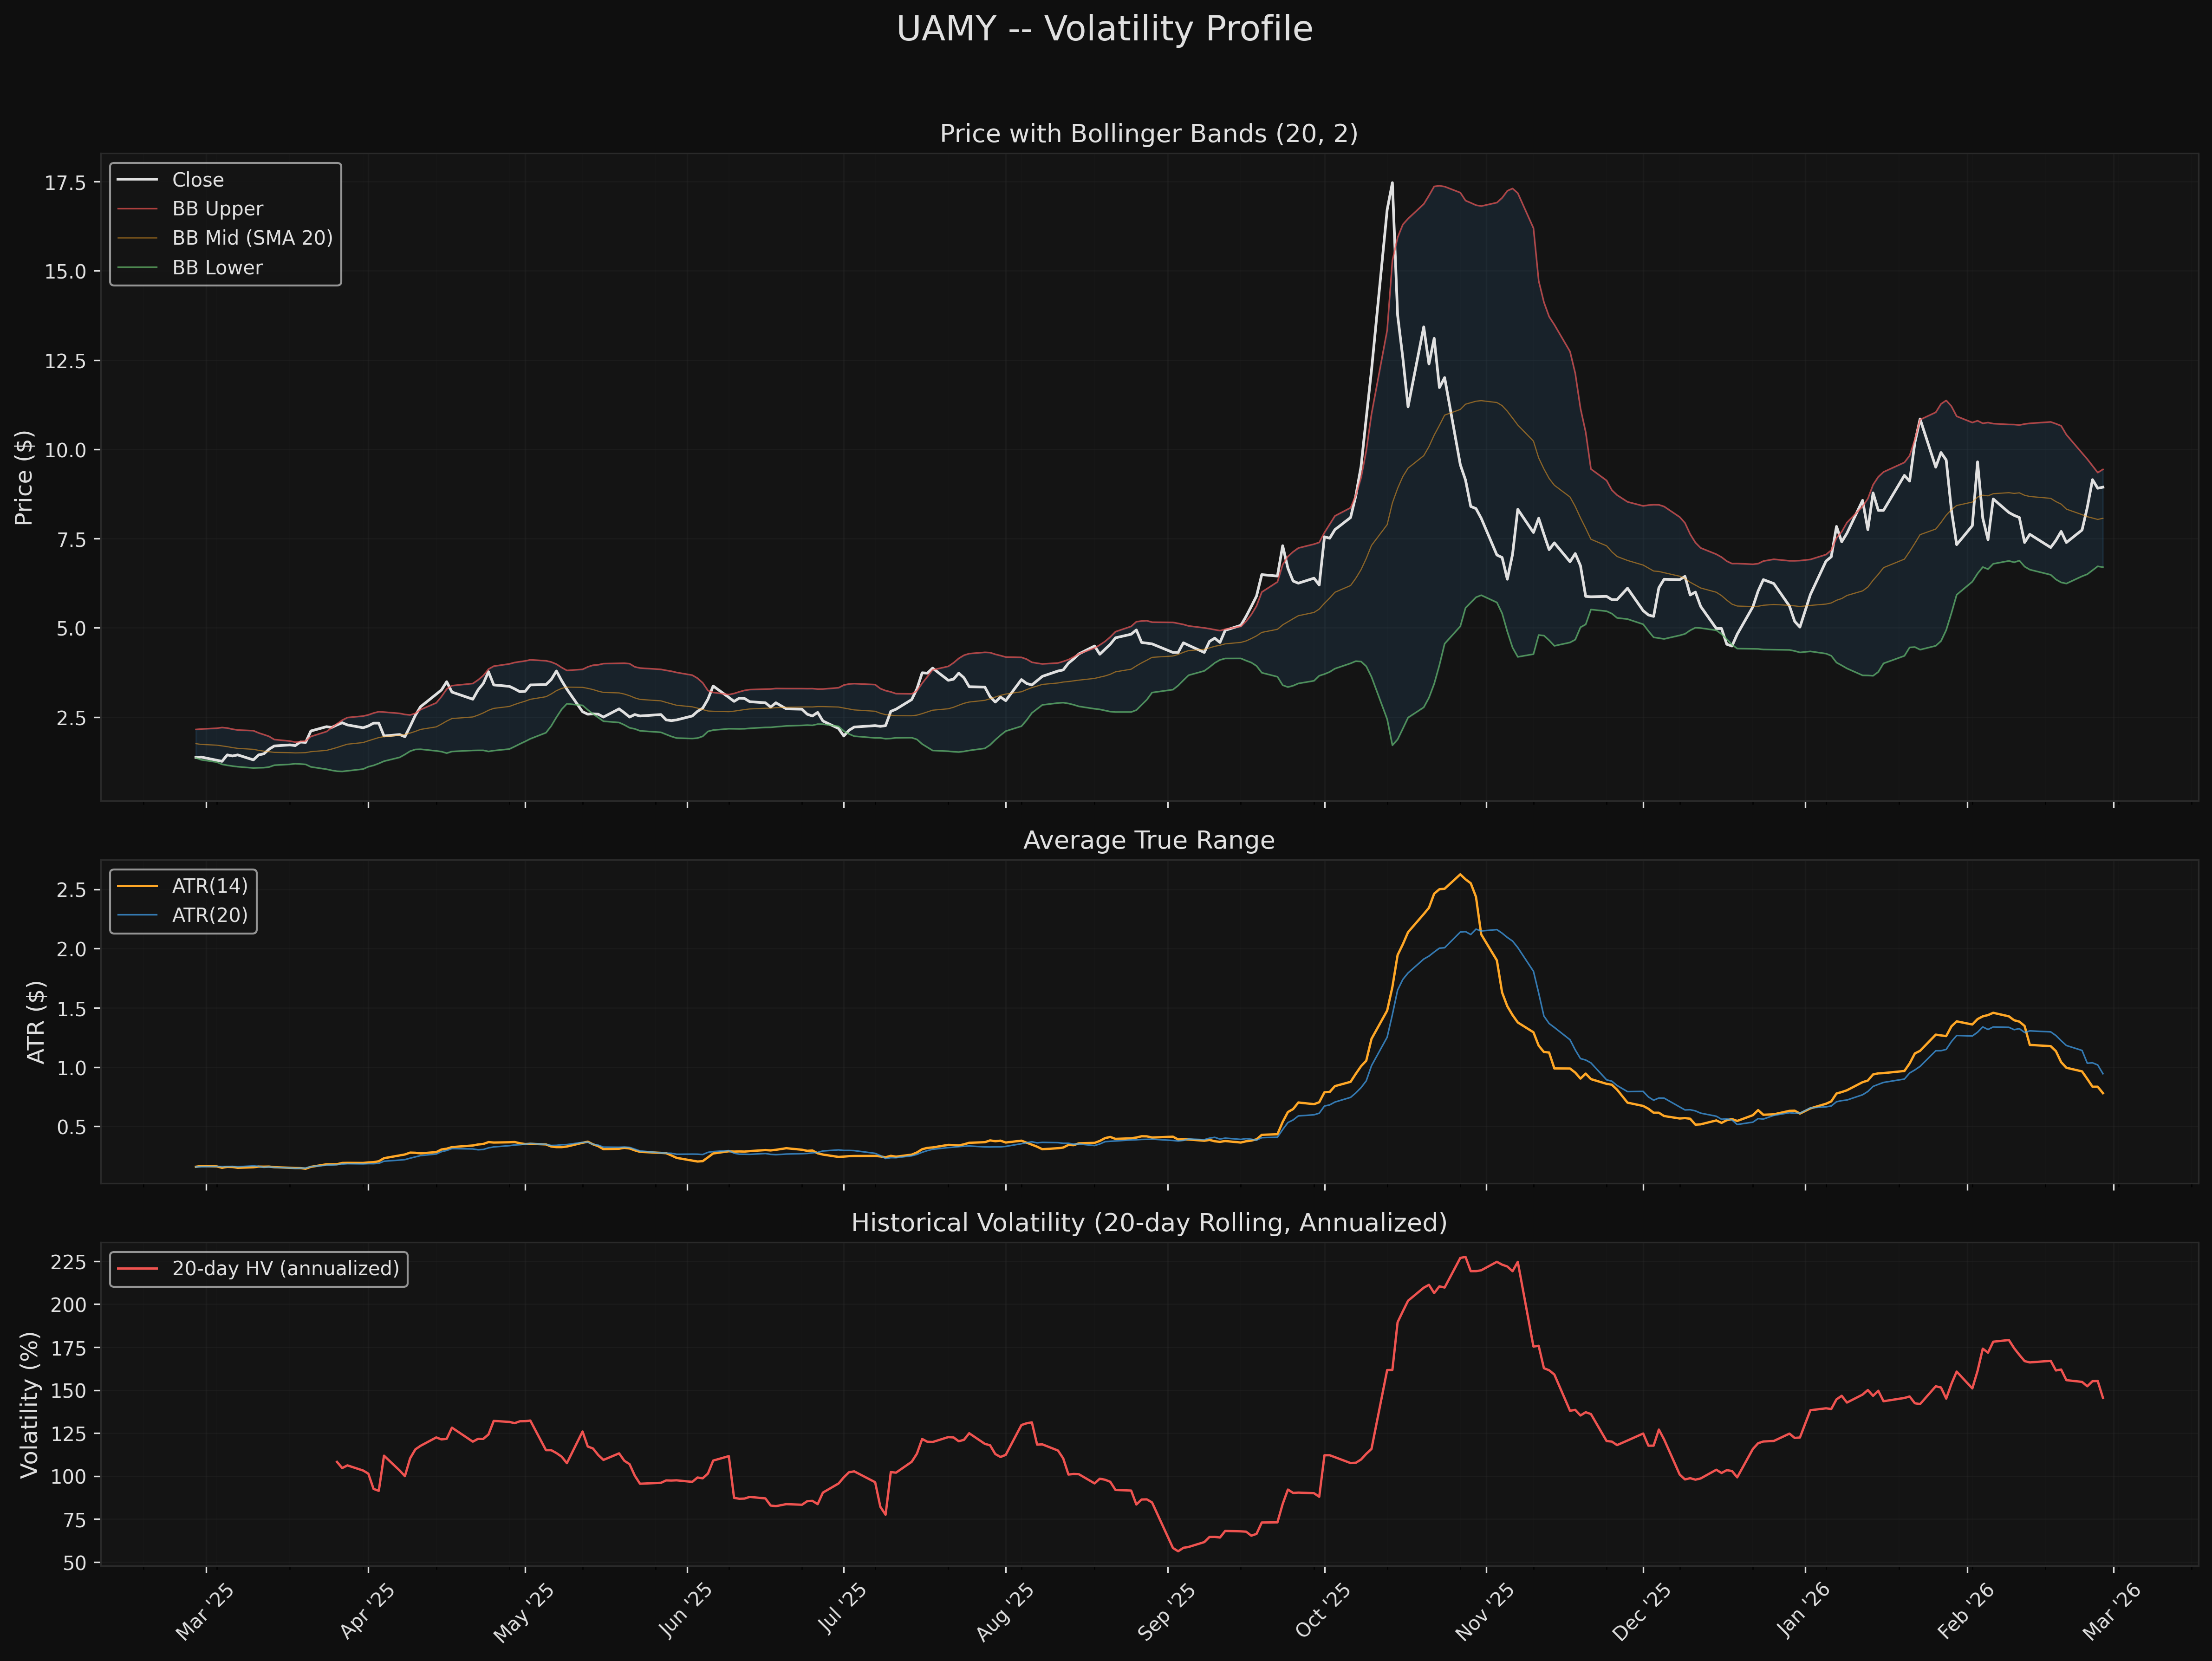
7. Volatility Profile
Average True Range (ATR)
| Period | ATR | % of Price |
|---|---|---|
| ATR(14) | $0.78 | 8.7% |
| ATR(20) | $0.94 | 10.6% |
An ATR of 8.7-10.6% of price is extremely high. For context, SPY's ATR is typically 0.5-1.5% of price. This means daily swings of ~$0.80-0.94 are normal -- stop losses must account for this range or they will be triggered by routine noise.
Bollinger Bands (20, 2)
| Band | Value |
|---|---|
| Upper | $9.44 |
| Middle (SMA 20) | $8.07 |
| Lower | $6.70 |
| Width | 34.0% |
| Price Position | 81.8% (0=lower, 100=upper) |
The price sits in the upper portion of the Bollinger Bands (81.8%), approaching the upper band at $9.44. The BB width of 34.0% has contracted from broader levels during the January volatility spike, suggesting a squeeze is forming. BB squeezes in trending stocks often resolve in the direction of the prevailing trend (bullish).
Historical Volatility (Annualized)
| Window | HV |
|---|---|
| 20-day | 145.5% |
| 60-day | 140.0% |
| Full history | 102.5% |
Return Distribution
| Statistic | Value |
|---|---|
| Mean daily return | +0.357% |
| Std daily return | 6.45% |
| Skewness | +2.641 |
| Kurtosis | 27.587 |
| Max daily gain | +81.6% |
| Max daily loss | -31.1% |
The return distribution shows extreme positive skewness (+2.641) and very high kurtosis (27.59). This means: (a) large positive moves are more common than large negative moves (favorable), and (b) extreme events occur far more often than a normal distribution would predict. The max daily gain of +81.6% dwarfs the max daily loss of -31.1%, confirming the asymmetric upside tail.
Volatility Assessment: This is an extremely volatile stock. The 146% annualized volatility places it in the top percentile of US equities. Position sizing must be reduced accordingly -- a standard equity position (5-7%) would expose the portfolio to outsized drawdown risk. The positive skewness is the silver lining: the fat tails are skewed to the upside.
8. Entry Point Assessment
Confluence Zone Ranking
Entries are ranked by confluence of technical support factors and resulting risk/reward.
Zone 1: $7.00 - $7.50 (Primary Accumulation Zone)
Confluence factors: - Recent consolidation low cluster at $7.05 - SMA 50 at $7.63 (dynamic support) - February 17 swing low at $6.88 - Fibonacci 38.2% at $8.28 (slightly above, acting as anchor)
Risk/Reward (stop at $6.00, below structural support): - Entry midpoint: $7.25 - Risk: $1.25 - To T1 ($11.97): R:R = 3.78:1 - To T2 ($15.75): R:R = 6.80:1
Zone 2: $5.80 - $6.20 (Secondary / Deep Value Zone)
Confluence factors: - Structural support cluster at $6.09 - 200 SMA at $5.91 (major dynamic support) - December 2025 consolidation base area - Fibonacci 23.6% at $5.58 (nearby)
Risk/Reward (stop at $5.00, below December low zone): - Entry midpoint: $6.00 - Risk: $1.00 - To T1 ($11.97): R:R = 5.97:1 - To T2 ($15.75): R:R = 9.75:1
Current Price Entry ($8.94)
Not a primary entry zone but viable for trend-following: - Risk (stop at $7.00): $1.94 - To T1 ($11.97): R:R = 1.56:1 - To T2 ($15.75): R:R = 3.51:1
9. Risk/Reward Framework
Scenario 1: Conservative (Pullback Entry)
| Parameter | Value |
|---|---|
| Entry Zone | $7.00 - $7.50 |
| Stop Loss | $6.00 (below 200 SMA and structural support) |
| Target 1 | $11.97 (Jan 2026 high) |
| Target 2 | $15.75 (Fib 78.6%) |
| Risk | $1.25 (from $7.25 midpoint) |
| R:R to T1 | 3.78:1 |
| R:R to T2 | 6.80:1 |
| Probability of reaching T1 | Moderate -- requires patience for pullback to materialize |
| Scenario thesis | Accumulation base resolves with a test of the breakout level |
Scenario 2: Aggressive (Trend Following at Current Levels)
| Parameter | Value |
|---|---|
| Entry | $8.50 - $9.00 (current range) |
| Stop Loss | $7.00 (below consolidation lows) |
| Target 1 | $11.97 (Jan 2026 high) |
| Target 2 | $19.71 (all-time high retest) |
| Risk | $1.75 (from $8.75 midpoint) |
| R:R to T1 | 1.84:1 |
| R:R to T2 | 6.26:1 |
| Probability of reaching T1 | Higher -- trend is intact, momentum is bullish |
| Scenario thesis | Strong trend continuation after fresh MACD crossover |
Scenario 3: Breakdown (Risk Scenario)
| Parameter | Value |
|---|---|
| Trigger | Close below $6.00 (200 SMA break) |
| Downside Target | $4.50-$5.00 (December 2025 lows) |
| Further Downside | $1.21 (52-week low, worst case) |
| Risk description | Post-parabolic stocks can revisit much lower levels if the base fails |
10. Key Levels Summary
| Level | Price | Type | Description |
|---|---|---|---|
| ATH / 52w High | $19.71 | Resistance | October 2025 all-time high |
| Fib 78.6% | $15.75 | Resistance | Major Fibonacci resistance |
| Fib 61.8% | $12.64 | Resistance | Fibonacci resistance |
| Jan 2026 High | $11.97 | Resistance | Most recent swing high -- key breakout level |
| Fib 50% | $10.46 | Resistance | Midpoint of 52-week range |
| BB Upper | $9.44 | Near-term Resistance | Upper Bollinger Band |
| Current Price | $8.94 | -- | -- |
| Fib 38.2% | $8.28 | Near-term Support | Current floor / Fibonacci support |
| SMA 20 | $8.07 | Dynamic Support | Short-term trend support |
| SMA 100 | $8.02 | Dynamic Support | Intermediate support |
| SMA 50 | $7.63 | Dynamic Support | Key trend support |
| Consolidation Low | $7.05 | Structural Support | Pivot low cluster (Feb 2026) |
| BB Lower | $6.70 | Support | Lower Bollinger Band |
| Structural Support | $6.09 | Structural Support | December 2025 support zone |
| 200 SMA | $5.91 | Major Dynamic Support | Primary trend support |
| Fib 23.6% | $5.58 | Deep Support | Fibonacci level |
| Dec 2025 Lows | $4.36-$5.16 | Structural Support | Deep base support zone |
11. Overall Technical Score
Weighted Composite Breakdown
| Component | Score | Weight | Contribution | Key Evidence |
|---|---|---|---|---|
| Trend Alignment | 10.0/10 | 25% | 2.50 | Price above all MAs; all MAs positively sloped; 50>200 SMA |
| Momentum | 7.5/10 | 20% | 1.50 | Fresh MACD bullish crossover; RSI neutral (room to run); stochastics overbought |
| Volume Confirmation | 7.5/10 | 20% | 1.50 | OBV rising; A/D line positive; up/down vol ratio 1.15; declining volume trend (-35%) is the deduction |
| Volatility Profile | 8.0/10 | 15% | 1.20 | BB squeeze forming; extreme positive skewness (+2.64) favoring upside; offset by 146% HV |
| Market Structure | 6.0/10 | 20% | 1.20 | Accumulation phase with range contraction; deducted for -55% from ATH and lower-lows in 30-day window |
| OVERALL | 7.9/10 | 100% | 7.90 |
Score Interpretation
A 7.9/10 reflects a stock with strong trend characteristics (perfect MA alignment, positive momentum crossovers) tempered by structural concerns (post-parabolic correction, extreme volatility). The score is borderline between "strong buy on pullback" and "hold/add to existing position." The Bullish bias is warranted by the trend evidence, but the extreme volatility demands reduced position sizing.
12. Relative Strength vs. SPY
| Metric | Value |
|---|---|
| 60-day Correlation with SPY | 0.233 |
| Beta (1-year) | 1.22 |
| Alpha (annualized) | +241.2% |
| RS Trend (20-day) | Improving |
UAMY has very low correlation to the broad market (0.233), meaning it trades largely on its own idiosyncratic drivers rather than beta to SPY. The 1.22 beta is moderate, but the massive alpha (+241% annualized) dominates return attribution. The improving relative strength trend suggests UAMY is currently outperforming the market on a short-term basis.
13. Limitations
-
Extreme volatility distorts standard indicators. With 146% annualized volatility, traditional overbought/oversold thresholds (RSI 70/30) may be less reliable. Momentum signals are noisier at this volatility level.
-
Post-parabolic structure. The stock experienced a ~50x move from $0.17 to $19.71 in roughly 18 months. Post-parabolic stocks frequently fail to recapture prior highs and can establish long-term lower ranges. The current "accumulation" reading may instead be a "distribution" phase that has not yet completed.
-
Short history of relevant price levels. The stock traded below $1.00 for most of 2018-2024. Current price levels ($7-$10) have very little trading history to establish reliable support/resistance. The key levels identified are from the last ~5 months only.
-
Volume normalization uncertainty. The declining volume trend could reflect normalization from the parabolic spike or could indicate waning interest. Without longer-term context at these price levels, it's difficult to distinguish.
-
Small-cap/micro-cap execution risk. Despite a healthy $104M daily dollar volume recently, this is a small-cap antimony stock subject to commodity price swings, geopolitical factors (antimony is a critical mineral with China-dominated supply), and potential liquidity gaps during market stress.
-
Fibonacci levels derived from extreme range. The 52-week range ($1.21 to $19.71) is a 16x span. Fibonacci retracements over such a wide range produce widely spaced levels that may not provide precision support/resistance.
-
Single timeframe analysis. This analysis uses daily data only. Intraday price action and weekly/monthly chart structures may present different signals.
-
No fundamental overlay. This is a purely technical analysis. UAMY (United States Antimony Corporation) is a commodity company whose price is heavily influenced by antimony supply/demand dynamics, trade policy, and China export restrictions. These fundamental catalysts are not captured in this technical assessment.
Analysis script: analysis/quant-research/scripts/UAMY-technical-2026-03-01.py
Charts: analysis/quant-research/charts/uamy_*.png
Data: data-samples/ohlcv/UAMY.csv (2018-01-02 to 2026-02-27, 2050 trading days)
Charts