Volatility Regime
Volatility Regime Classification
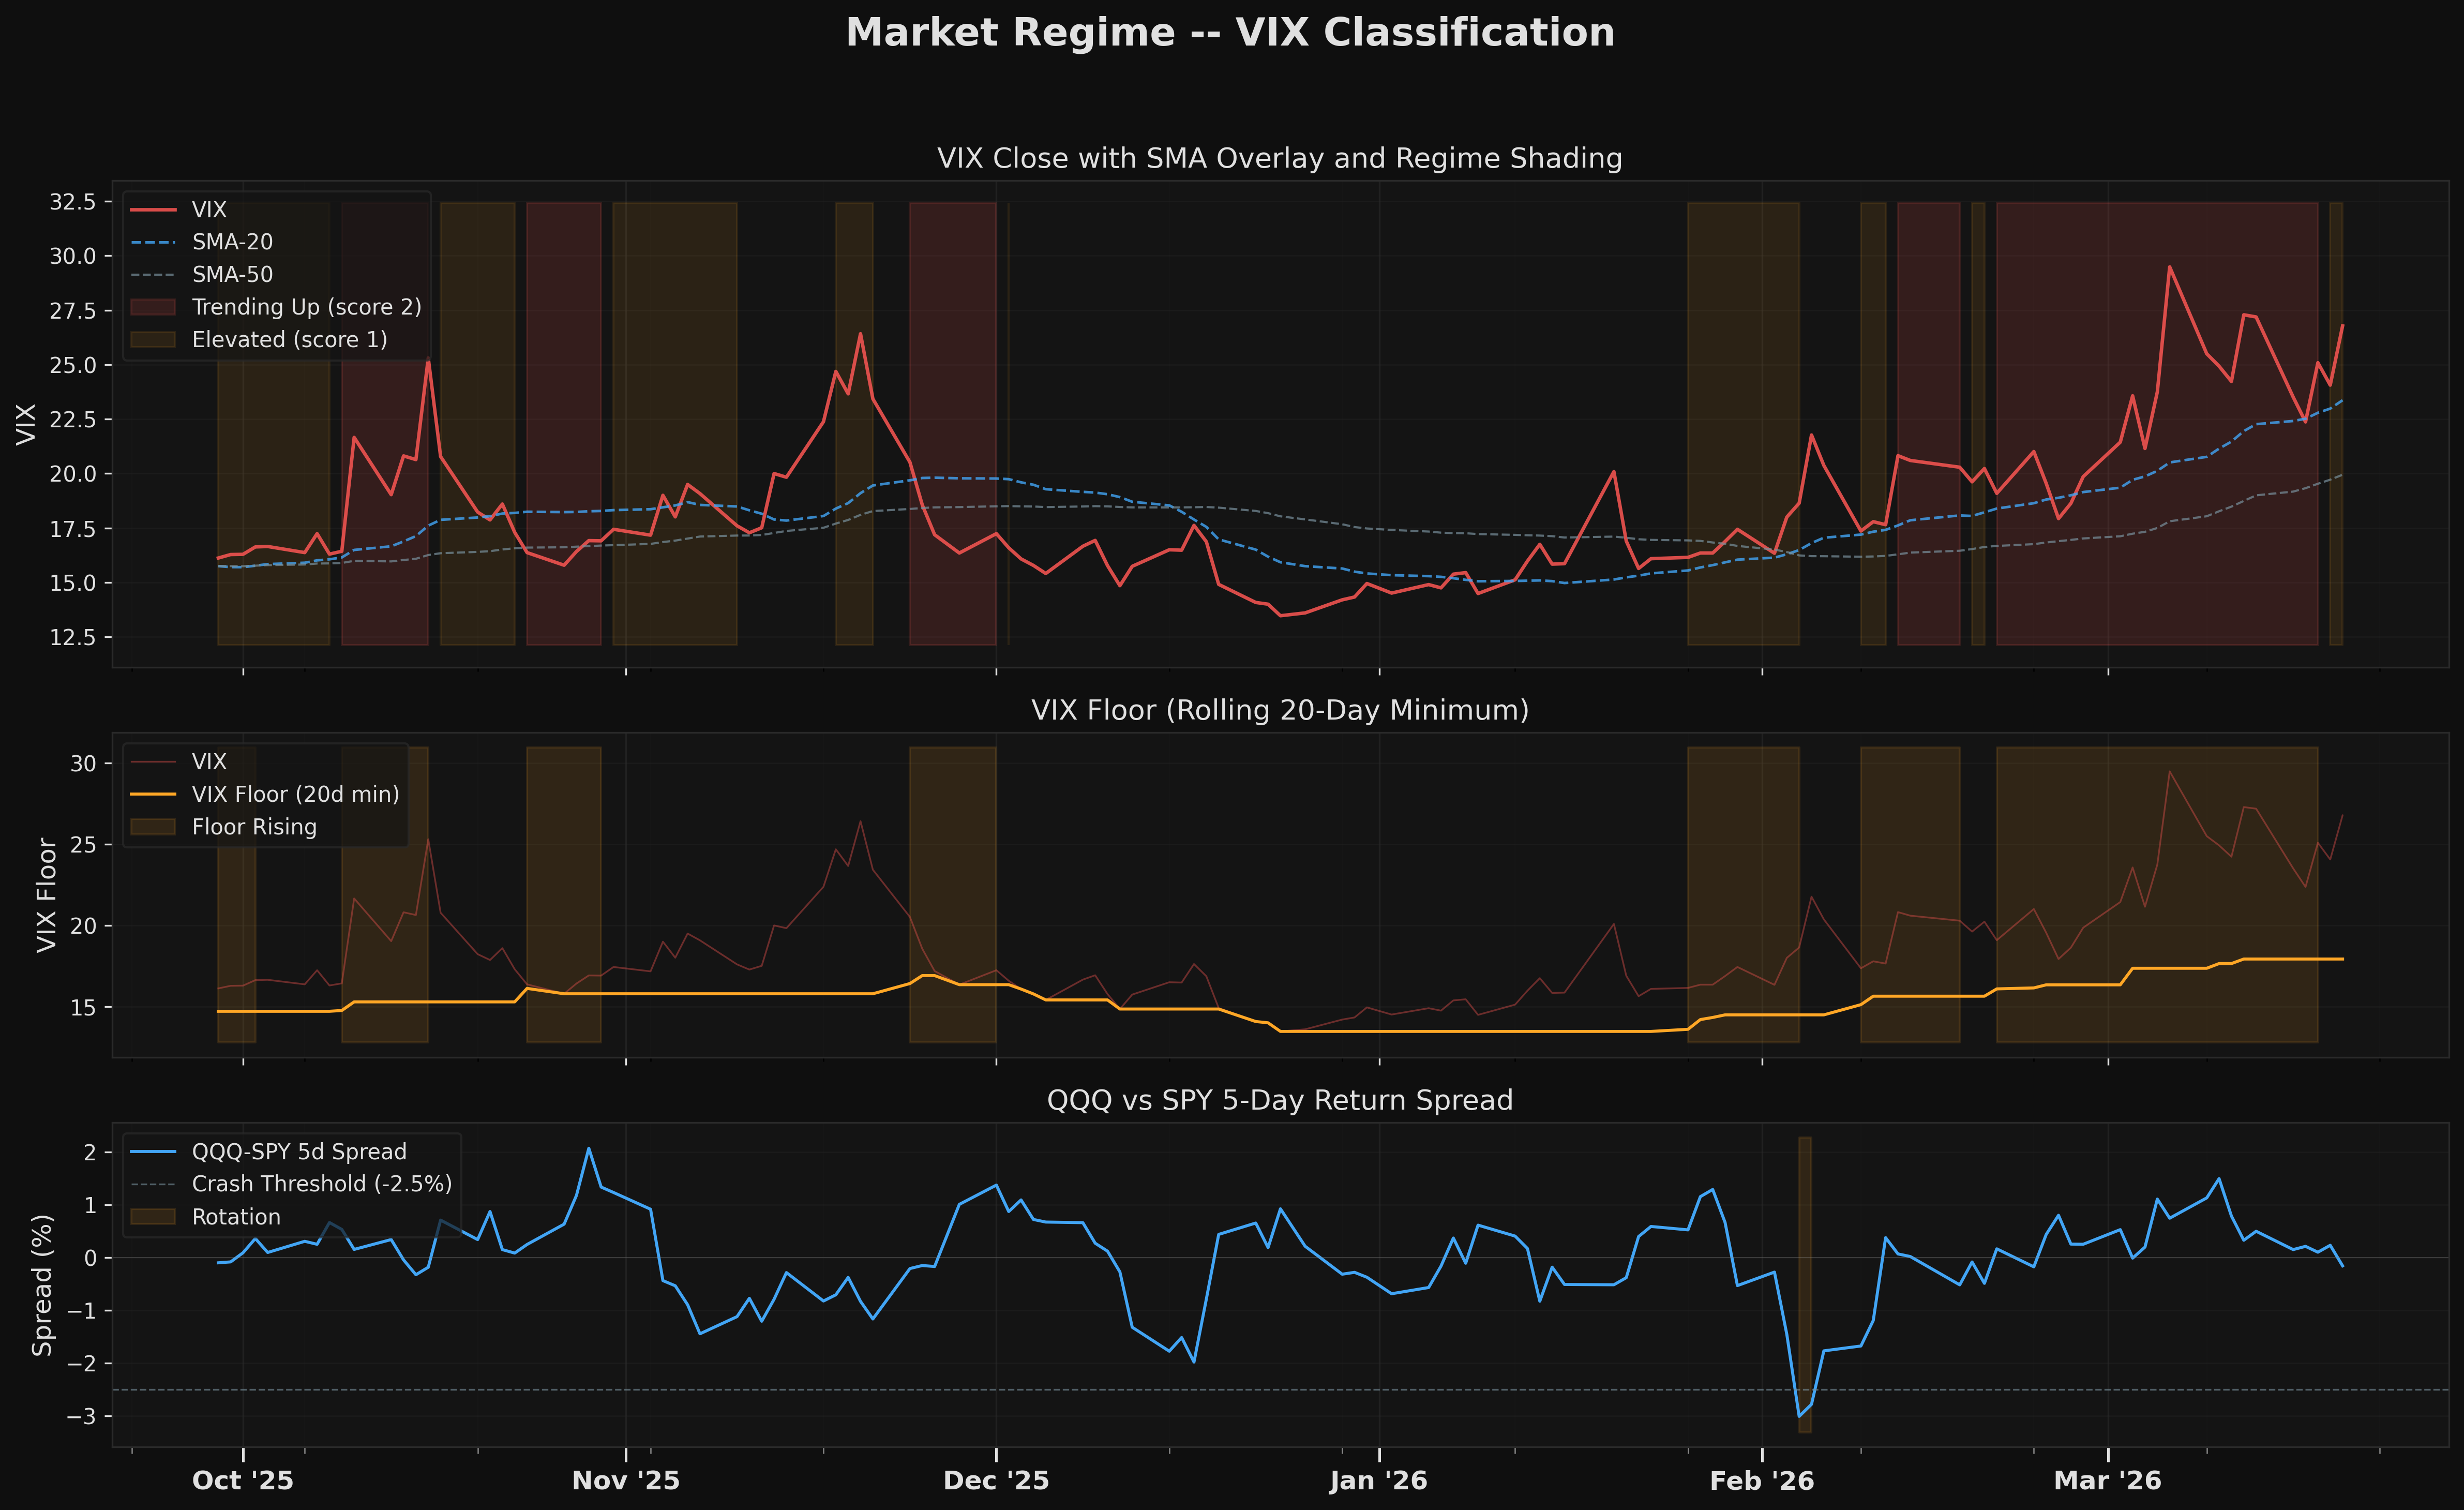
trend: unknown / level: unknown
0 days trending
| Metric | Value |
|---|---|
| VIX Close | 31.0 |
| SMA-20 | 25.4 |
| SMA-50 | 21.1 |
| SMA-20 > SMA-50 | Yes |
| Floor Rising | Yes |
| Trending Duration | 0 days |
Neither condition met. VIX SMA-20 (25.4) is below SMA-50 (21.1), and the volatility floor is not rising. This is the low-risk regime — historically, periods like H1 2019 (90%+ days calm) produced +17.7% returns. Standard position sizing applies.
Momentum Crash Status
No momentum crash active
| Metric | Value |
|---|---|
| QQQ-SPY 5d Spread | -0.99% |
| HYG Drawdown (20d) | -2.09% |
| Crash Threshold | -2.5% |
| Crash Active | No |
Historical Context
The table below shows prior volatility regime episodes for reference. In calm regimes like the current one, sustained calm has historically been the backdrop for strong equity returns (e.g. H1 2019: +17.7%).
| Episode | Period | Vol Regime | Crash Type | SPY Outcome |
|---|---|---|---|---|
| COVID Crash | Feb-Apr 2020 | rising / elevated (30+ days) | liquidation | -33.9% peak drawdown |
| Growth Rotation | Mar 2021 | falling / calm | rotation | +3.6% 30d forward |
| Rate Shock | Apr 2022 | rising / elevated | liquidation | -10.7% 30d forward |
| Oct 2022 Stress | Sep-Oct 2022 | rising / elevated | none | -8.3% then reversal |
| 2019 Calm | H1 2019 | falling / calm (90%+) | none | +17.7% H1 |
Charts