Volatility Regime
**Market Regime Analysis**
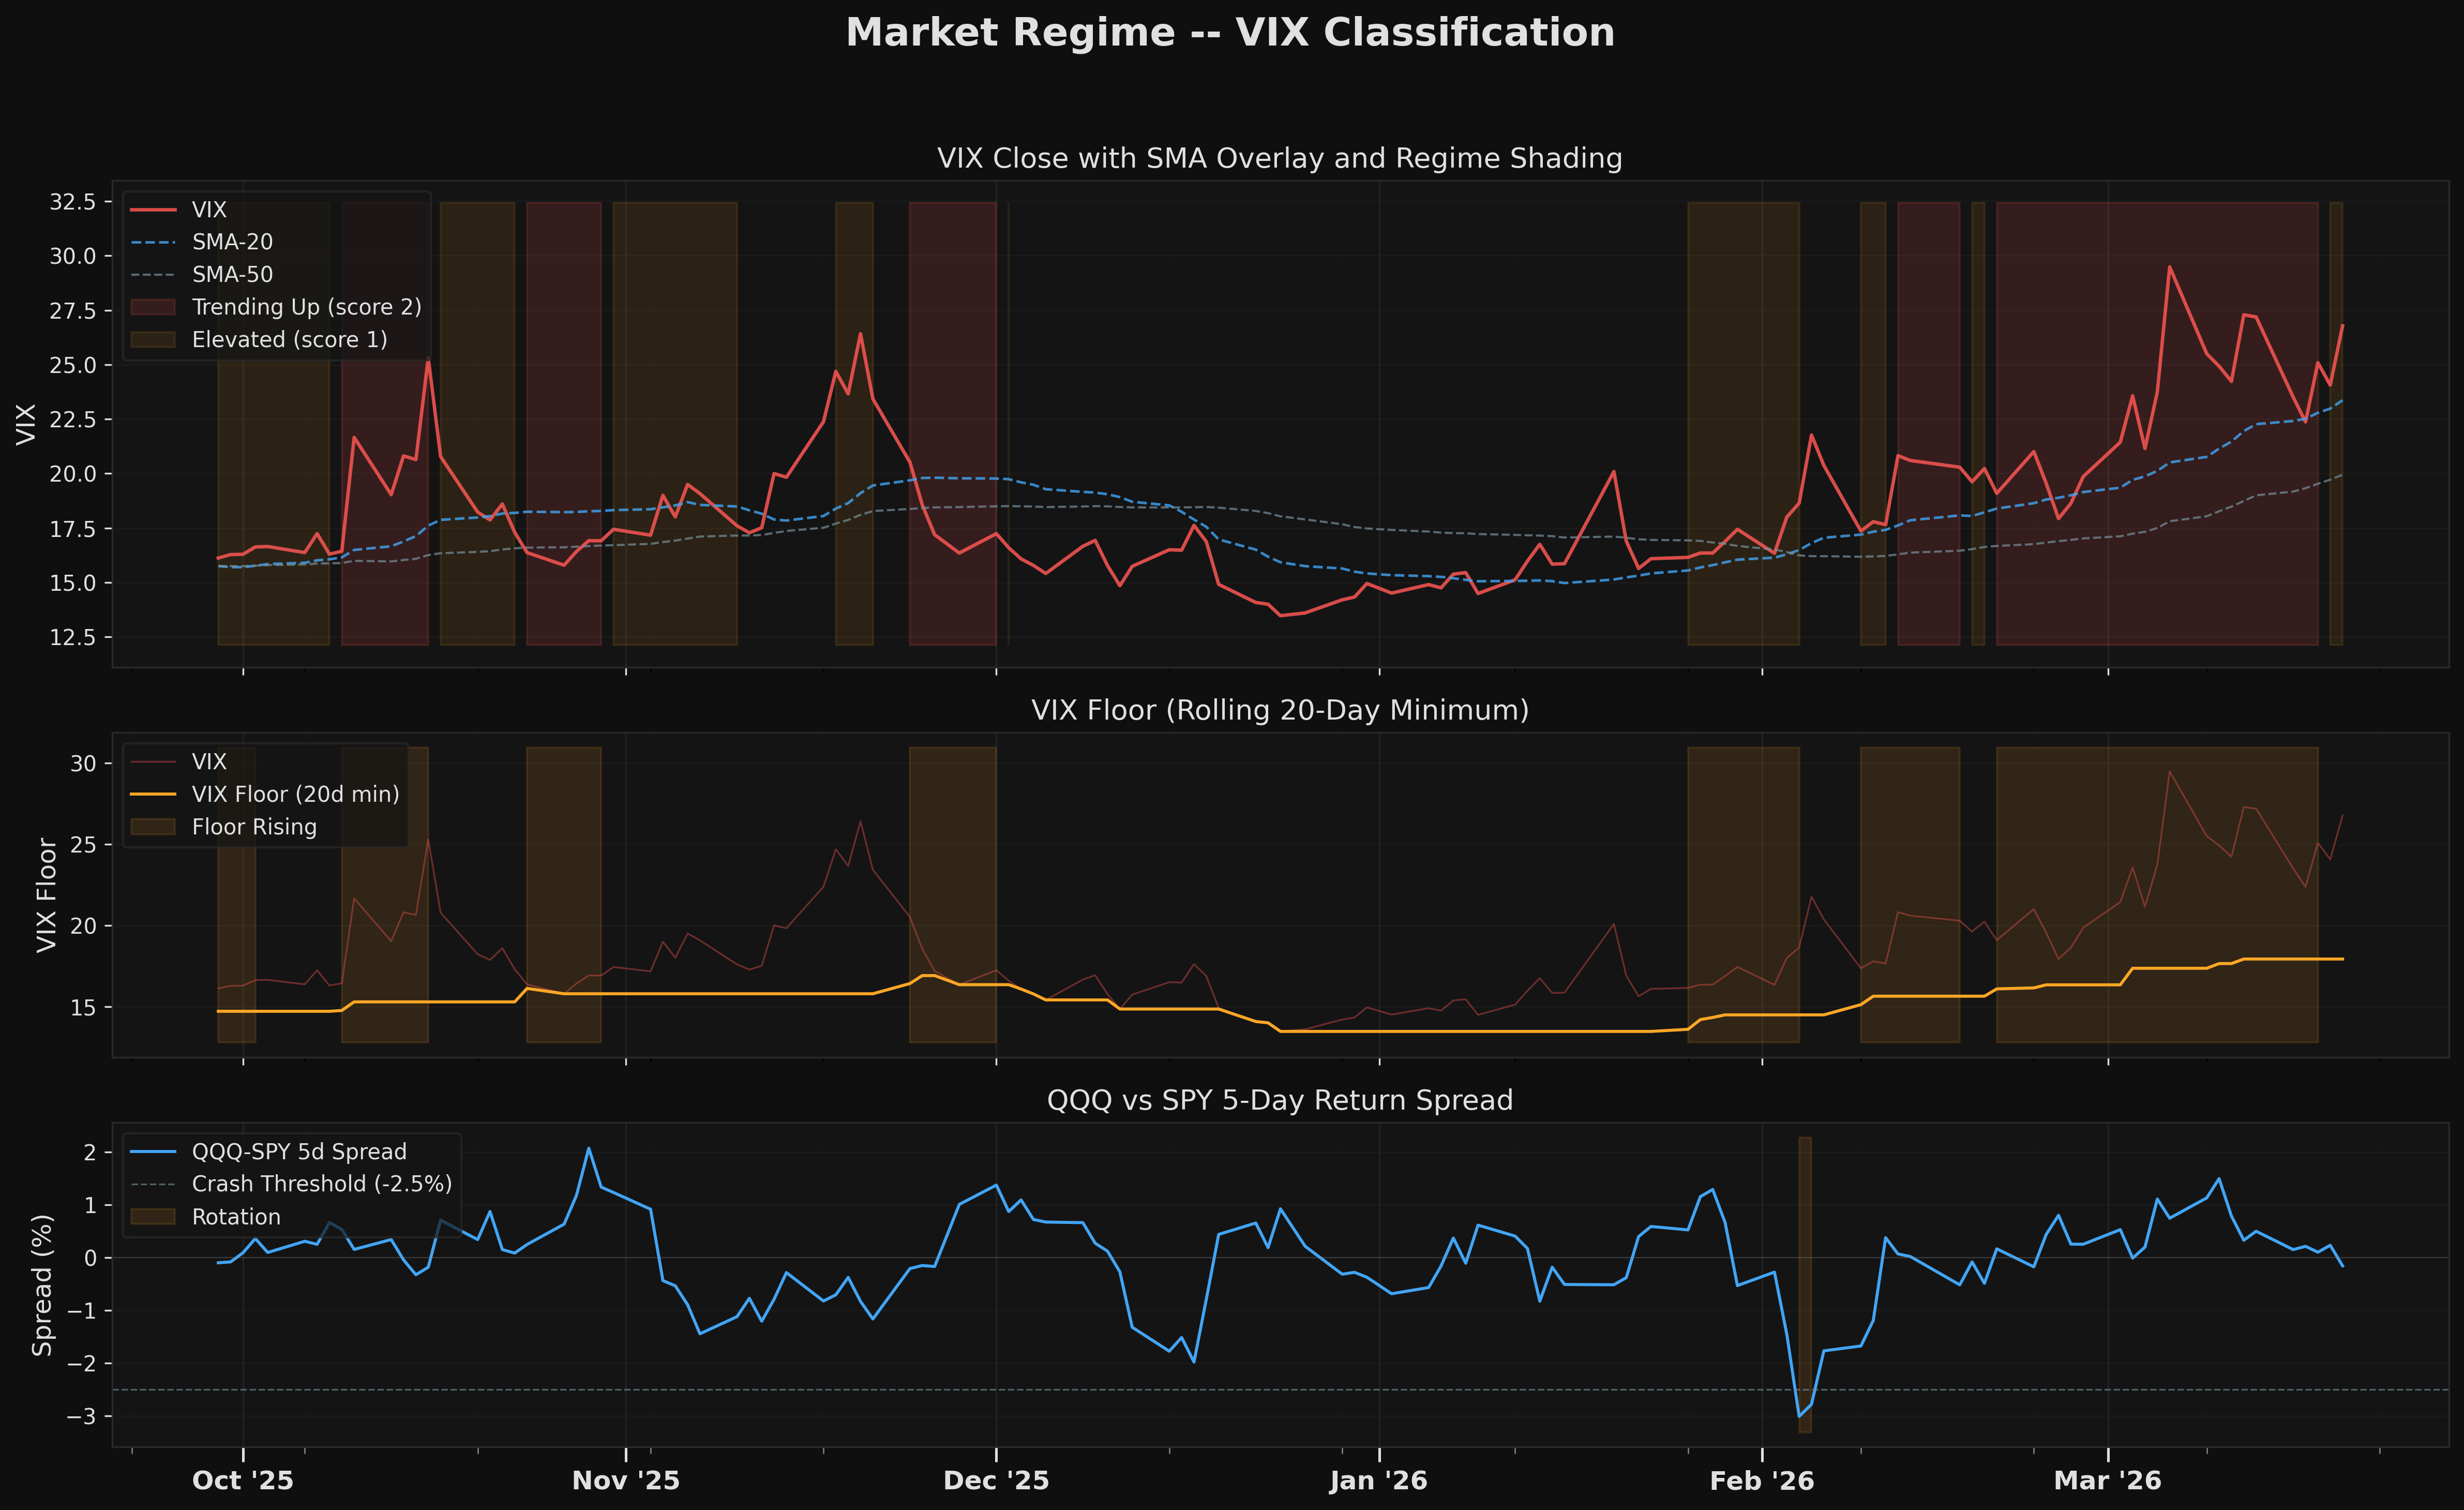
The market has been locked in an elevated VIX regime for 26 consecutive days, with VIX at 26.8 sitting 3.4 points above its SMA20 of 23.4 and 6.9 points above its SMA50 of 19.9 — a configuration where spot VIX is stretched above both moving averages, indicating stress has been sustained rather than spike-and-fade. The VIX floor is not rising, which means the regime is holding at current levels rather than structurally escalating, but the absence of mean reversion back toward SMA20 or SMA50 suggests no meaningful relief has emerged across the 26-day window. The QQQ-SPY 5-day spread of -0.16 indicates marginal large-cap tech underperformance relative to the broader S&P 500, pointing to a defensive or rotation-driven tape rather than growth-led leadership. This soft negative spread is consistent with elevated VIX environments where risk appetite compresses and high-beta tech exposure gets trimmed. The multi-signal picture reinforces caution: immune system turbulence sits at the 91st percentile with a HIGH warning, and credit stress composite registers 78.1 with a matching HIGH warning, meaning the VIX regime is not an isolated reading but is corroborated by cross-asset deterioration. With the regime stable but not improving, and no momentum crash active, positioning should reflect a defensive tilt rather than a mean-reversion bet on normalization.
Volatility Regime Classification
| Metric | Value |
|---|---|
| VIX Close | 26.8 |
| SMA-20 | 23.4 |
| SMA-50 | 19.9 |
| SMA-20 > SMA-50 | Yes |
| Floor Rising | No |
| Trending Duration | 0 days |
Neither condition met. VIX SMA-20 (23.4) is below SMA-50 (19.9), and the volatility floor is not rising. This is the low-risk regime — historically, periods like H1 2019 (90%+ days calm) produced +17.7% returns. Standard position sizing applies.
Momentum Crash Status
No momentum crash active
| Metric | Value |
|---|---|
| QQQ-SPY 5d Spread | -0.16% |
| HYG Drawdown (20d) | -1.99% |
| Crash Threshold | -2.5% |
| Crash Active | No |
Historical Context
The table below shows prior volatility regime episodes for reference. In calm regimes like the current one, sustained calm has historically been the backdrop for strong equity returns (e.g. H1 2019: +17.7%).
| Episode | Period | Vol Regime | Crash Type | SPY Outcome |
|---|---|---|---|---|
| COVID Crash | Feb-Apr 2020 | rising / elevated (30+ days) | liquidation | -33.9% peak drawdown |
| Growth Rotation | Mar 2021 | falling / calm | rotation | +3.6% 30d forward |
| Rate Shock | Apr 2022 | rising / elevated | liquidation | -10.7% 30d forward |
| Oct 2022 Stress | Sep-Oct 2022 | rising / elevated | none | -8.3% then reversal |
| 2019 Calm | H1 2019 | falling / calm (90%+) | none | +17.7% H1 |
Charts