TSM — Technical Summary
Conviction 4TSM (Taiwan Semiconductor) -- Comprehensive Technical Analysis
Date: 2026-02-27 Asset Class: Equity (Large-Cap Semiconductor) Data: 2,050 trading days (2018-01-02 to 2026-02-27) Analysis Script:
analysis/quant-research/scripts/tsm-technical-2026-02-27.py
===========================================================
  TSM -- Technical Analysis                   2026-02-27
  Asset Class: Equity
  Price: $374.58  |  52wk: $132.98 - $390.21
===========================================================

  OVERALL SCORE: 7.8/10      BIAS: Bullish

  COMPONENT SCORES
  -----------------------------------------------------------
  Trend Alignment         9.0/10  wt 25%  Above all MAs, bullish alignment
  Momentum                7.0/10  wt 20%  RSI 62 bullish, MACD above signal
  Volume Confirmation     7.0/10  wt 20%  A/D rising, up/down ratio 1.21
  Volatility Profile      6.2/10  wt 15%  ATR 3.5% elevated, BB%B 0.70
  Market Structure        9.0/10  wt 20%  Higher highs/lows, R2=0.94

  KEY LEVELS
  -----------------------------------------------------------
  Resistance 2:  $425.00   Round number target above ATH
  Resistance 1:  $390.21   52-week high (Feb 25, 2026)
  Current Price: $374.58
  Support 1:     $350.00   Round number / pullback zone
  Support 2:     $333.94   50-day SMA

  RED FLAGS                                    (2 found)
  -----------------------------------------------------------
  MEDIUM  OBV declining while price holding     [Volume]
  MEDIUM  Price 37% above 200 SMA -- extended   [Trend]

===========================================================
Table of Contents
- Executive Summary
- Price Structure
- Market Structure (Wyckoff)
- Momentum Analysis
- Moving Average Analysis
- Volume Analysis
- Volatility Profile
- Entry Point Assessment
- Risk/Reward Framework
- Key Levels Summary
- Overall Technical Score
- Relative Strength vs SPY
- Limitations
Executive Summary
Taiwan Semiconductor (TSM) is in a powerful secular uptrend, trading at $374.58 -- just 4.0% below its all-time/52-week high of $390.21 set two days ago on February 25, 2026. The stock has gained +95.1% over the trailing year, +54.8% over 120 days, and +30.6% over 60 days, with a remarkably clean trend channel (60-day linear regression R-squared of 0.94).
The technical picture is unambiguously bullish on all timeframes. Price trades above all major moving averages (10/20/50/100/200 SMA and 9/21/50 EMA), with all MAs in perfect bullish alignment (50 > 100 > 200) and all slopes rising. The golden cross (SMA50 above SMA200) has been in effect, and momentum indicators (RSI 62, MACD above signal, Stochastic %K at 77) confirm the uptrend without being overbought.
The primary concern is valuation of the entry, not the trend. At 93.9% of its 52-week range, the stock is extended from its moving averages (37.5% above the 200 SMA) and current-price entries offer unfavorable risk/reward. The best opportunities come on pullbacks to the $340-350 zone (near SMA50) where the risk/reward improves dramatically. A secondary concern is a mild OBV divergence -- OBV has declined over the past 20 days while price has held, hinting at possible distribution. However, the A/D line remains in an uptrend, and volume on up days exceeds down days by a 1.21:1 ratio, which partially offsets this concern.
Overall Technical Score: 7.8/10 -- Bullish. The trend is strong, structure is clean, and momentum is healthy. The score reflects minor deductions for elevated volatility (ATR 3.5%) and the OBV divergence. This is a "wait for a dip to buy" setup, not a "chase at the highs" one.
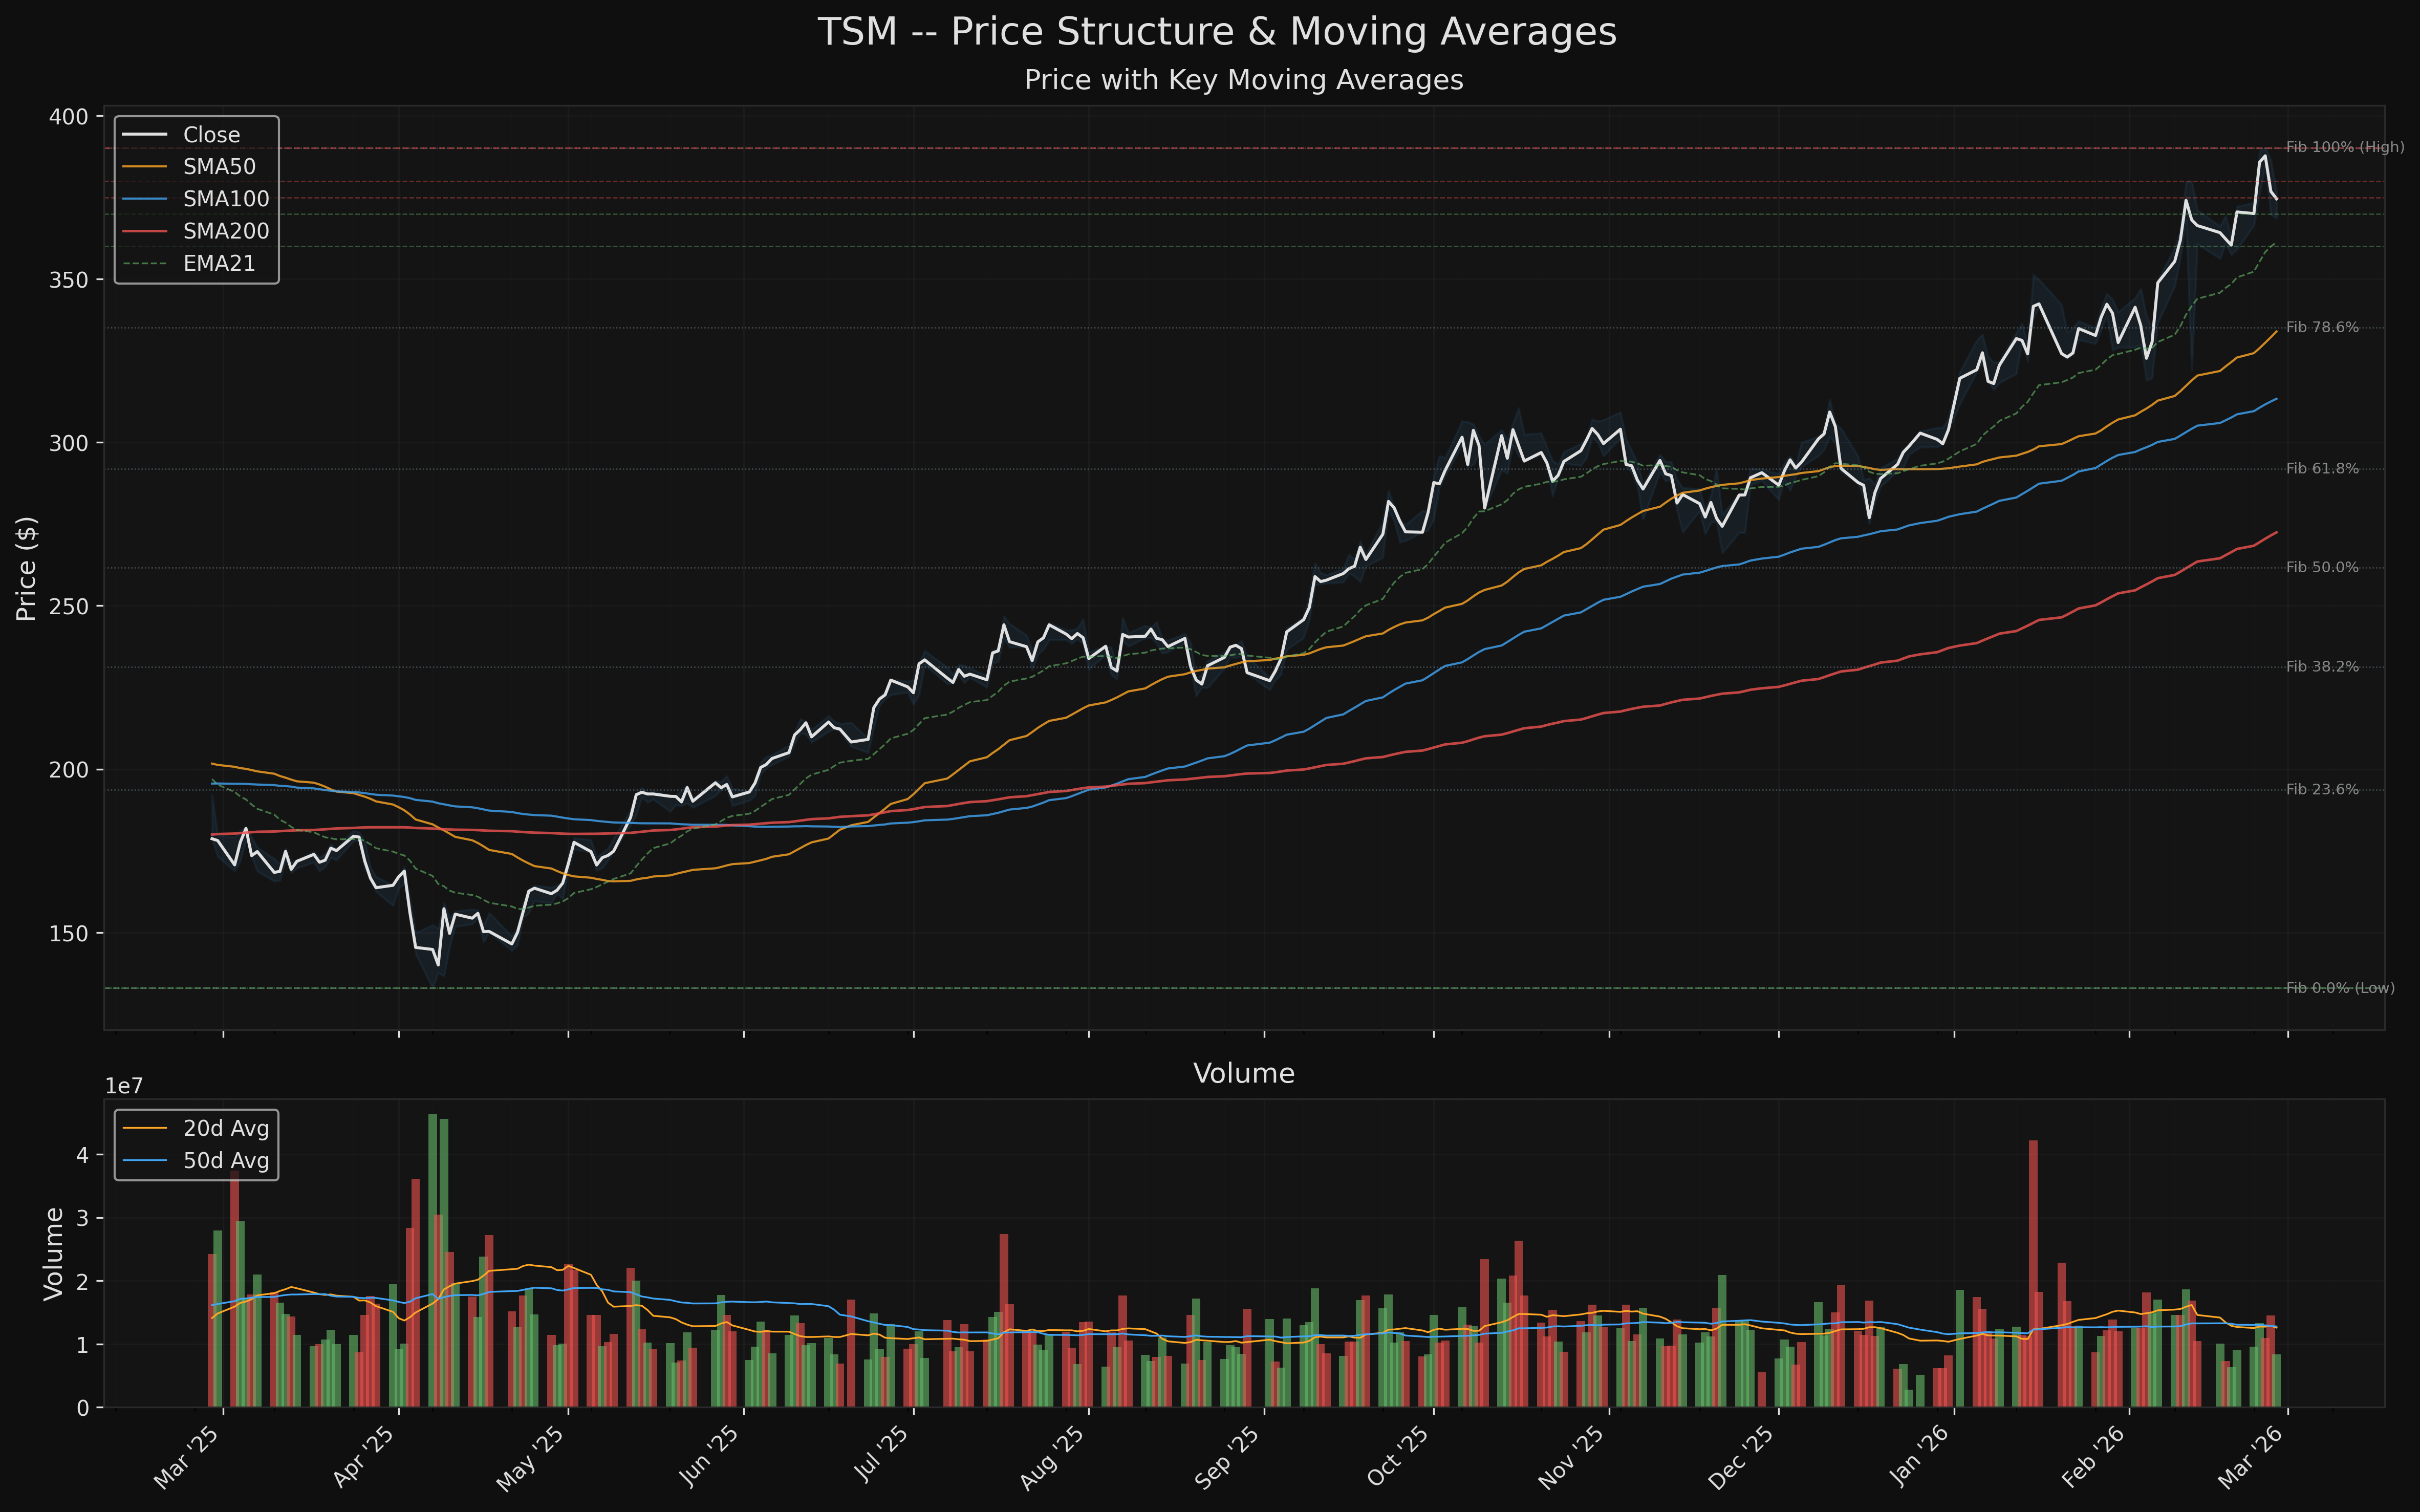
1. Price Structure
Chart: charts/tsm_price_structure.png
Current State
| Metric | Value |
|---|---|
| Current Price | $374.58 |
| Previous Close | $376.81 |
| Daily Change | -$2.23 (-0.59%) |
| 52-Week High | $390.21 (Feb 25, 2026) |
| 52-Week Low | $132.98 (Apr 7, 2025) |
| % from 52w High | -4.0% |
| % from 52w Low | +181.7% |
| Position in 52w Range | 93.9% |
Price History Summary
The 8-year price history reveals a stock that has transformed from a $33 name in early 2018 to a $375 name today -- an approximately 11x return. The most recent year has been particularly powerful:
-
April 2025 bottom ($132.98): TSM made its 52-week low during a broad market correction. This was a higher low relative to prior cycle bottoms, establishing the floor for the current advance.
-
Markup phase (Apr 2025 -- Feb 2026): A relentless 10-month advance from $133 to $390, nearly tripling the stock. The advance has been remarkably orderly, with a 120-day linear regression R-squared of 0.87, suggesting a trend-following regime rather than choppy oscillation.
-
Near-ATH consolidation (current): After printing $390.21 on Feb 25, the stock has pulled back slightly to $374.58. This is a normal 2-3 day pause, not yet a meaningful pullback.
Recent Performance
| Period | Return |
|---|---|
| 5-day | +1.1% |
| 10-day | +1.8% |
| 20-day | +10.3% |
| 60-day | +30.6% |
| 90-day | +27.3% |
| 120-day | +54.8% |
| 1-year | +95.1% |
Fibonacci Retracements (52wk Low $132.98 to High $390.21)
| Level | Price | % from Current |
|---|---|---|
| 0.0% (Low) | $132.98 | -64.5% |
| 23.6% | $193.69 | -48.3% |
| 38.2% | $231.24 | -38.3% |
| 50.0% | $261.60 | -30.2% |
| 61.8% | $291.95 | -22.1% |
| 78.6% | $335.16 | -10.5% |
| 100% (High) | $390.21 | +4.2% |
TSM trades well above the 78.6% Fibonacci level, consistent with a strong uptrend. The 78.6% level at $335.16 aligns closely with the SMA50 at $333.94, creating a significant support confluence zone. In a healthy uptrend, corrections typically hold at or above this zone.
2. Market Structure (Wyckoff)
Phase Identification: Late Markup / Approaching Potential Distribution
Based on quantitative evidence, TSM is in late-stage markup with early signs that may eventually lead to distribution. However, the weight of evidence currently favors the markup thesis continuing.
Evidence for Markup (primary thesis):
| Criterion | Evidence |
|---|---|
| Higher Highs | Yes -- last two swing highs: $380.00 -> $390.21 (higher high) |
| Higher Lows | Yes -- last two swing lows: $275.08 -> $319.07 (higher low) |
| Price Slope | +$1.59/day over 60 days (R-squared = 0.94, extremely trend-consistent) |
| MA Alignment | Perfect bullish stack: SMA50 ($333.94) > SMA100 ($313.36) > SMA200 ($272.47) |
| All MA Slopes Rising | SMA50 +9.1%, SMA100 +6.1%, SMA200 +7.7% (20-day rate of change) |
Early Distribution Warning Signs (secondary concern):
| Criterion | Evidence |
|---|---|
| OBV Divergence | OBV has declined over 20 days while price has held/risen |
| 120-day Volume Slope | Slightly negative (-5,701 shares/day), though NOT statistically significant (p=0.66) |
| Distance from 200 SMA | 37.5% -- extended, potential mean-reversion risk |
Assessment: The markup evidence is strong and the distribution hints are weak. The 120-day volume decline is not statistically significant (p=0.66), and the 60-day volume slope is actually positive (+23,203/day, p=0.58). The OBV divergence over 20 days is a caution flag worth monitoring, but the A/D line remains in an uptrend, suggesting the money flow is still net positive.
Wyckoff Phase Conclusion: Markup phase remains intact. The stock needs to fail at key levels and show expanding volume on declines before a distribution call is warranted.
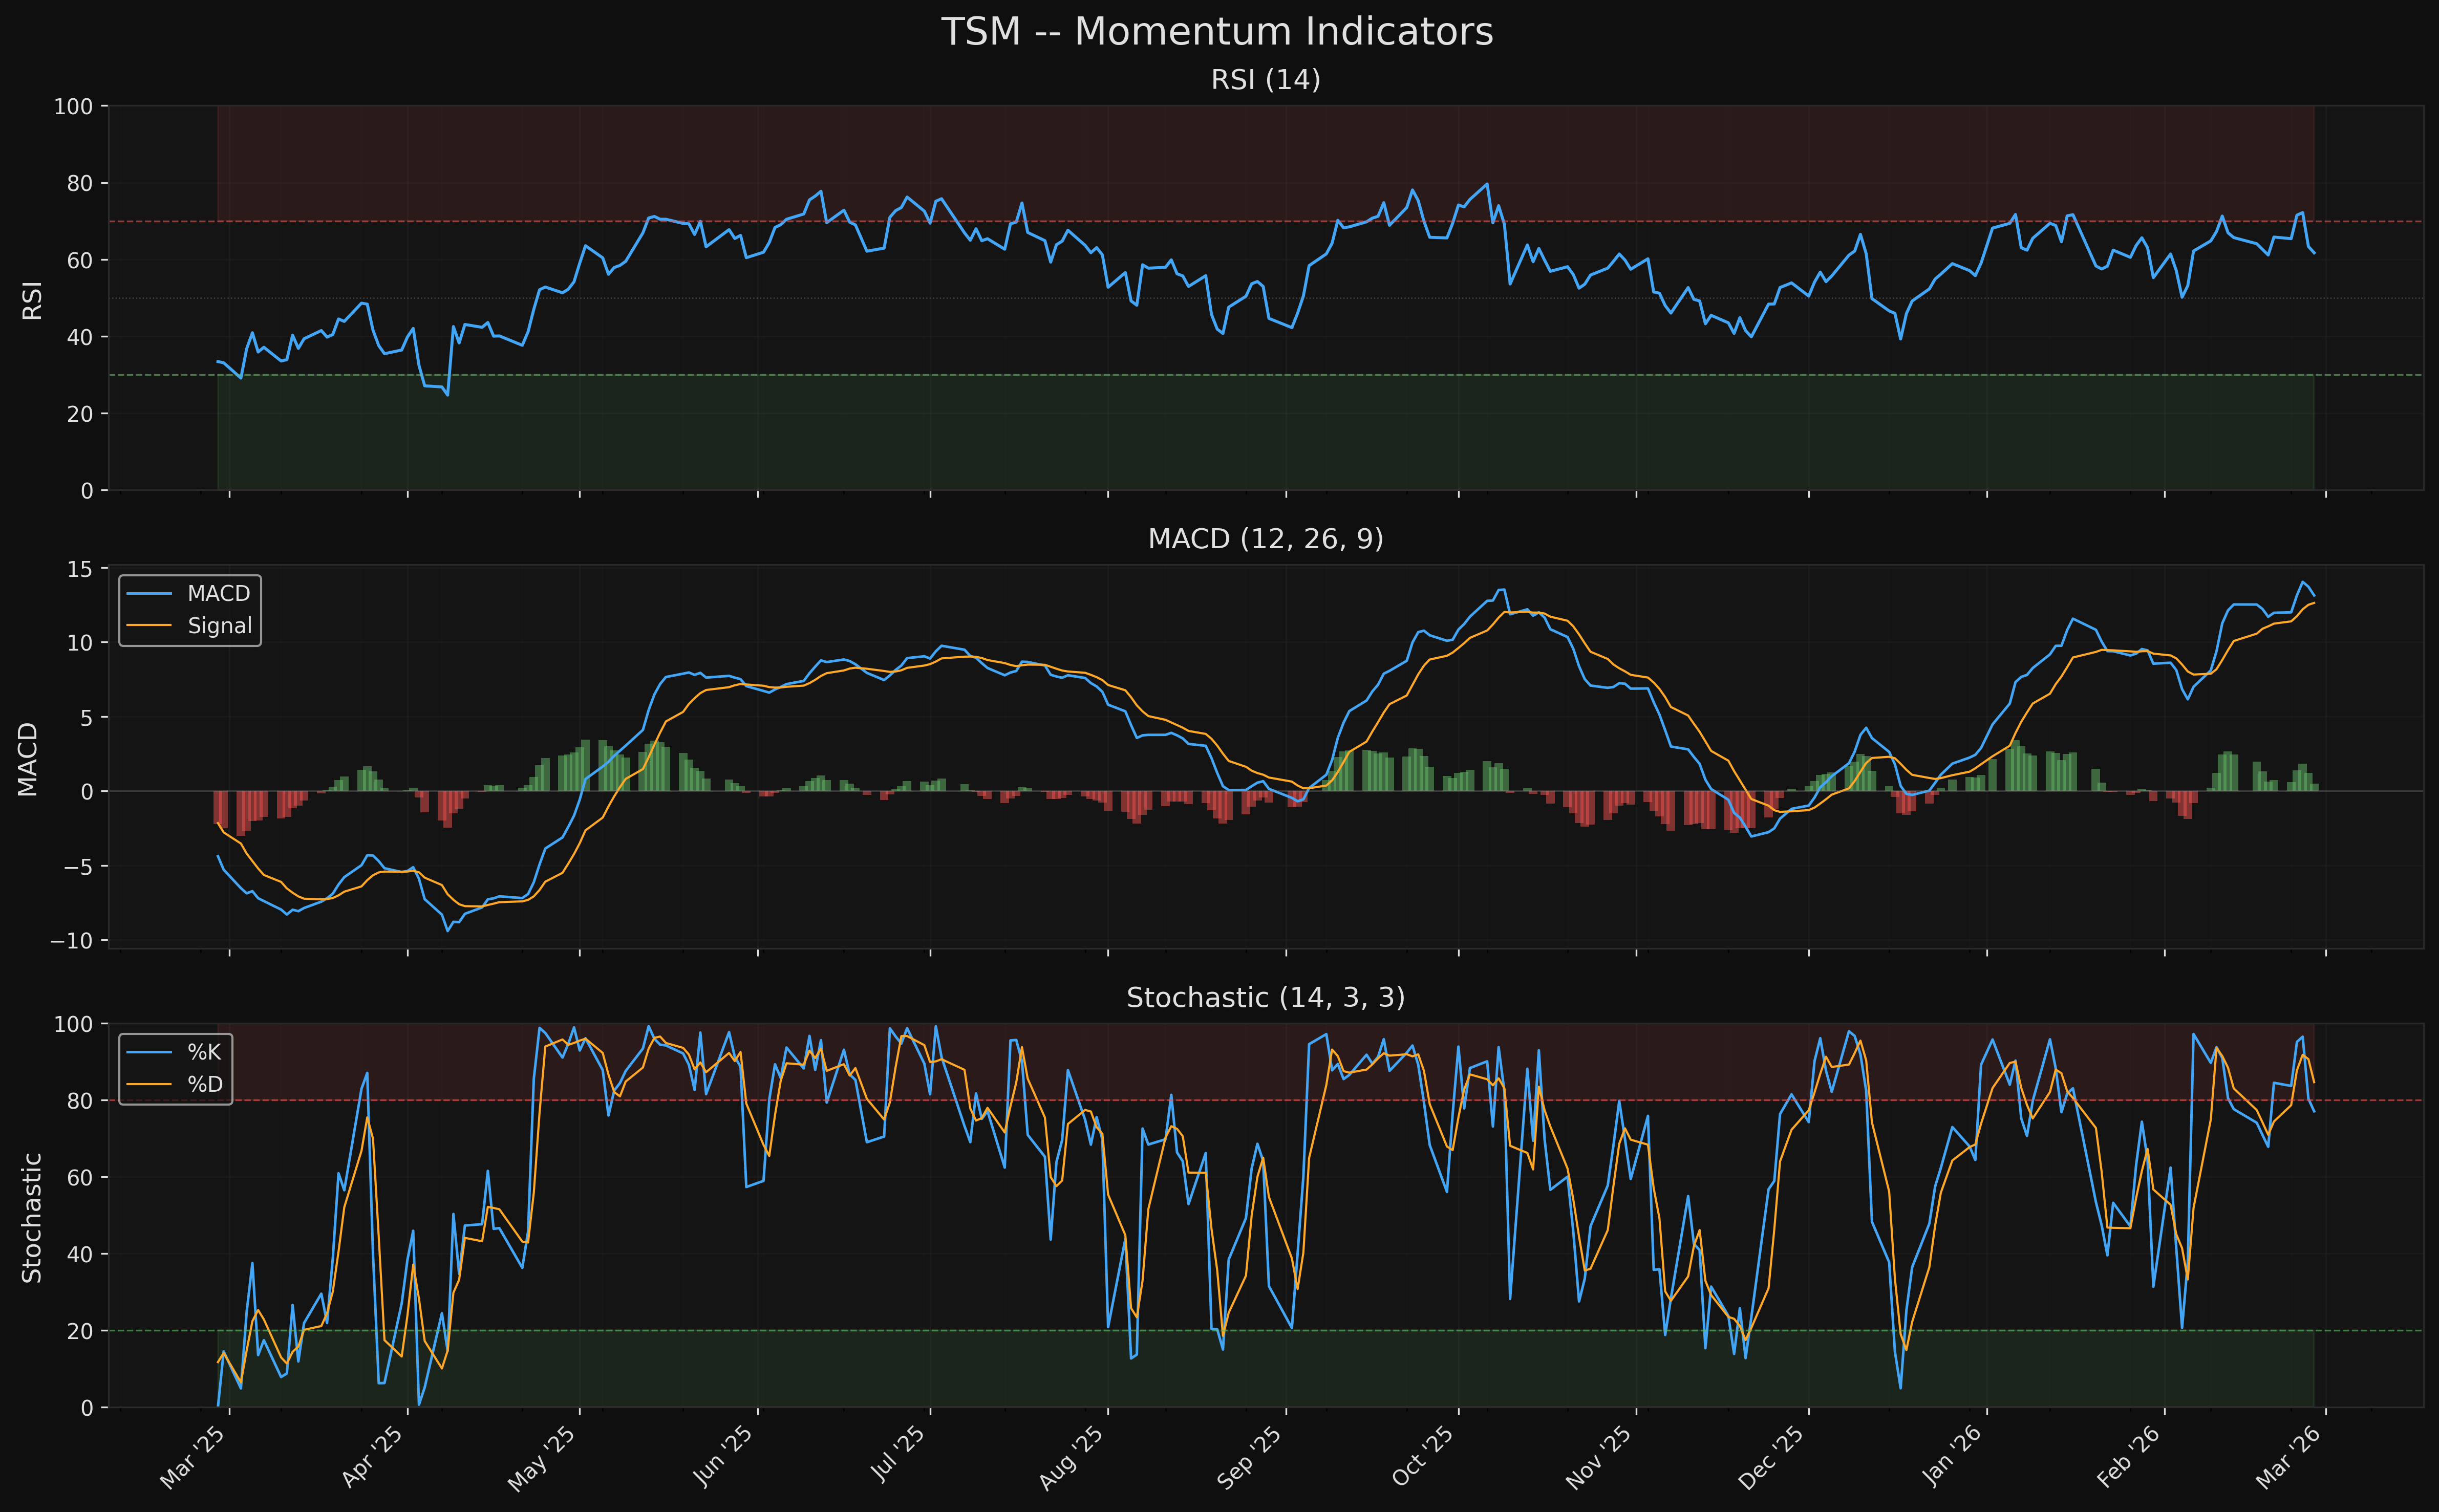
3. Momentum Analysis
Chart: charts/tsm_momentum.png
RSI (14-Period)
| Metric | Value |
|---|---|
| Current RSI | 61.7 |
| Zone | Bullish (60-70) |
| 20-bar Divergence | None detected |
The RSI at 61.7 is in the bullish zone without being overbought. In strong uptrends, RSI tends to oscillate between 40 and 80, with 40-50 acting as the support zone during pullbacks. The current reading suggests the stock has room to run before reaching overbought territory (70+). No bearish divergence is detected over the last 20 bars, which is constructive.
MACD (12, 26, 9)
| Metric | Value |
|---|---|
| MACD Line | 13.135 |
| Signal Line | 12.633 |
| Histogram | +0.502 |
| Trend | Bullish (MACD > Signal) |
| Histogram Trend | Contracting |
The MACD is well above its signal line and well above zero, confirming the uptrend. The histogram is positive but contracting, indicating that the rate of price acceleration is slowing -- the stock is still advancing, just at a decelerating pace. This is normal behavior as an advance matures and does not, by itself, signal a reversal.
Stochastic Oscillator (14, 3, 3)
| Metric | Value |
|---|---|
| %K | 77.1 |
| %D | 84.6 |
| Zone | Neutral (approaching overbought) |
The Stochastic %K at 77.1 is approaching the overbought zone (80+) but has not yet entered it. The %D line at 84.6 is already in overbought territory but declining, and %K is below %D, which is a minor bearish crossover signal in the short term. This suggests the immediate short-term momentum may be fading, consistent with the small pullback from $390 to $375.
Momentum Summary
Momentum is healthy but not euphoric. The RSI confirms bullish trend without overbought stress, the MACD confirms the uptrend with a decelerating (but still positive) histogram, and the Stochastic suggests near-term consolidation is possible. The absence of bearish divergence on RSI is a positive signal.
4. Moving Average Analysis
SMA/EMA Positioning
| Moving Average | Value | Price Relative | Distance |
|---|---|---|---|
| EMA9 | $373.08 | ABOVE | +0.4% |
| SMA10 | $371.87 | ABOVE | +0.7% |
| SMA20 | $359.56 | ABOVE | +4.2% |
| EMA21 | $361.28 | ABOVE | +3.7% |
| SMA50 | $333.94 | ABOVE | +12.2% |
| EMA50 | $340.08 | ABOVE | +10.1% |
| SMA100 | $313.36 | ABOVE | +19.5% |
| SMA200 | $272.47 | ABOVE | +37.5% |
Price is above every single moving average, from the fastest (EMA9) to the slowest (SMA200). This is the textbook definition of an uptrend across all timeframes.
MA Alignment
The MAs are in perfect bullish alignment: EMA9 > SMA10 > SMA20 > EMA21 > SMA50 > EMA50 > SMA100 > SMA200. In this configuration, pullbacks to any moving average represent potential buying opportunities, with the significance of the support increasing as you move to longer-period averages.
MA Slopes (20-Day Rate of Change)
| MA | 20d Slope | Direction |
|---|---|---|
| SMA50 | +9.12% | Rising |
| SMA100 | +6.12% | Rising |
| SMA200 | +7.73% | Rising |
All three major MAs are rising, confirming the uptrend is accelerating, not decelerating. The SMA50 rising at +9.1% over 20 days is particularly notable, as it means the trend is steepening.
Golden/Death Cross Status
Active: Golden Cross -- SMA50 ($333.94) is well above SMA200 ($272.47), a spread of $61.57 (22.6%). This wide spread indicates the uptrend has significant momentum. No death cross has occurred in the recent past.
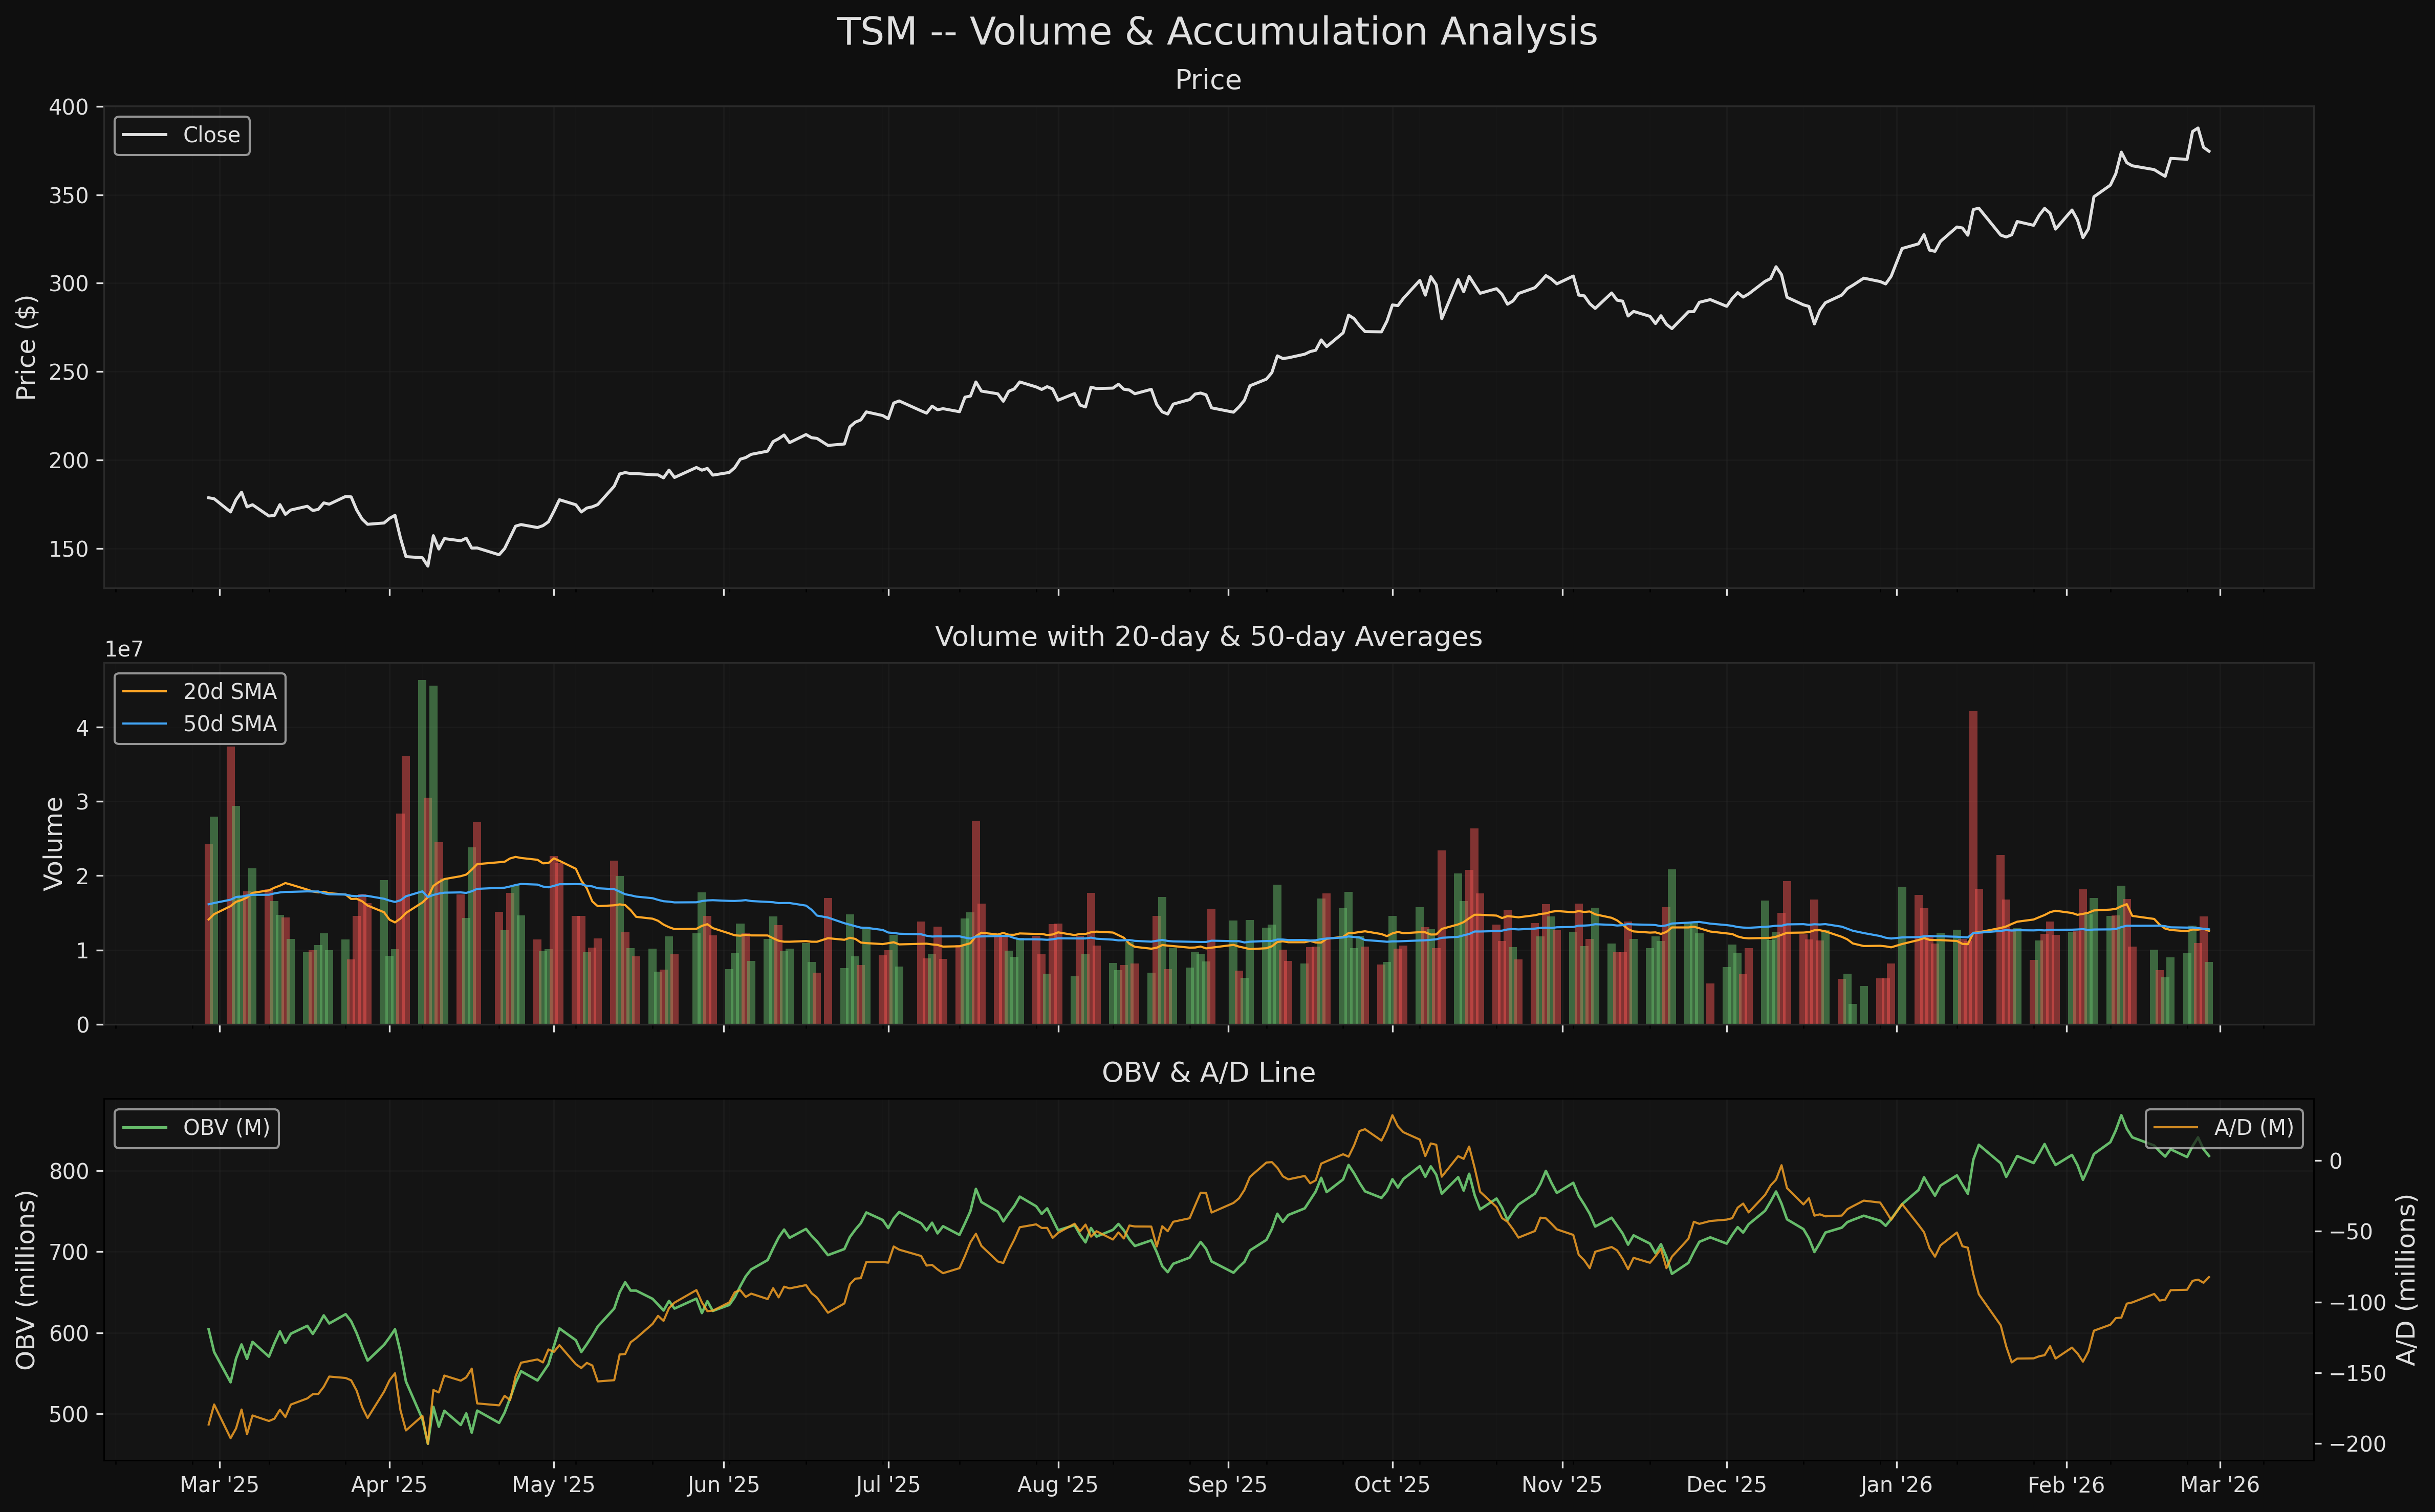
5. Volume Analysis
Chart: charts/tsm_volume_accumulation.png
Volume Statistics
| Metric | Value |
|---|---|
| Latest Volume | 8,377,253 |
| 20-Day Average | 12,581,183 |
| 50-Day Average | 12,775,339 |
| Vol/20d Average | 0.67x |
The most recent session's volume (8.38M) is below the 20-day average (12.58M), which is typical for a consolidation day after a strong advance. The key question is whether volume was higher on the recent push toward the $390 high.
Up/Down Volume Ratio (Last 20 Sessions)
| Metric | Value |
|---|---|
| Avg Up-Day Volume | 13,932,444 |
| Avg Down-Day Volume | 11,475,605 |
| Up/Down Ratio | 1.21x |
Volume on up days exceeds down days by 21%, indicating net buying pressure. This is a positive sign, though the ratio is not overwhelmingly bullish.
On-Balance Volume (OBV)
OBV has been declining over the past 20 days while price has held relatively steady. This is a mild bearish divergence -- it suggests that the recent price advance near $390 was not supported by strong volume conviction. However, the magnitude of the divergence is modest.
Accumulation/Distribution Line
The A/D line has been rising over the past 20 days, which contradicts the OBV signal. The divergence between OBV and A/D occurs because: - OBV simply assigns all volume as buying or selling based on the close direction. - A/D weights volume by where the close falls within the day's range (close location value).
The fact that A/D is rising suggests that even on days when TSM closed lower, it tended to close nearer to the day's high than the low -- a sign of underlying buying pressure.
Volume Trend
The volume trend is statistically neutral. Neither the 60-day volume slope (+23,203/day, p=0.58) nor the 120-day slope (-5,701/day, p=0.66) is statistically significant. Volume is neither confirming nor denying the price advance -- it is simply stable.
High-Volume Price Nodes (Last 6 Months)
The volume profile analysis reveals the highest-volume price zone in the last 6 months is the $289-$302 area, which corresponds to the November-December consolidation range. This is now well below the current price and represents a significant support zone if a larger correction were to occur.
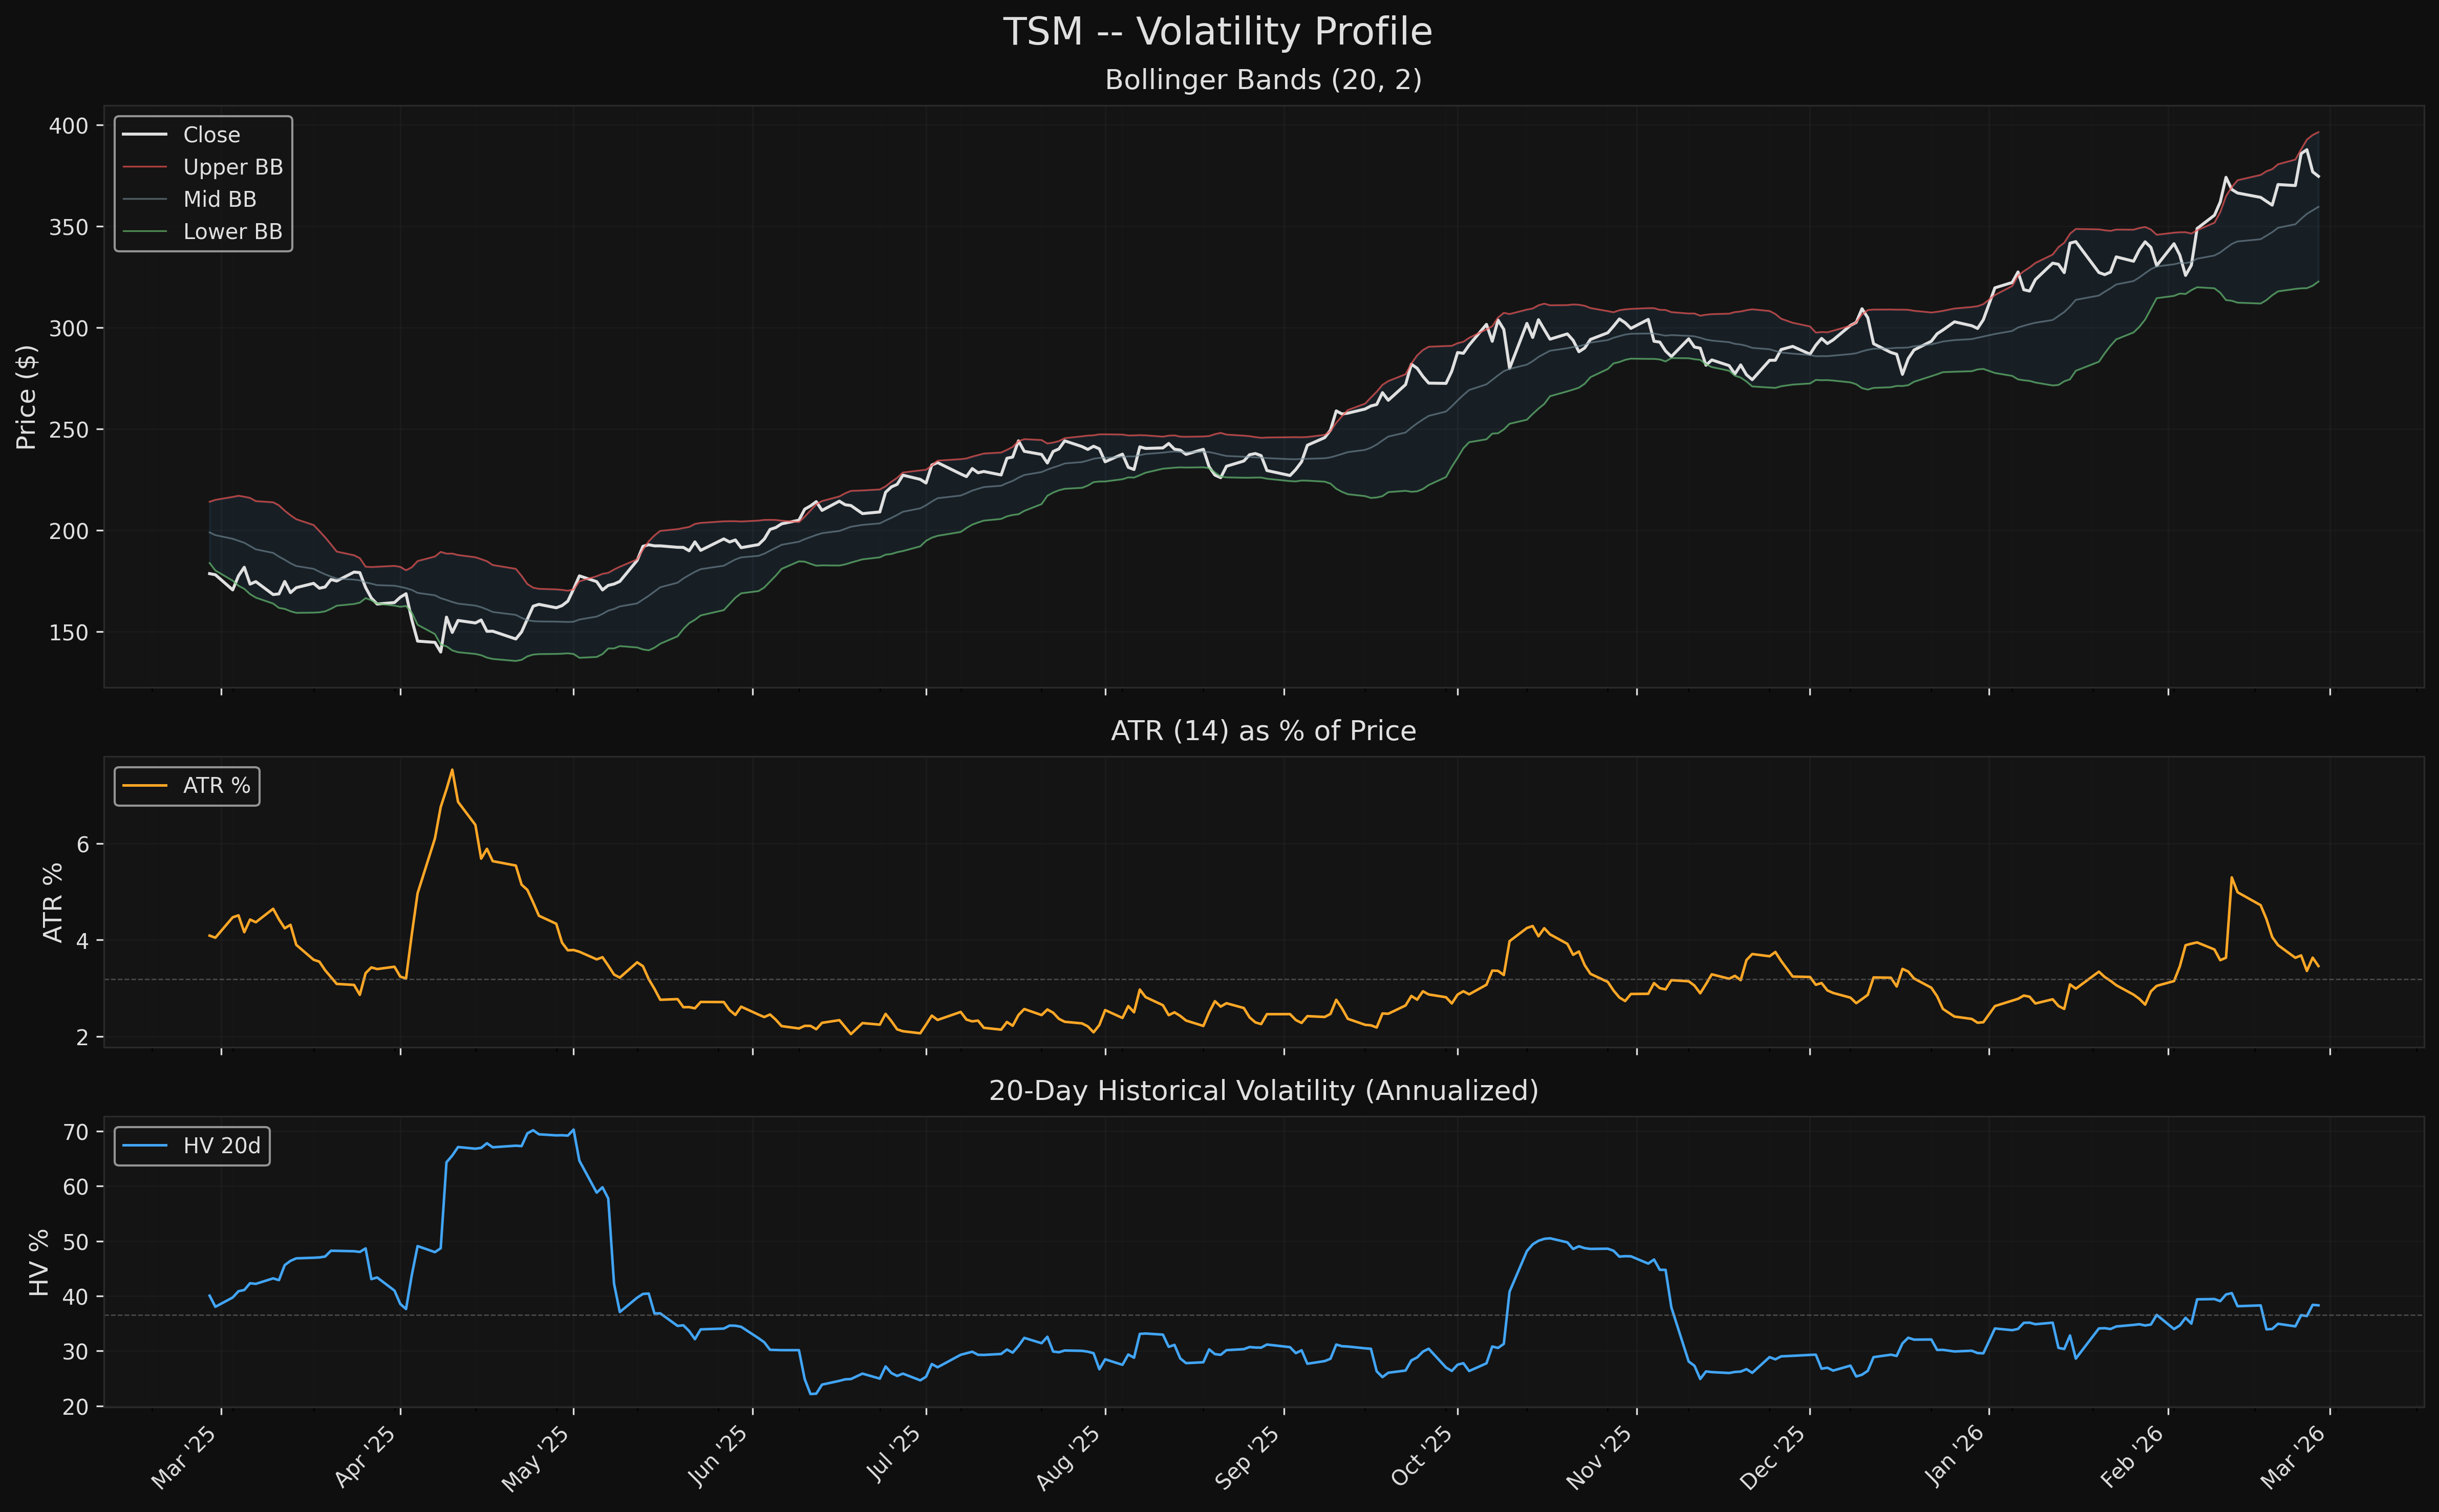
6. Volatility Profile
Chart: charts/tsm_volatility.png
Current Volatility Metrics
| Metric | Value |
|---|---|
| ATR(14) | $12.95 |
| ATR as % of Price | 3.46% |
| Historical Volatility (20d, annualized) | 38.3% |
| Bollinger Band Width | 20.49% |
| BB %B | 0.704 |
| BB Upper | $396.39 |
| BB Mid (SMA20) | $359.56 |
| BB Lower | $322.72 |
ATR Analysis
The ATR at 3.46% of price is moderately elevated for a large-cap equity. For context, TSM's historical daily ranges tend to be wider than the average S&P 500 component due to its semiconductor sector exposure and geopolitical risk premium related to Taiwan. The ATR suggests a typical daily range of approximately $13 -- meaningful for position sizing.
Bollinger Band Analysis
TSM trades at BB %B of 0.704, in the upper half of the Bollinger Bands but not touching the upper band. This is a normal reading in an uptrend. The Bollinger Band width at 20.49% is moderately wide, indicating that volatility is elevated but not extreme. Price is closer to the upper band ($396.39) than the lower band ($322.72), consistent with the bullish trend.
Return Distribution
| Statistic | Full History | Trailing 1 Year |
|---|---|---|
| Mean Daily Return | +0.1431% | +0.2946% |
| Std Dev | 2.2725% | 2.4260% |
| Skewness | +0.2123 | +0.2447 |
| Kurtosis | 3.4994 | 2.6507 |
| Max Daily Gain | +12.65% | -- |
| Max Daily Loss | -14.03% | -- |
| Sharpe Ratio (ann) | 1.000 | 1.928 |
The return distribution shows positive skewness (+0.21 full history, +0.24 trailing year), meaning the distribution of daily returns is slightly tilted toward positive outliers. The kurtosis of 3.50 (full history) indicates fat tails -- TSM occasionally experiences large moves in either direction. The trailing 1-year Sharpe ratio of 1.928 is excellent, indicating strong risk-adjusted returns.
7. Entry Point Assessment
TSM's position near its 52-week high (93.9% of range, just 4.0% below) makes current-price entries challenging from a risk/reward perspective. The best entries come on pullbacks to confluence zones.
Confluence Zone Ranking
Zone 1 -- Aggressive Entry: $350-$365 (Pullback to EMA21/SMA20 area)
| Factor | Level | Notes |
|---|---|---|
| EMA21 | $361.28 | Short-term trend support |
| SMA20 | $359.56 | 20-day mean |
| Round Number | $350.00 | Psychological support |
| Stop Loss | $320.00 | Below SMA50 and prior lows |
| R:R to $390 (T1) | 1.34:1 (from $350) | Moderate |
| R:R to $425 (T2) | 2.50:1 (from $350) | Favorable |
This zone represents a normal pullback in a strong uptrend. If the stock were to test the SMA20 at $359 or the $350 round number, it would be a higher-probability entry point.
Zone 2 -- Conservative Entry: $330-$340 (SMA50 / Fib 78.6% area)
| Factor | Level | Notes |
|---|---|---|
| SMA50 | $333.94 | Major trend support |
| Fib 78.6% | $335.16 | Key Fibonacci level |
| EMA50 | $340.08 | Intermediate trend support |
| Stop Loss | $320.00 | Below confluence cluster |
| R:R to $390 (T1) | 4.04:1 (from $334) | Excellent |
| R:R to $425 (T2) | 6.53:1 (from $334) | Excellent |
This deeper pullback zone would represent a significant buying opportunity. The confluence of SMA50, Fib 78.6%, and the $340 EMA50 creates a strong support cluster. Historically, pullbacks to the SMA50 in strong uptrends tend to be short-lived.
Current Price Entry: $374.58
| Factor | Notes |
|---|---|
| Distance to R1 ($390) | +4.2% upside |
| Distance to Stop ($320) | -14.6% downside |
| R:R to $390 | 0.29:1 -- Unfavorable |
| R:R to $425 | 0.92:1 -- Marginal |
Entering at the current price offers poor risk/reward unless the stop is tightened significantly (which increases the probability of being stopped out).
8. Risk/Reward Framework
Scenario 1: Aggressive (Pullback to $350)
| Parameter | Value |
|---|---|
| Entry | $350.00 |
| Stop Loss | $320.00 (below SMA50) |
| Risk | $30.00 (8.6%) |
| Target 1 | $390.21 (retest 52w high) |
| Target 2 | $425.00 (round number extension) |
| R:R to T1 | 1.34:1 |
| R:R to T2 | 2.50:1 |
| Probability Assessment | Moderate -- requires a meaningful pullback that may not occur in this trend |
Scenario 2: Conservative (Pullback to SMA50)
| Parameter | Value |
|---|---|
| Entry | $333.94 |
| Stop Loss | $320.00 (below SMA50) |
| Risk | $13.94 (4.2%) |
| Target 1 | $390.21 (retest 52w high) |
| Target 2 | $425.00 (round number extension) |
| R:R to T1 | 4.04:1 |
| R:R to T2 | 6.53:1 |
| Probability Assessment | Lower probability of reaching this entry in the near term, but excellent R:R if it does |
Scenario 3: Breakout (Above $390 ATH)
| Parameter | Value |
|---|---|
| Entry | $392.00 (breakout confirmation) |
| Stop Loss | $370.00 (below recent consolidation) |
| Risk | $22.00 (5.6%) |
| Target 1 | $425.00 (round number) |
| Target 2 | $450.00 (psychological + measured move) |
| R:R to T1 | 1.50:1 |
| R:R to T2 | 2.64:1 |
| Probability Assessment | Moderate-high given the trend strength; breakouts from clean uptrends tend to work |
9. Key Levels Summary
| Level | Price | Type | Significance |
|---|---|---|---|
| $450.00 | Resistance | Round number / measured move target | Extended target |
| $425.00 | Resistance | Round number above ATH | Primary upside target |
| $400.00 | Resistance | Major round number | Psychological barrier |
| $396.39 | Resistance | BB Upper Band | Dynamic resistance |
| $390.21 | Resistance | 52-Week High (Feb 25) | Key breakout level |
| $374.58 | -- | Current Price | -- |
| $361.28 | Support | EMA21 | Short-term trend support |
| $359.56 | Support | SMA20 / BB Mid | Near-term mean |
| $350.00 | Support | Round Number | Psychological support |
| $340.08 | Support | EMA50 | Intermediate trend support |
| $335.16 | Support | Fib 78.6% Retracement | Key Fibonacci level |
| $333.94 | Support | SMA50 | Major trend-defining support |
| $322.72 | Support | BB Lower Band | Dynamic support |
| $319.07 | Support | Feb 4 Swing Low | Prior higher low |
| $313.36 | Support | SMA100 | Long-term trend support |
| $291.95 | Support | Fib 61.8% Retracement | Deep correction level |
| $272.47 | Support | SMA200 | Secular trend support |
10. Overall Technical Score
Weighted Composite Breakdown
| Component | Score | Weight | Contribution | Key Drivers |
|---|---|---|---|---|
| Trend Alignment | 9.0/10 | 25% | 2.25 | Price above all MAs, perfect bullish alignment, all slopes rising, golden cross active |
| Momentum | 7.0/10 | 20% | 1.40 | RSI 62 in bullish zone (not overbought), MACD above signal, no bearish divergence |
| Volume Confirmation | 7.0/10 | 20% | 1.40 | A/D line rising, up/down vol ratio 1.21x, volume profile supportive; OBV divergence is concern |
| Volatility Profile | 6.2/10 | 15% | 0.93 | ATR 3.5% moderately elevated, BB%B 0.70 (healthy), positive skew; slightly wide bands |
| Market Structure | 9.0/10 | 20% | 1.80 | Higher highs and higher lows confirmed, R-squared 0.94 on 60-day trend, clean uptrend |
| OVERALL | 7.8/10 | 100% | 7.78 | Rounded to 7.8 |
Bias Determination
With an overall score of 7.8/10, the bias is Bullish. The trend is strong, structure is clean, and momentum is healthy. The deductions come primarily from: - Volatility (ATR slightly elevated for a large-cap, reducing the volatility score from ideal) - OBV divergence (20-day declining OBV while price holds, partially offsetting good A/D line) - Extended distance from the 200 SMA (37.5% -- mean-reversion risk)
11. Relative Strength vs SPY
| Metric | Value |
|---|---|
| 1-Year Correlation with SPY | 0.7284 |
| Beta | 1.4445 |
| Daily Alpha | +0.001928 |
| RS Line vs 50-day MA | ABOVE (outperforming) |
TSM has a beta of 1.44 to SPY, meaning it amplifies market moves by roughly 44%. Despite this higher beta, TSM has generated positive alpha of +0.19% daily over the trailing year, indicating genuine outperformance beyond what beta alone would explain. The relative strength line is above its 50-day moving average, confirming that TSM is currently outperforming the broader market. This is bullish -- stocks that are outperforming the market tend to continue doing so.
Limitations
-
OHLCV data only. This analysis uses daily open/high/low/close/volume data. It does not incorporate options flow, dark pool prints, short interest, analyst estimate revisions, or institutional positioning data -- all of which can provide additional signal for a large-cap like TSM.
-
No geopolitical risk modeling. TSM is the world's most important semiconductor company, located in Taiwan. Geopolitical tensions between China and Taiwan represent a significant exogenous risk that is not captured by any technical indicator. This is a fundamental/macro risk that technical analysis cannot price.
-
Near-ATH behavior is pattern-poor. When a stock is at or near its all-time high, there is no overhead supply (historical resistance) above the ATH level. The resistance levels above $390 ($400, $425, $450) are based on round numbers and measured move projections, not on actual price history. These levels are inherently less reliable than levels derived from prior price action.
-
Volume trend is ambiguous. The volume data shows conflicting signals (OBV declining vs A/D rising). Neither the 60-day nor 120-day volume trend slopes are statistically significant (p=0.58 and p=0.66 respectively). This means we cannot reject the null hypothesis that volume is flat -- drawing conclusions about distribution or accumulation from this data is speculative.
-
Single-timeframe analysis. This report analyzes daily data only. Weekly and monthly charts may show different momentum readings and structural patterns. Intraday data (volume profile, VWAP) would provide additional precision for entry point assessment.
-
Semiconductor sector cyclicality. TSM's price is influenced by the semiconductor demand cycle. The 95% 1-year return may partially reflect a cyclical upturn rather than permanent repricing. Technical analysis does not distinguish between secular and cyclical trends.
-
Return distribution caveat. While the trailing 1-year Sharpe ratio of 1.93 is excellent, this reflects a strong trend environment. Sharpe ratios are not stable -- they can deteriorate rapidly if the trend reverses. The positive skewness and fat tails (kurtosis 3.50) mean that large moves -- in either direction -- are more likely than a normal distribution would predict.
-
Score subjectivity. The component scores use a systematic framework, but the specific scoring rules (e.g., +1.0 point for price above SMA200) are heuristics, not empirically validated scoring models. Different weighting schemes or scoring rules could produce meaningfully different overall scores.
Charts