TSM
Conviction 4TSM -- Combined Deep Dive Assessment
Date: 2026-02-27 Asset Class: Equity Ticker: TSM (Taiwan Semiconductor Manufacturing)
Fundamental Summary
| Metric | Value |
|---|---|
| Overall Score | 82.6/100 |
| Verdict | AVOID |
Key Strengths: - Dominant foundry (71% share), FY2025 rev +35.9% to $122B, gross margin 62.3% - Fortress balance sheet (net cash ~$66B, D/E 0.18), only advanced-node producer
Key Risks: - CRITICAL: Taiwan Strait geopolitical risk (~90% of advanced fab capacity in Taiwan) - P/FCF ~50x (2x historical), FCF near-zero in 2026 from $52-56B capex
(Full report: TSM-fundamental-summary.md)
Technical Summary
| Metric | Value |
|---|---|
| Overall Score | 7.8/10 |
| Bias | Bullish |
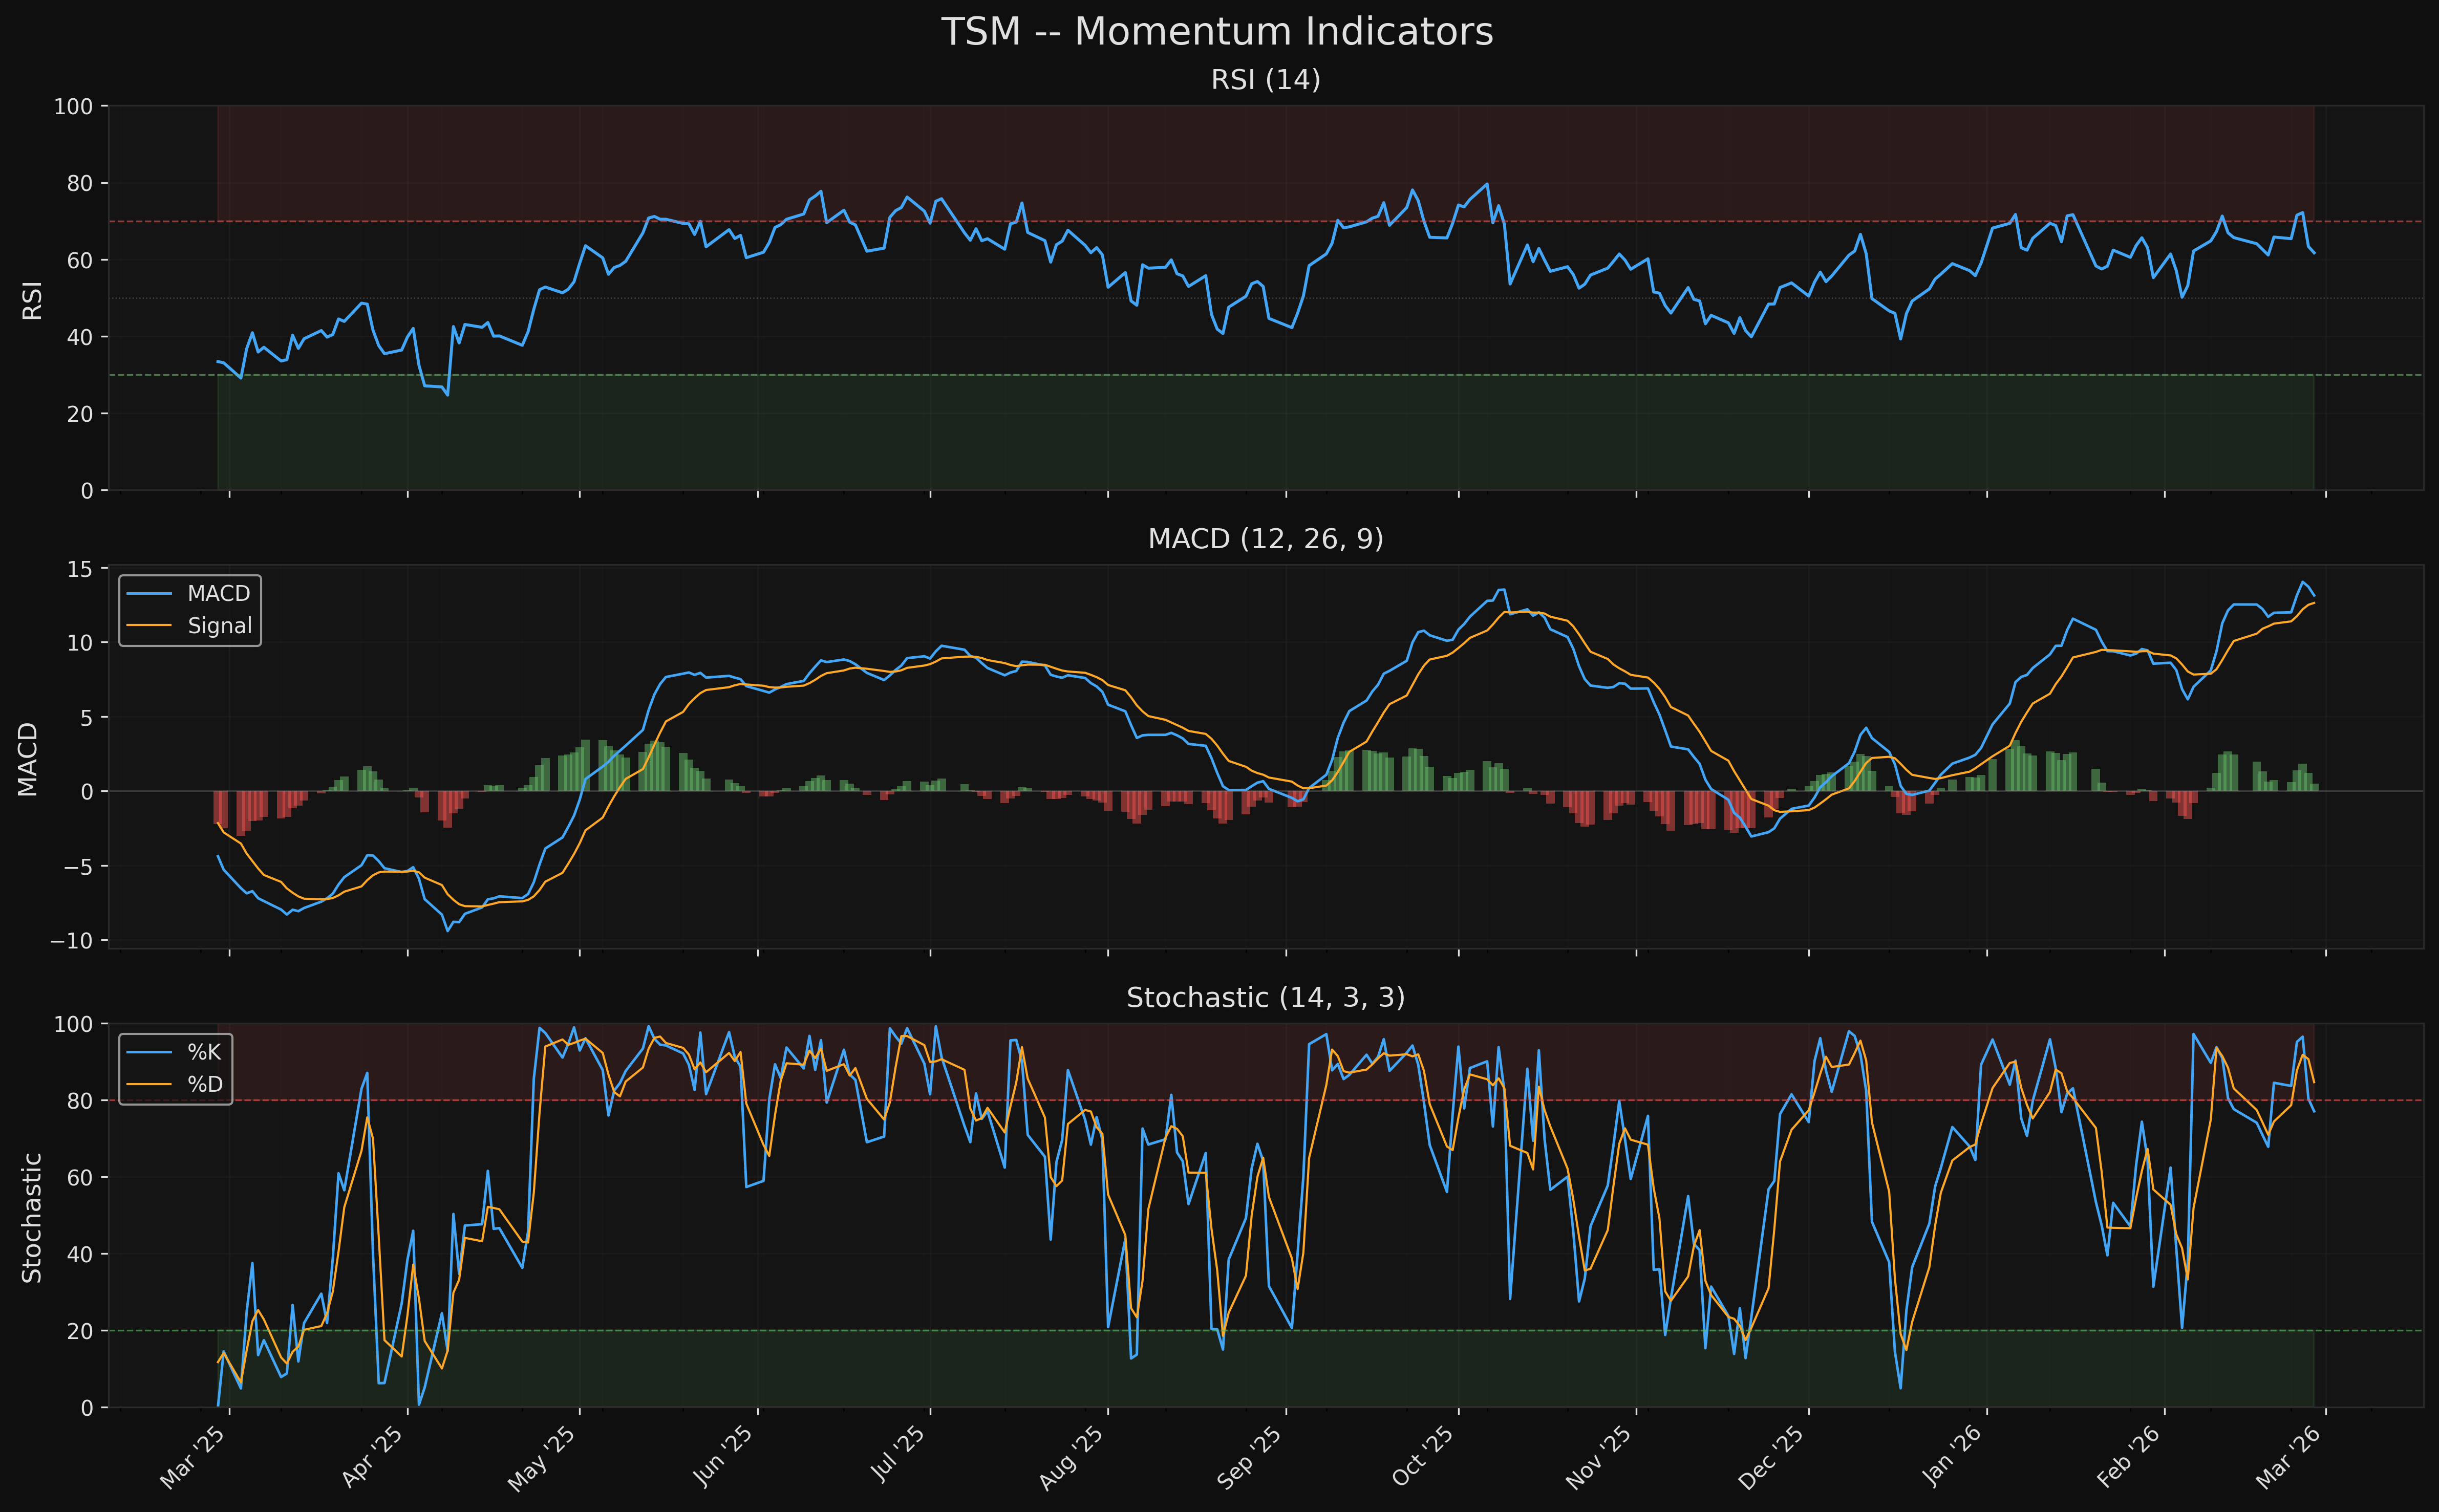
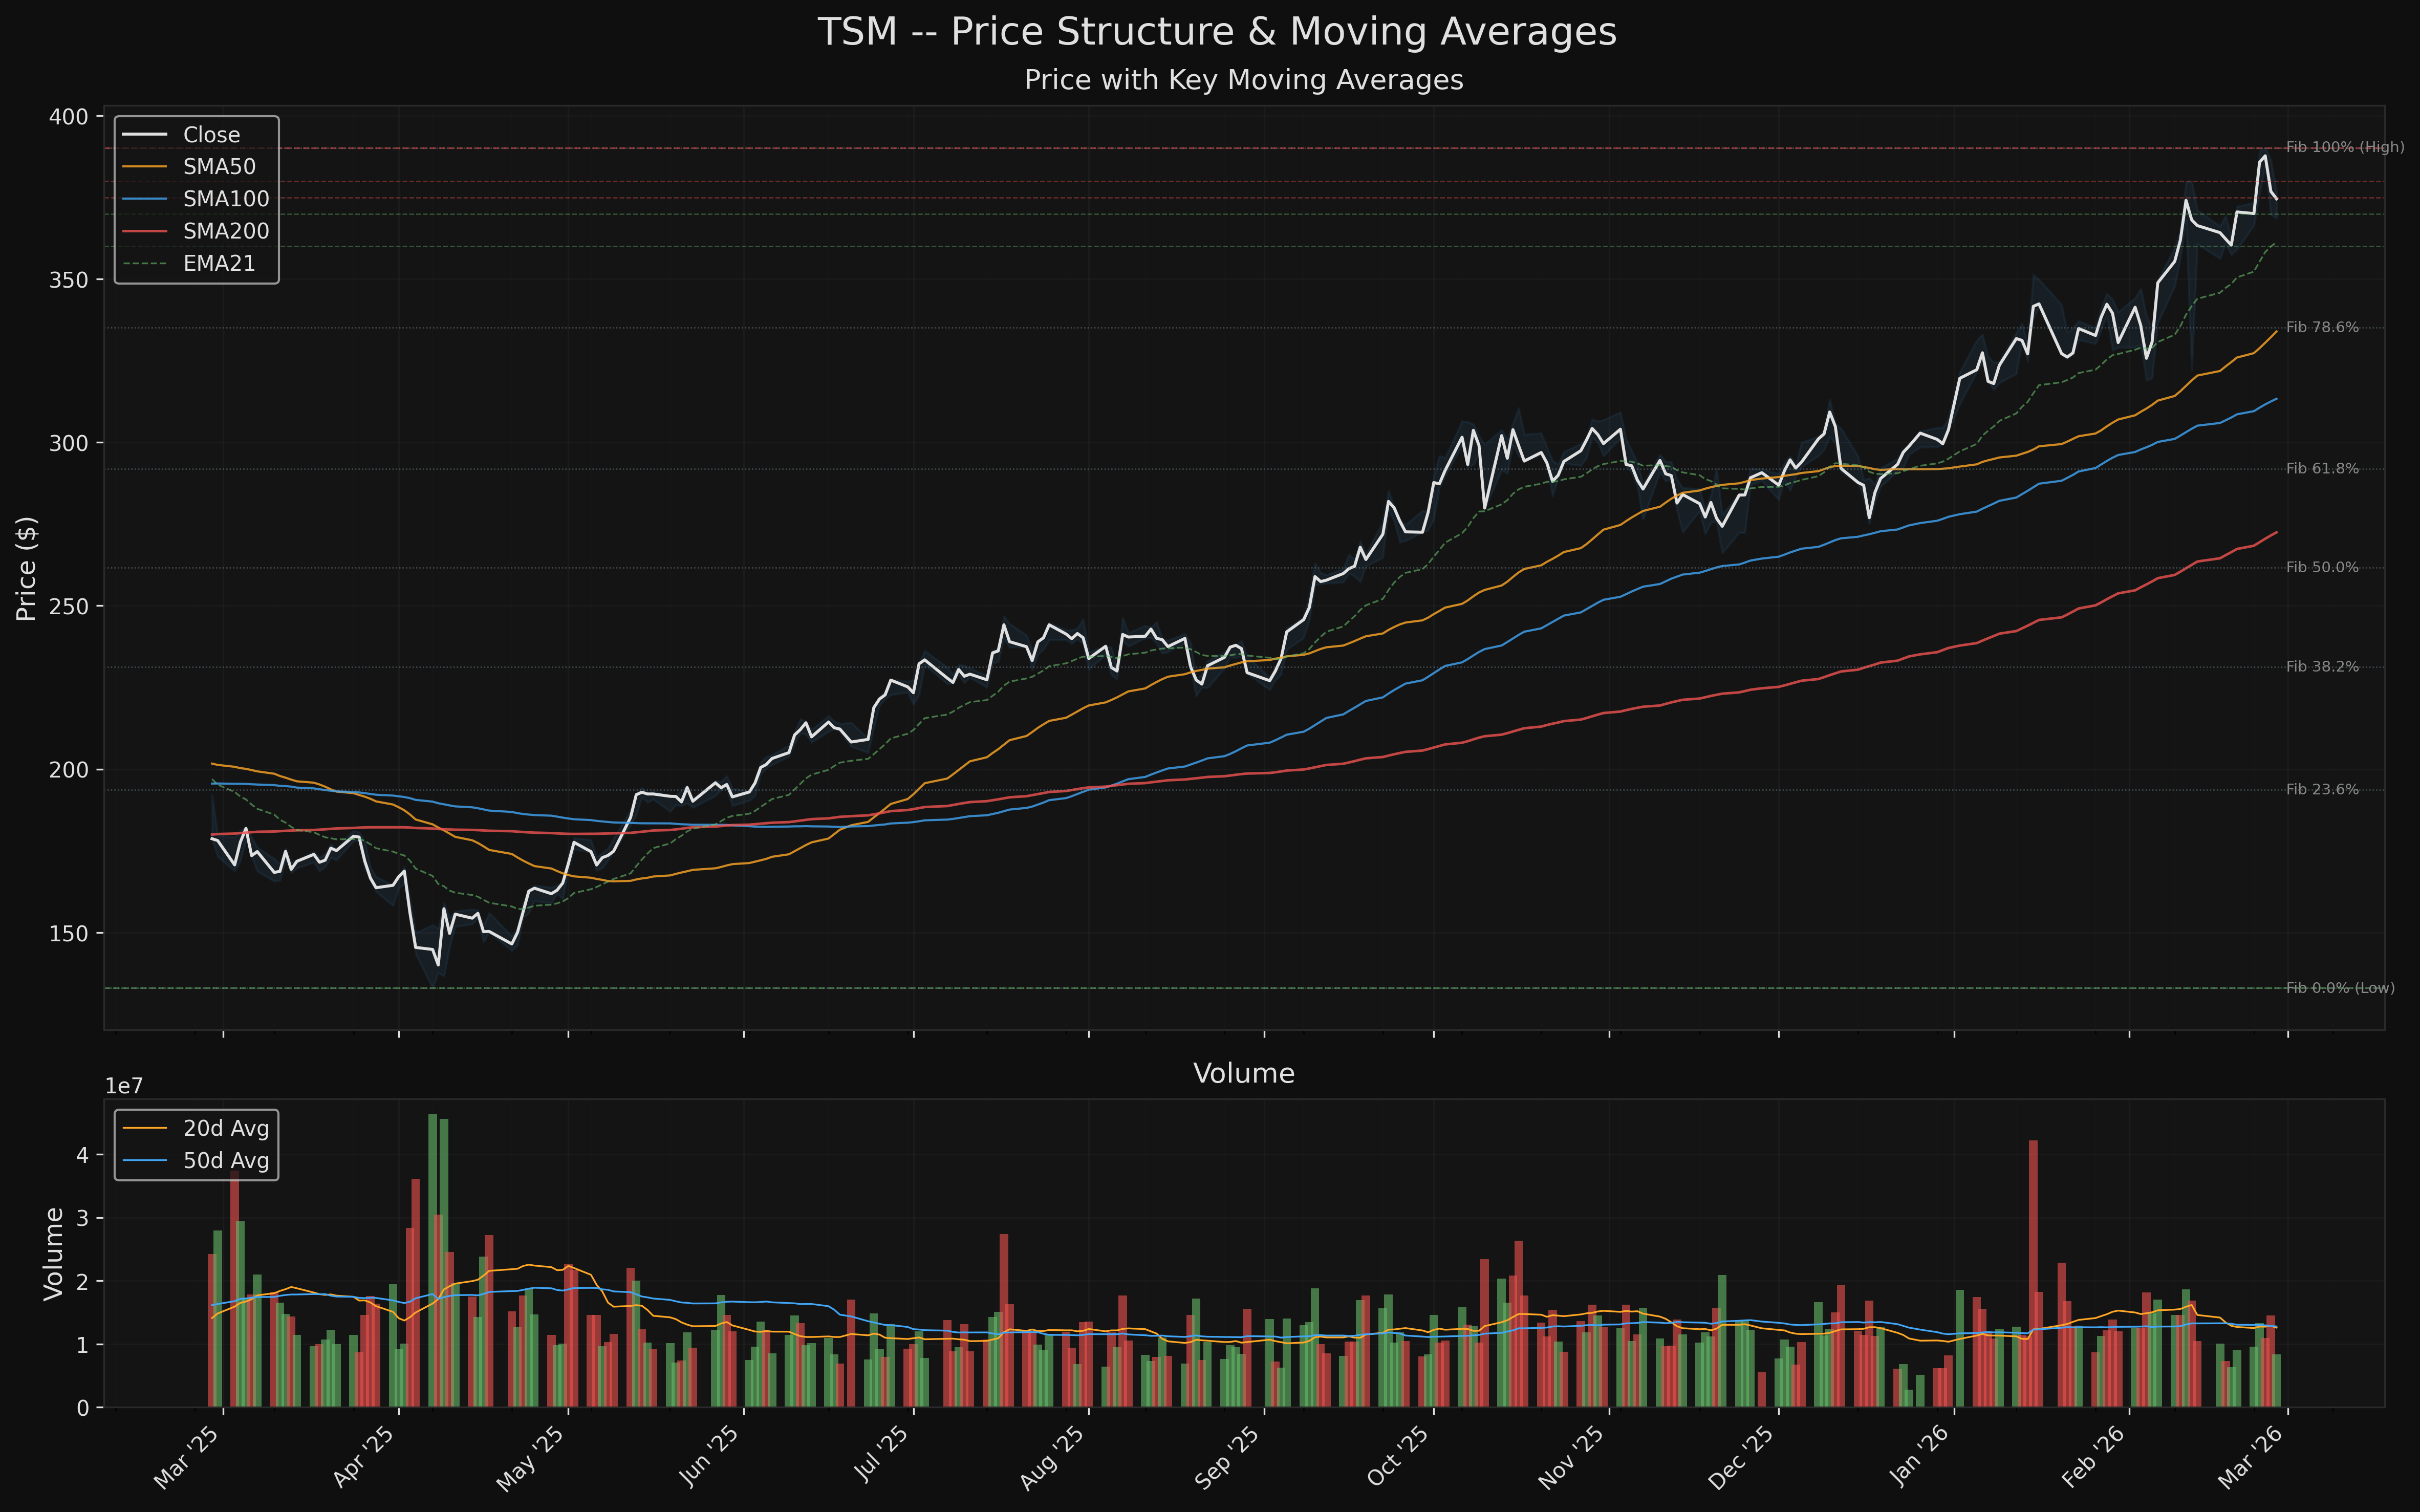
Trend: Above all MAs, perfect bullish alignment, R2=0.94. Momentum: RSI 62 (bullish, not overbought), MACD above signal. Key Levels: Support $334 (SMA50), Resistance $390 (52wk high).
(Full report: TSM-technical-summary.md)
AGREEMENT Assessment
Fundamental-Technical Alignment: PARTIAL ALIGNMENT
The fundamental business quality (82.6/100) and bullish technicals (7.8/10) agree that TSM is a strong company in a strong uptrend. However, the fundamental verdict is AVOID due to a CRITICAL geopolitical red flag (Taiwan Strait risk), while technicals show unambiguous bullish momentum. This is a divergence between risk-framework rules and price action -- the market is pricing TSM as a momentum leader while the risk framework flags binary tail risk.
For existing holders: the technical picture supports holding. For new entrants: the AVOID verdict means this requires explicit acceptance of the geopolitical tail risk before sizing.
Key Levels
| Level | Price | Source |
|---|---|---|
| Resistance 2 | $425 | Round number extension above ATH |
| Resistance 1 | $390 | 52-week high retest |
| Current Price | $375 | -- |
| Support 1 (Zone 1) | $350-$365 | EMA21/SMA20 pullback area |
| Support 2 (Zone 2) | $330-$340 | SMA50 / Fib 78.6% confluence |
Risk/Reward Framework
Scenario 1: Zone 1 Entry (EMA21/SMA20 Pullback)
- Entry: $350-$365 (pullback to EMA21/SMA20 area)
- Target: $390 (52-week high retest)
- Stop: $320 (below SMA50 and prior swing lows)
- R:R: 1.3:1 (to T1)
- Probability: Moderate-High (natural pullback within bullish trend)
Scenario 2: Zone 2 Entry (SMA50 Confluence)
- Entry: $330-$340 (pullback to SMA50 / Fib 78.6% confluence)
- Target: $390 (52-week high retest)
- Stop: $320 (below SMA50 and prior swing lows)
- R:R: 4.0:1 (to T1)
- Probability: Lower (requires deeper correction, but excellent R:R)
Conviction Assessment
| Component | Value | Rationale |
|---|---|---|
| Fund-Tech Agreement | 0.60 | Partial -- business fundamentals (82.6) and technicals (7.8/10) both strong, but AVOID verdict conflicts with bullish bias |
| Catalyst Density | 0.90 | Dense -- monthly revenue disclosures, Q1 earnings Apr 16, Arizona fab Phase 2, N2 revenue H2 2026 |
| Data Quality | 0.90 | Large-cap -- $1.65T mega-cap, extensive analyst coverage, monthly revenue transparency |
| Risk/Reward Asymmetry | 0.65 | R:R at Zone 1 is ~1.3:1, at Zone 2 is ~4:1; blended assessment reflects need for patience |
| Red Flag Severity | 0.70 | All disclosed -- all 6 red flags are structural/disclosed -- Taiwan risk, valuation, concentration all well-known |
Conviction Score: 4 (Above Average) Weighted Score: 74.0/100 Position Sizing: 75% of target (4-5% of portfolio)
Actionable Framework
Position Type: New (with geopolitical risk acceptance) Position Size: 4-5% of portfolio (75% of full target, per conviction 4)
Entry Zones: - Zone 1: $350-$365 | Trigger: Pullback to EMA21/SMA20 area - Zone 2: $330-$340 | Trigger: Pullback to SMA50 / Fib 78.6% confluence
Stop Loss: $320 | Below SMA50 and prior swing lows
Targets: - Target 1: $390 | 52-week high retest - Target 2: $425 | Round number extension above ATH
Risk/Reward: 1.3:1 (to T1 from Zone 1) / 4.0:1 (to T1 from Zone 2)
Key Monitoring Triggers:
Upgrade thesis if: - Breakout above $390 on above-average volume; Arizona fab milestones ahead of schedule; N2 yield data exceeds expectations; geopolitical de-escalation signals
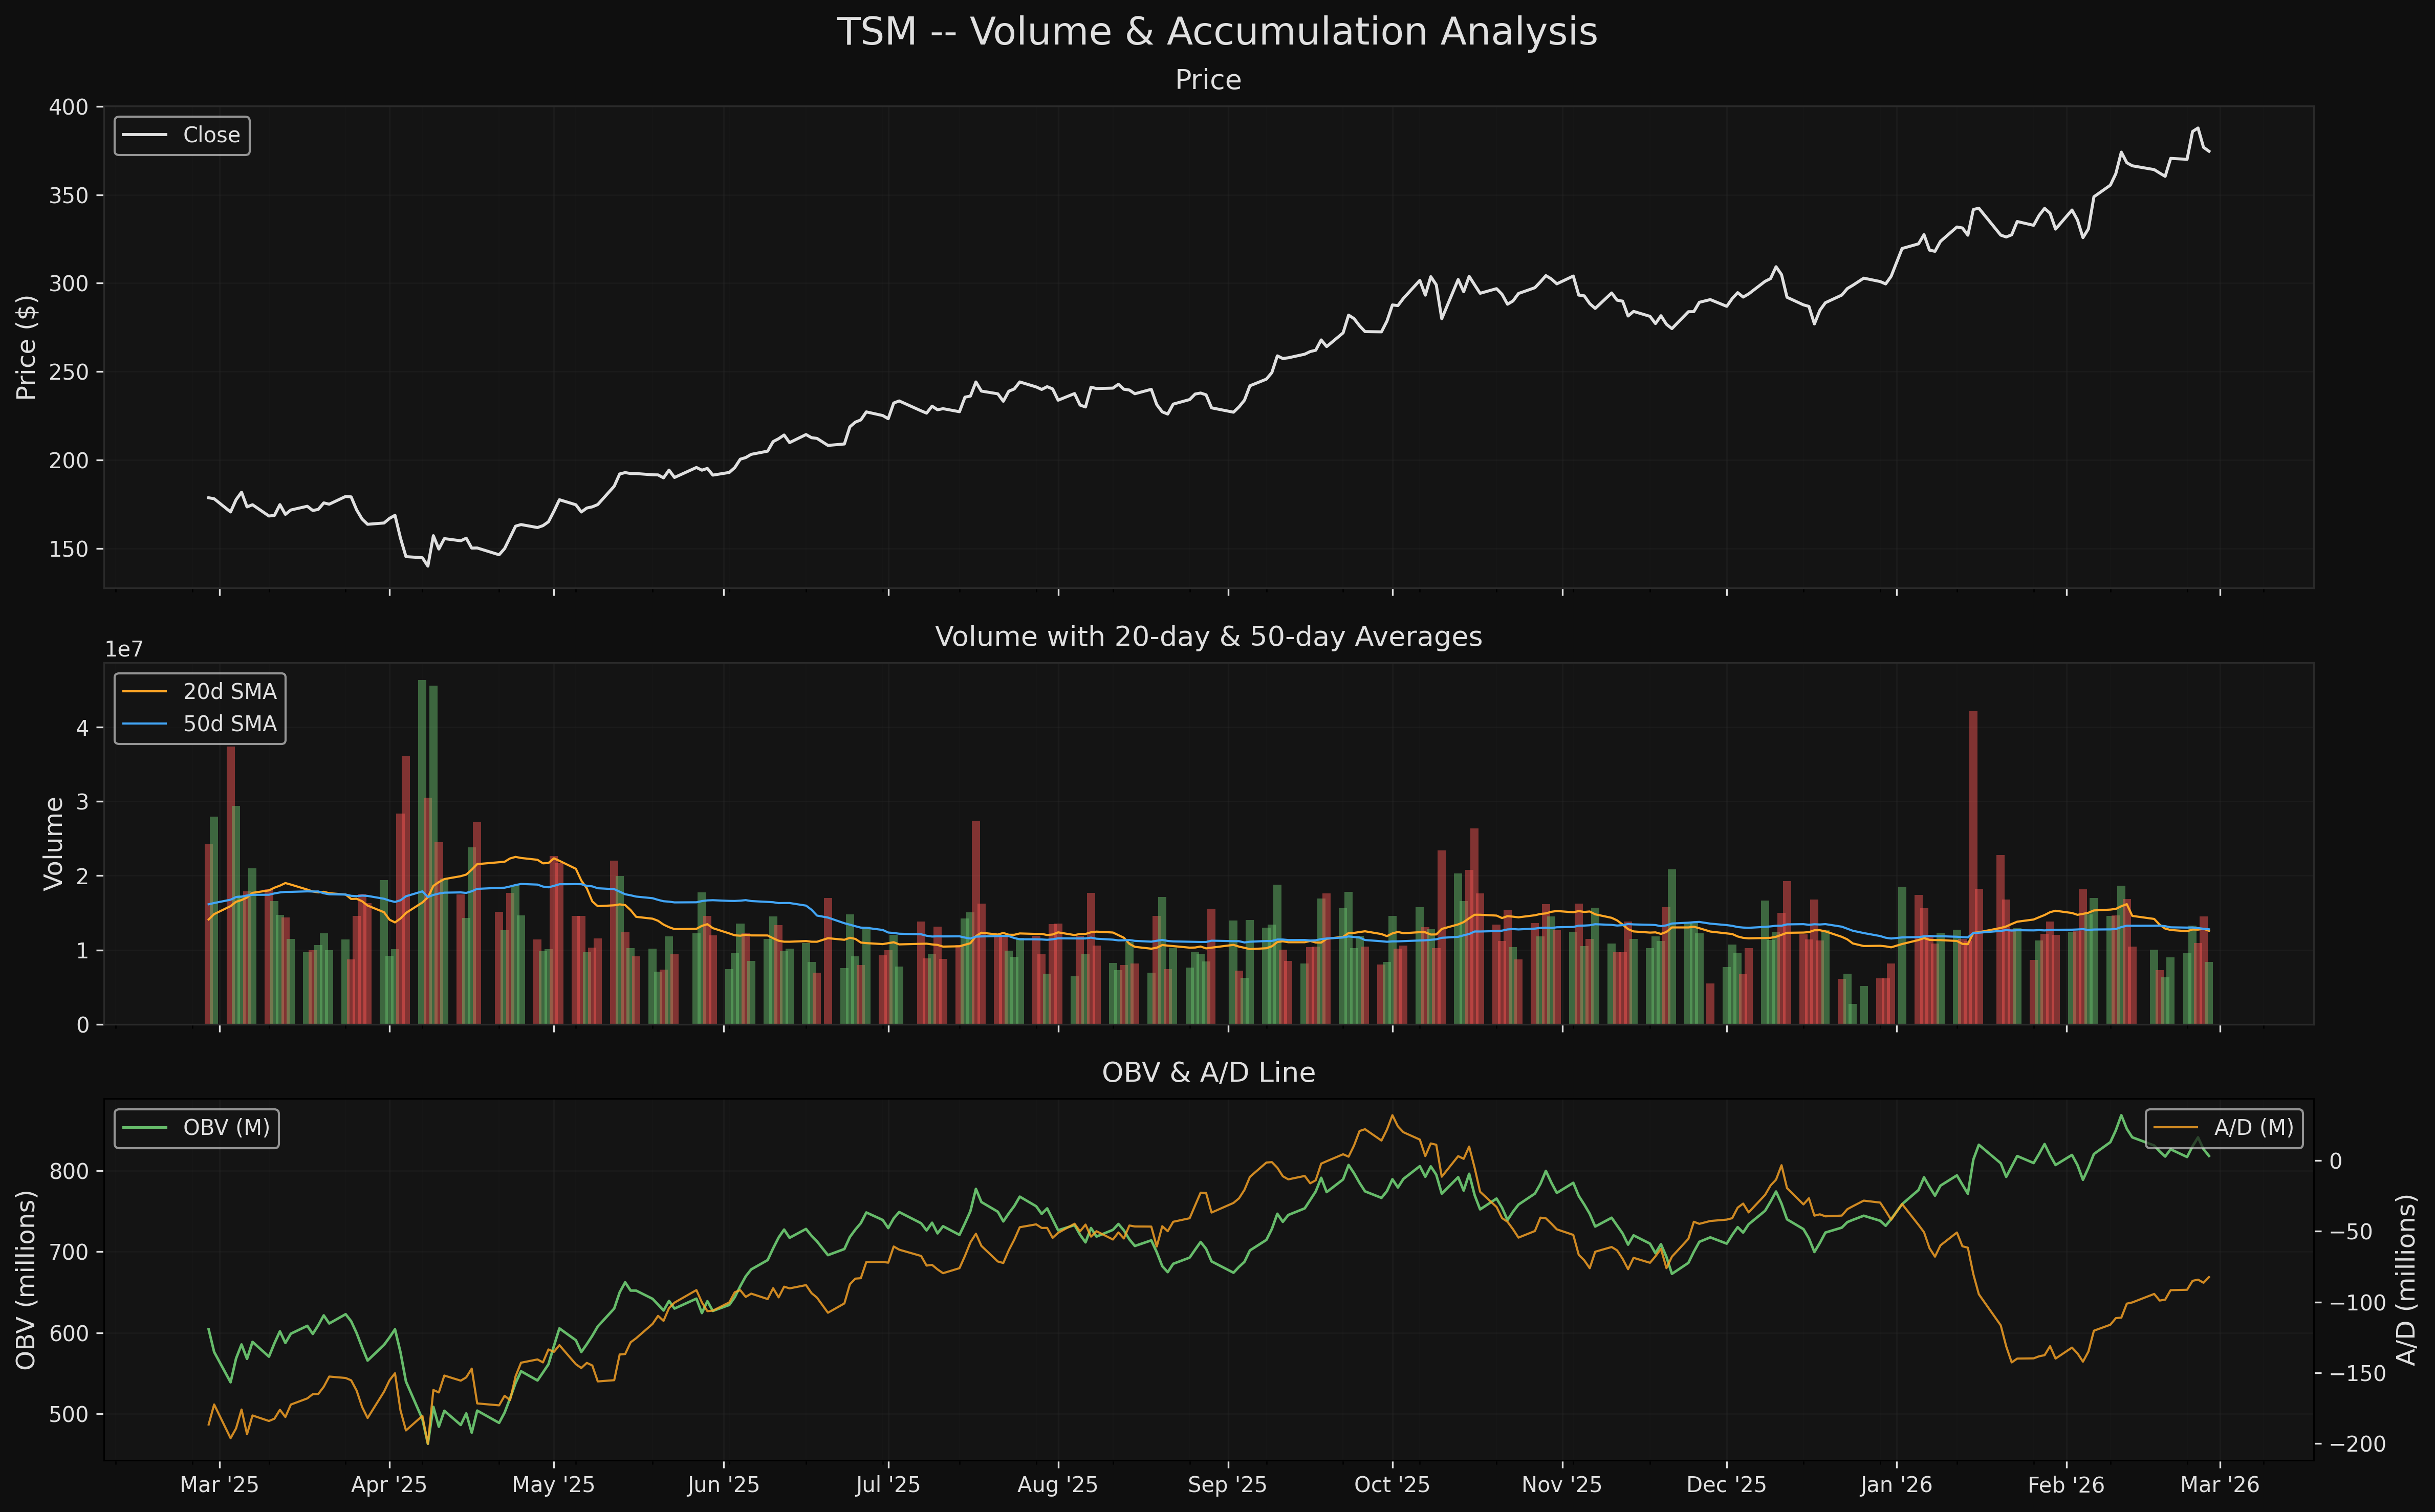
Downgrade thesis if: - Close below SMA50 ($334); OBV divergence expands with declining A/D line; Q1 2026 earnings miss or guidance cut; hyperscaler capex moderation signals
Exit immediately if: - Close below $320 (stop); Taiwan Strait military escalation; major customer loss (Apple/NVIDIA fab shift)
Limitations: - AVOID verdict is rules-driven (CRITICAL flag = AVOID). Investors who have explicitly accepted the Taiwan risk may treat the 82.6 fundamental score and conviction 4 as the operative signals. - Current-price entry ($375) offers R:R of only 0.29:1 to T1. Wait for pullback zones for favorable risk/reward. - No options flow, dark pool, or short interest data incorporated. - FCF projections for 2026 are negative due to capex -- this is a capex-driven compression, not an earnings issue.
Charts