TDY — Technical Summary
Conviction 4===========================================================
TDY -- Technical Analysis 2026-03-08
Asset Class: Equity
Price: $647.64 | 52wk: $419.00 - $693.38
===========================================================
OVERALL SCORE: 5.4/10 BIAS: Neutral (short-term Bearish, medium-term Bullish)
COMPONENT SCORES
-----------------------------------------------------------
Trend Alignment 7.5/10 wt 25% Strong uptrend; price above all major MAs
Momentum 2.0/10 wt 25% RSI collapsing (67 -> 44 in 5 days); MACD bearish
Volume Confirmation 5.5/10 wt 20% OBV above 20d avg; recent vol below average
Volatility Profile 6.0/10 wt 15% ATR 2.6%; BB squeezing slightly (width 8.4%)
Market Structure 7.0/10 wt 15% Uptrend intact; near 78.6% Fib; extended run
KEY LEVELS
-----------------------------------------------------------
Resistance 2: $693.38 52-week high / all-time recent high
Resistance 1: $668-672 SMA20 zone / prior consolidation
Current Price: $647.64
Support 1: $634.66 78.6% Fibonacci retracement (currently testing)
Support 2: $607-621 Q4 2025 earnings gap zone / post-earnings base
RED FLAGS (1 found)
-----------------------------------------------------------
HIGH RSI dropped 23 points in 5 days (67.2 -> 43.8); MACD histogram deeply [Momentum]
negative (-5.76 vs. -1.08 five days ago); momentum distribution in progress
===========================================================
1. Executive Summary
TDY is in an aggressive short-term pullback after a +26% rally from $510 (early December) to $693 (late February). The stock has given back approximately 7% from the high and is now testing the 78.6% Fibonacci retracement at $634.66. The medium-term uptrend is fully intact — the stock is 17.7% above its 200-day SMA and the structure of higher highs and higher lows remains — but the near-term momentum picture has deteriorated sharply.
RSI dropped from 67.2 to 43.8 in just 5 trading days, the MACD histogram has turned deeply negative (-5.76), and price has crossed below the 20-day SMA ($666.60). This combination is characteristic of a distribution phase or a healthy consolidation prior to the next leg — distinguishing between the two is the key question.
For the user's squeeze signal interest: The stock is NOT currently in a Bollinger Band / Keltner Channel squeeze. Bollinger Width is 8.4% — still elevated from the recent expansion. A squeeze setup would require 2-4 more weeks of narrow consolidation. The $634-650 zone is the key area where a squeeze base could form.
2. Price Structure
Current price: $647.64 (March 6, 2026 close per OHLCV data) 52-week range: $419.00 — $693.38
Recent price action sequence: - Nov 2025: ~$499-510 (lows during late-year consolidation) - Jan 5: Breakout began, stock surged to ~$524 on volume - Jan 21: Q4 2025 earnings gap — opened $607, closed $621 (+18% gap on earnings beat) - Jan 21 — Feb 20: Post-earnings consolidation and continuation to $668+ - Feb 24-27: Surge to $683-685 zone on defense re-rating - Mar 2-4: Peak at $693.38; volume moderating - Mar 5-6: Pull back to $654-647; below SMA20; volume declining
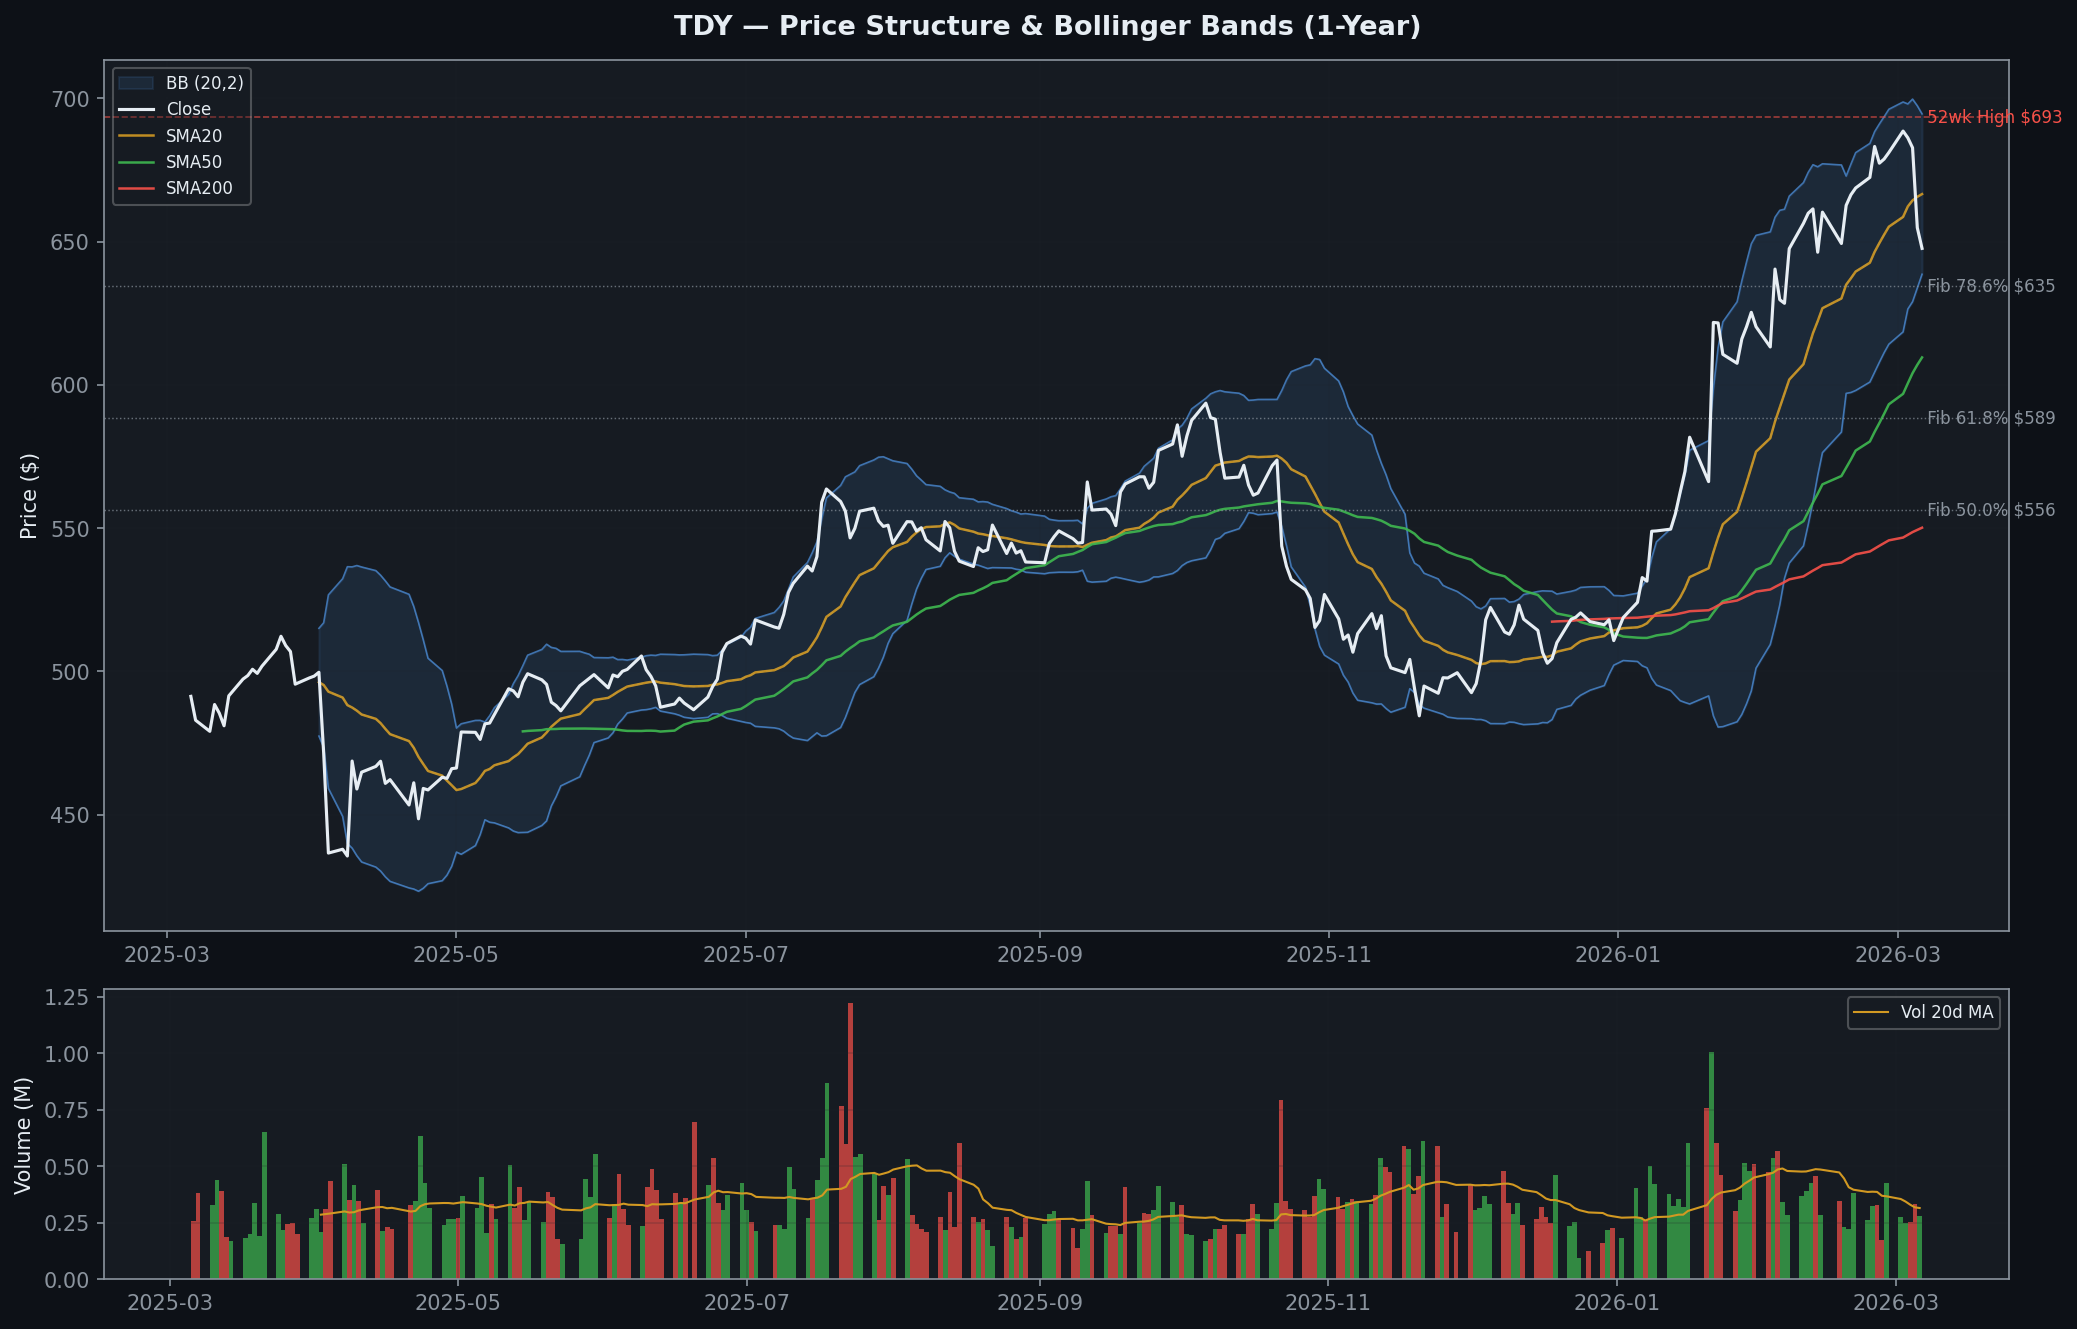
Fibonacci Retracement (52wk low $419 to 52wk high $693.38):
| Level | Price | Notes |
|---|---|---|
| 100% | $693.38 | 52-week high (resistance) |
| 78.6% | $634.66 | Current zone — key support level |
| 61.8% | $588.57 | Next support if 78.6% breaks |
| 50.0% | $556.19 | Mid-range — SMA100 ~$564 confluence |
| 38.2% | $523.81 | Pre-earnings breakout level |
| 0% | $419.00 | 52-week low |
The stock is currently sitting right at the 78.6% retracement ($634.66), making this the critical level. A close below $634 on increased volume would signal a deeper correction toward $588 (61.8%).
3. Price Structure / Market Structure
Wyckoff Phase Analysis:
The 8-week rally from $510 to $693 followed by the current pullback to $647 is consistent with a Distribution Phase (Wyckoff Phase D-E) or a Normal Pullback in an uptrend.
Evidence for Distribution: - Volume has been declining during the most recent rally legs (lower conviction) - RSI made a lower high on the final push to $693 vs. the push to $685 (divergence) - Price has crossed below SMA20 — first time since the November lows
Evidence for Normal Pullback: - OBV remains above its 20-day average (no institutional exodus) - All longer-term SMAs are in bullish alignment (SMA50 > SMA200, price > SMA50) - 20-day volume average is 315K vs. 50-day 366K — declining but not capitulating - The pullback is -6.6% from high — within normal correction range for a trending stock
Bias: Normal pullback until proven otherwise. Distribution would require a break below $620 (earnings gap zone) on heavy volume.
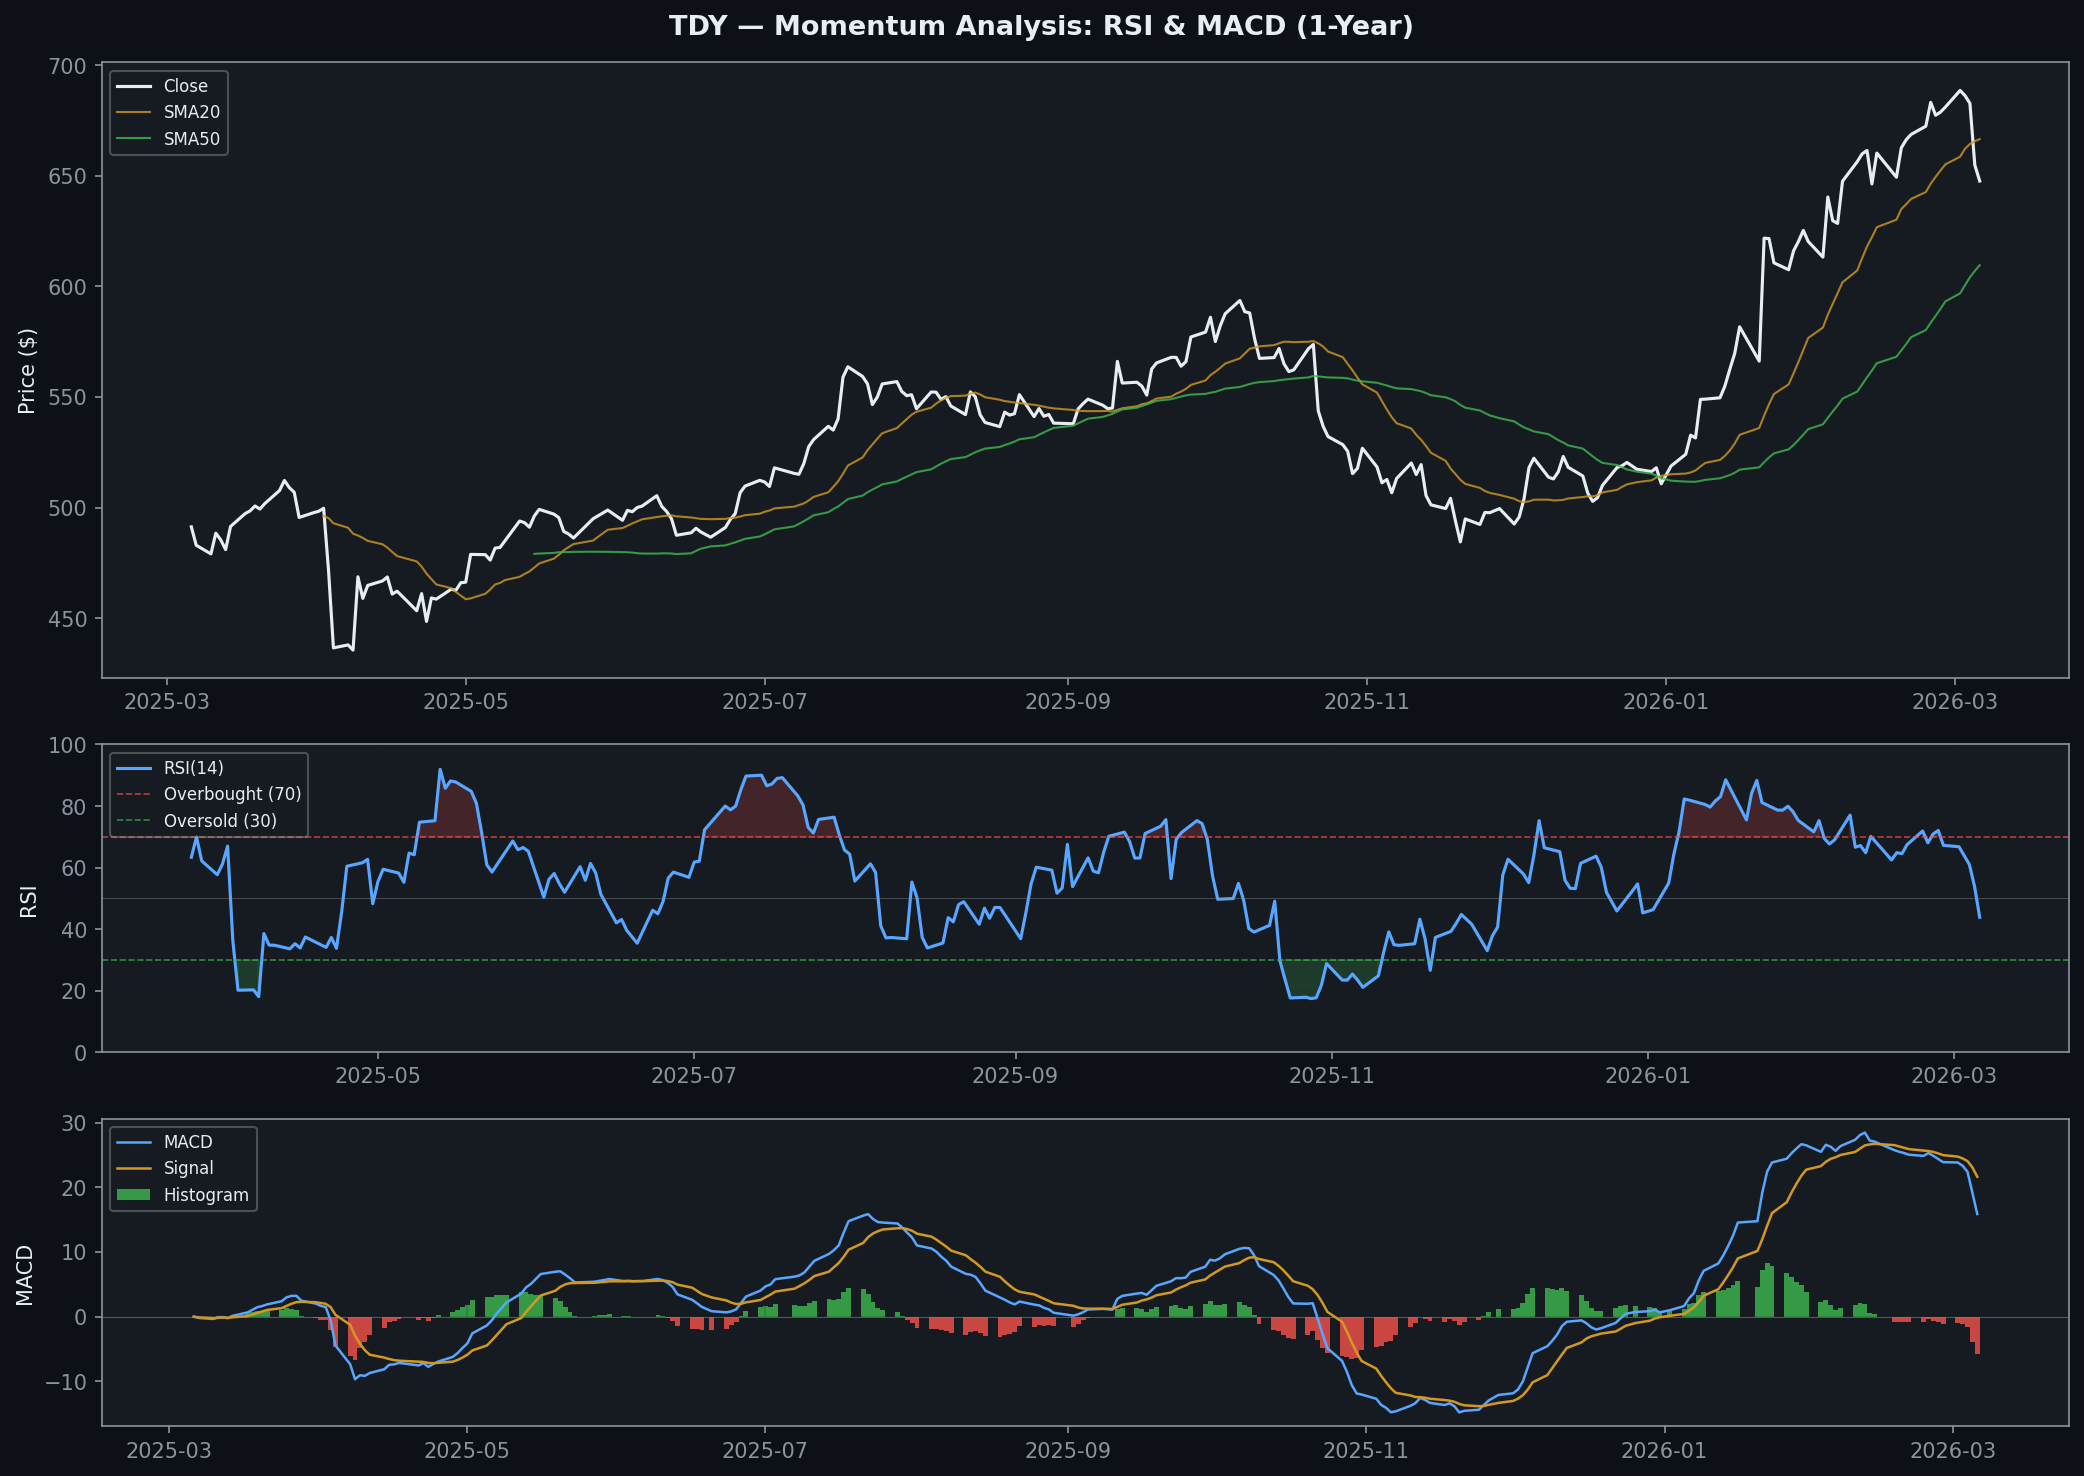
4. Momentum Analysis
RSI (14-day): - Current: 43.8 - 5 days ago: 67.2 - 20 days ago: 67.7
The RSI collapse from ~67 to 43.8 in 5 trading days is significant. RSI has moved from mildly overbought territory into approaching oversold (below 40). The speed of this RSI decline suggests the selling pressure in the current pullback is not trivial.
At 43.8, RSI is approaching the "reset zone" (35-45) that often precedes the next bullish leg in a trending stock. A bounce from these levels is more likely than a breakdown, statistically.
MACD (12, 26, 9): - MACD line: +15.87 (positive — trend still up) - Signal line: +21.63 (above MACD — bearish cross occurred recently) - Histogram: -5.76 (and worsening from -1.08 five days ago)
The MACD bearish cross is a near-term sell signal. However, the MACD line itself remains well positive ($15.87), indicating the underlying trend is still up. The histogram turning negative means momentum is fading, not reversing.
Red Flag — Momentum: RSI dropped 23 points in 5 days + MACD histogram deeply negative. This is the strongest near-term bearish signal in the chart.
5. Moving Average Analysis
| SMA | Value | Price vs. SMA | Status |
|---|---|---|---|
| SMA20 | $666.60 | -2.8% below | Price crossed below — bearish near-term |
| SMA50 | $609.58 | +6.2% above | Strong support, not tested |
| SMA100 | $564.40 | +14.7% above | Distant support |
| SMA200 | $550.14 | +17.7% above | Distant support — uptrend intact |
Interpretation: - All SMAs in bullish order (200 < 100 < 50 < 20 in terms of price levels below current) - Price has crossed below SMA20 — this is a near-term sell signal but not unusual in healthy pullbacks - SMA50 at $609 is the critical line in the sand for the medium-term bullish thesis - A move to test SMA50 would represent a -6% additional decline from current levels
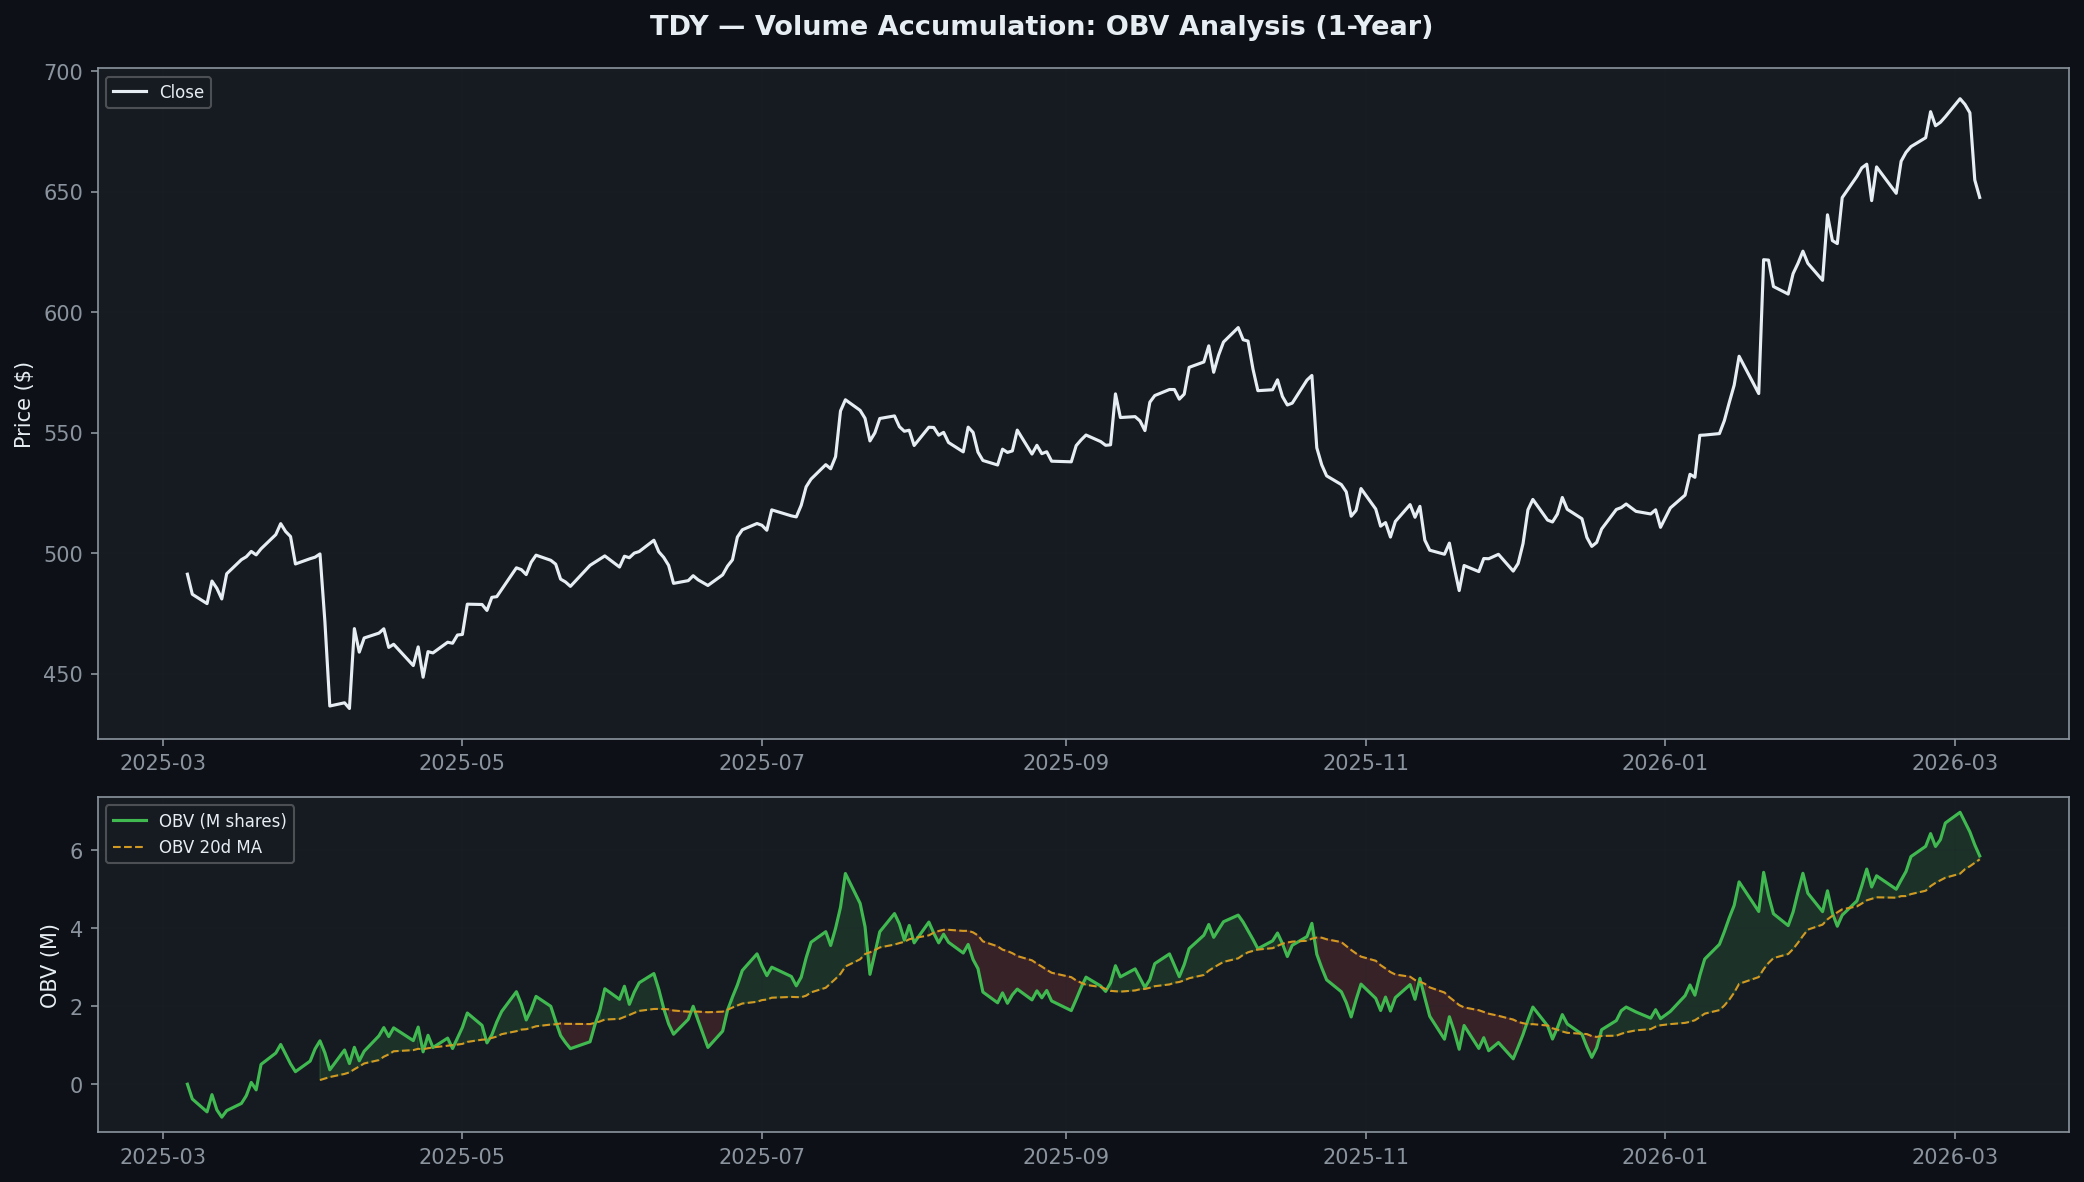
6. Volume Analysis
Volume trend: - Latest volume: 282,500 (0.90x 20-day average) - 20-day average: 315,535 - 50-day average: 366,360
Volume has been declining on a 50-day basis — this is typical in a stock that has already moved up significantly. The pullback volume (last 2-3 sessions) was below average, which is a mild positive — suggesting the selling is not panic-driven.
OBV (On-Balance Volume): - Current OBV: 32.6M - 20-day OBV average: 32.5M - OBV is ABOVE its 20-day average — positive signal
Despite the price pullback, OBV remains above its moving average, indicating that the institutional volume footprint during up days has not been reversed by down-day selling. This supports the "normal pullback" interpretation over "distribution."
A/D Line (estimated): Given OBV stability, the Accumulation/Distribution line likely remains neutral to positive.
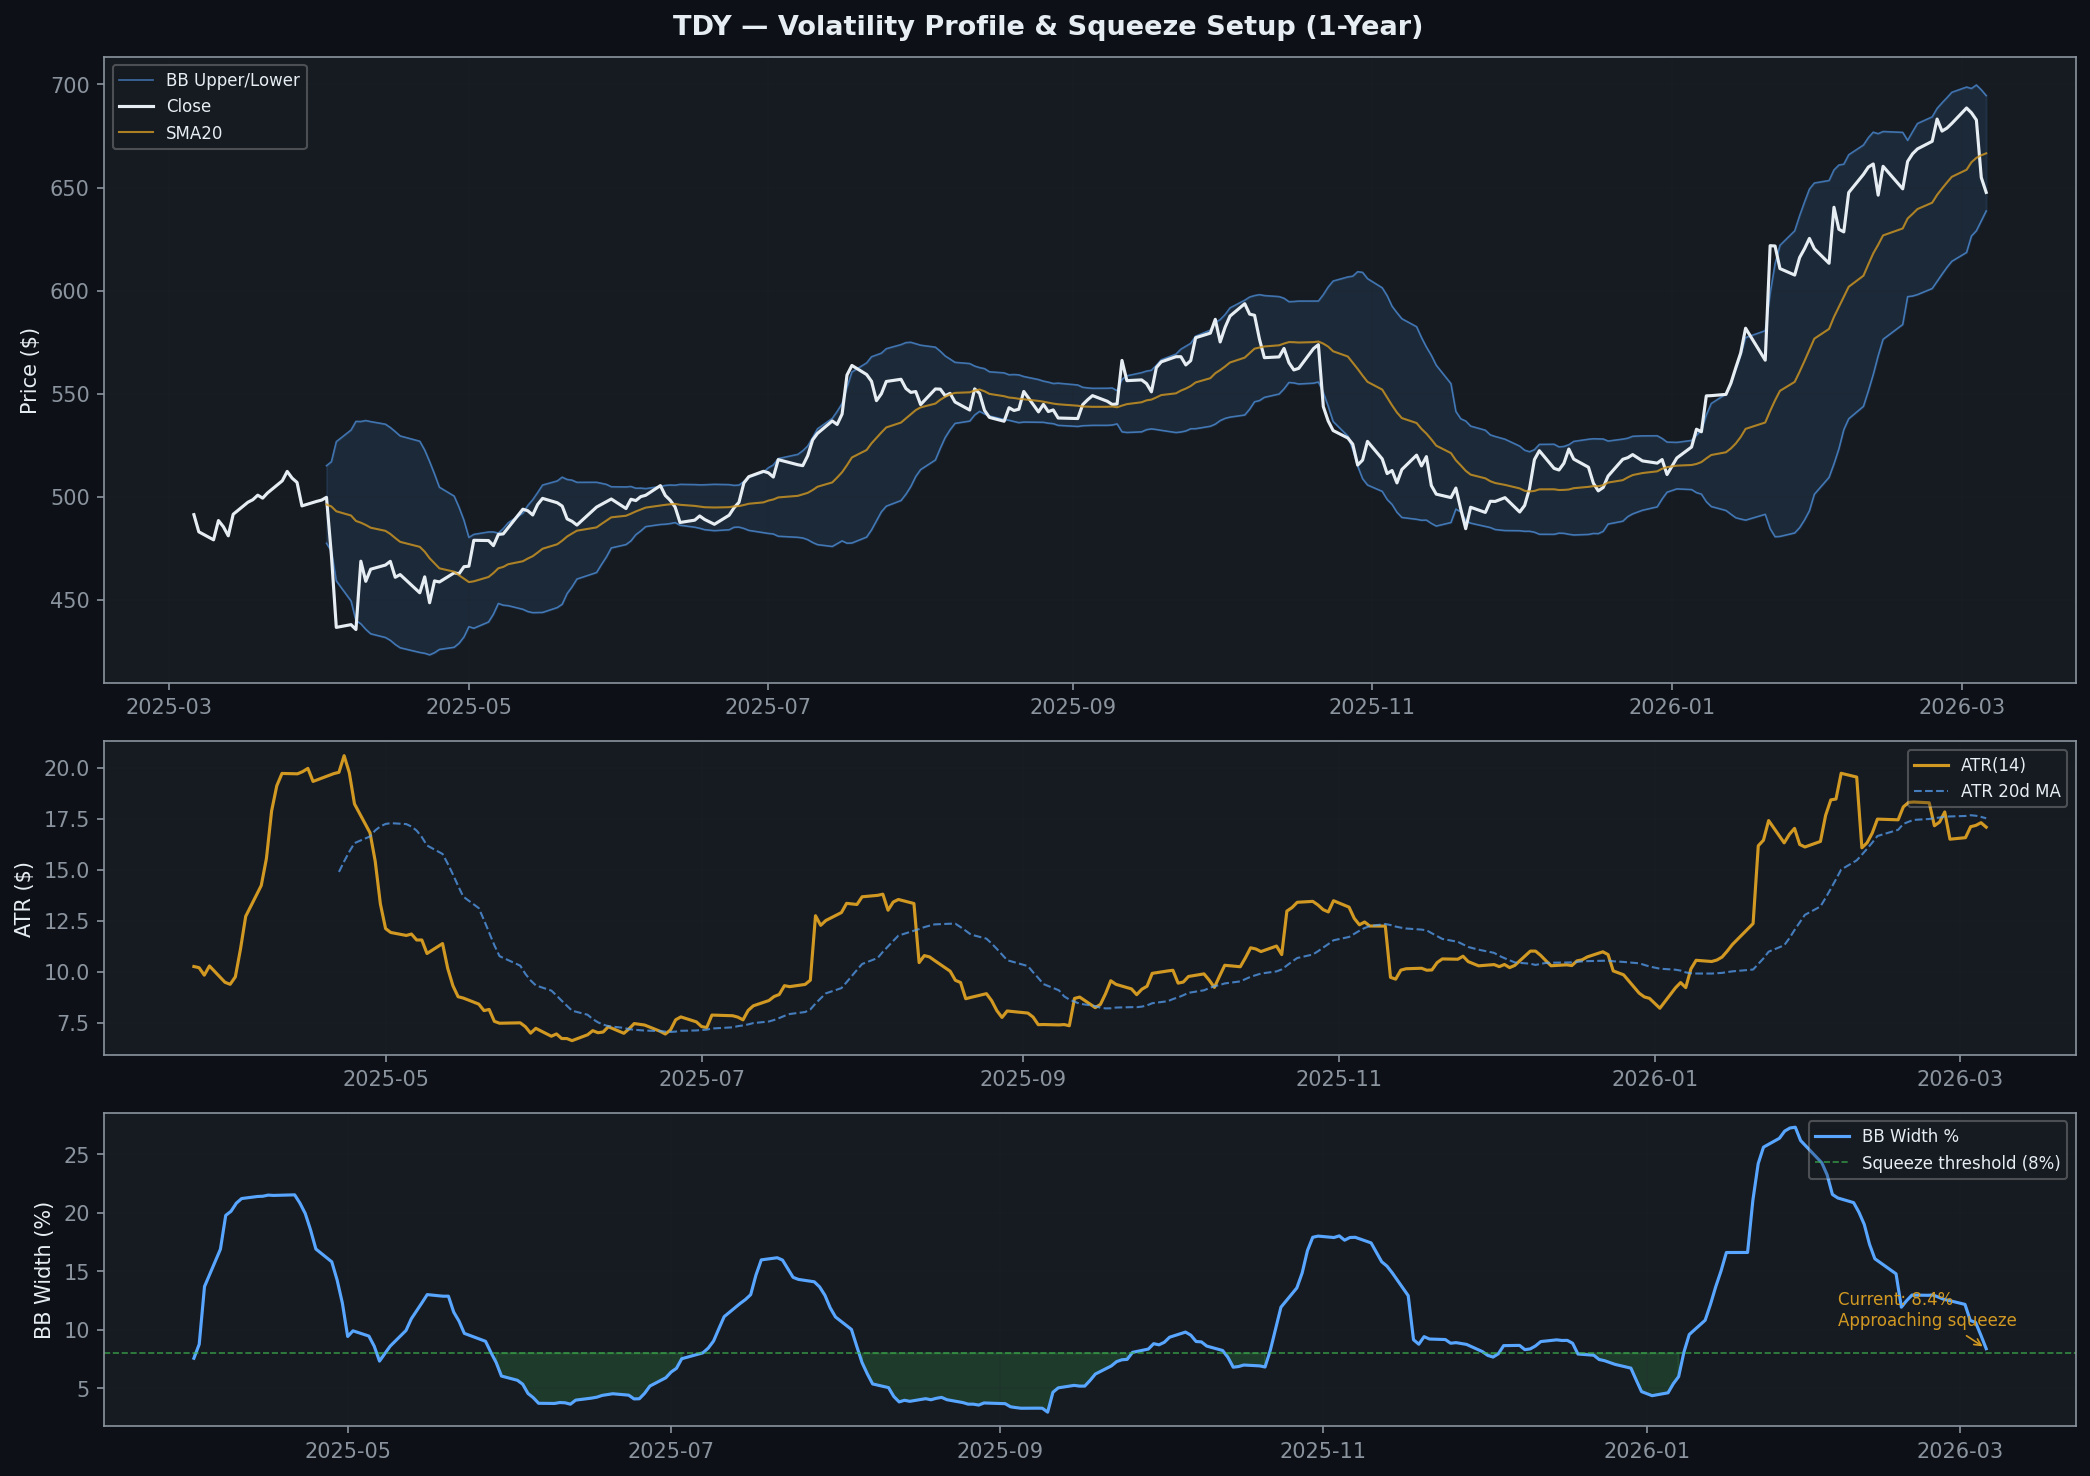
7. Volatility Profile
ATR (14-day): $17.09 (2.6% of current price) Bollinger Bands (20-day, 2 std dev): - Upper: $694.59 - Middle (SMA20): $666.60 - Lower: $638.61 - %B: 0.16 (in lower portion of band — oversold within the BB context) - BB Width: 8.4%
The BB Width of 8.4% is in the moderate range. At the peak of the expansion (when the stock ran from $580 to $693), BB Width was likely 12-15%. The current contraction to 8.4% is the beginning of a squeeze formation. For a fully developed TTM Squeeze signal to fire, BB Width would need to contract further to ~5-6% and be confirmed by Keltner Channel compression.
The %B of 0.16 (stock at 16th percentile of its 20-day BB) indicates the stock is currently "oversold" relative to its recent BB range — potentially setting up a bounce.
8. Entry Point Assessment
Scenario A — Bounce from Current Levels ($634-650) - The 78.6% Fib retracement at $634.66 combined with the lower Bollinger Band at $638.61 creates a confluence support zone - If RSI bounces from 43 to 55+ and price reclaims SMA20 ($666), this would confirm the pullback is over - Entry: $638-650 zone, stop below $620 (earnings gap low) - Target: $693-720 initial - R:R: ($693-645) / ($645-615) = 48/30 = 1.6:1 (marginal)
Scenario B — Wait for Squeeze Setup ($620-640 zone) - Allow the stock to fully test the earnings gap zone ($607-621), reset RSI to 35-40, and then consolidate for 2-3 weeks - Entry: $620-635 after RSI reset and BB squeeze forming - Target: $720-750 (squeeze breakout extension) - R:R: ($720-630) / ($630-595) = 90/35 = 2.6:1 (better)
Preferred Entry: Scenario B — The squeeze signal the user is looking for requires this lower entry zone.
9. Risk/Reward Framework
Scenario 1 (Current entry, $648): - Entry: $648 - Stop: $619 (below earnings gap low, -4.5%) - Target 1: $693 (52-week high, +6.9%) - Target 2: $750 (projection based on earnings gap magnitude, +15.7%) - R:R to T1: 1.6:1 — below ideal threshold
Scenario 2 (Ideal squeeze entry, $628): - Entry: $628 - Stop: $595 (below SMA50 zone, -5.3%) - Target 1: $693 (52-week high recovery, +10.3%) - Target 2: $750 (new high extension, +19.4%) - R:R to T1: 1.9:1 | R:R to T2: 3.7:1 — acceptable to strong
Recommended framework: Wait for Scenario 2 setup. The squeeze signal requires patience.
10. Key Levels Summary
| Level | Price | Type | Notes |
|---|---|---|---|
| 52-week high | $693.38 | Resistance | Recent peak; first target |
| SMA20 | $666.60 | Resistance | Price crossed below; must reclaim |
| Current | $647.64 | — | Near lower BB, 78.6% Fib |
| 78.6% Fib / Lower BB | $634-638 | Support | Confluence zone; key battle |
| Earnings gap zone | $607-621 | Support | Strong structural support |
| SMA50 | $609.58 | Support | Would cap any deep correction |
| 61.8% Fib | $588.57 | Support | Extreme case only |
11. Overall Technical Score
| Component | Score | Weight | Contribution |
|---|---|---|---|
| Trend Alignment | 7.5/10 | 25% | 1.88 |
| Momentum | 2.0/10 | 25% | 0.50 |
| Volume Confirmation | 5.5/10 | 20% | 1.10 |
| Volatility Profile | 6.0/10 | 15% | 0.90 |
| Market Structure | 7.0/10 | 15% | 1.05 |
| TOTAL | 5.4/10 | 100% | 5.43 |
The low overall score (5.4) reflects the current pullback timing — momentum is weak and the stock is in a near-term drawdown. However, the structural scores (trend, market structure) are strong at 7.0-7.5, confirming the medium-term bullish picture is intact.
12. Limitations
- OHLCV data through March 5, 2026 only — most recent session available. Market has presumably continued moving since the data snapshot.
- No intraday data — all analysis is daily close-to-close; intraday levels may differ.
- Squeeze signal assessment is provisional — a true Keltner Channel / TTM Squeeze calculation requires Keltner Channel data (using ATR, not standard deviation) which requires more precise calculation than performed here.
- No sector comparison — technical analysis performed on TDY in isolation; relative strength vs. XAR (aerospace ETF) not calculated.
- Wyckoff phase is interpretive — the distribution vs. normal pullback question cannot be definitively answered until price confirms direction.
Data Source Log
| Source | Endpoint / Query | Status | Timestamp | Notes |
|---|---|---|---|---|
| OHLCV | /signals/data-samples/ohlcv/TDY.csv | OK | 2026-03-08 | 2,055 rows, through Mar 5, 2026 |
| Python | /tmp/tdy_technical.py | OK | 2026-03-08 | All indicators computed via pandas/numpy |
| WebSearch | "TDY stock price technical 52 week" | OK | 2026-03-08 | Cross-validation |
Charts