TDY
Conviction 4TDY -- Combined Deep Dive Assessment
Date: 2026-03-08 Asset Class: Equity Ticker: TDY (Teledyne Technologies Incorporated)
Fundamental Summary
| Metric | Value |
|---|---|
| Overall Score | 70.2/100 |
| Verdict | GO |
| Red Flags | 1 HIGH, 4 MEDIUM |
The Market Analyst scored TDY at 70.2/100 with a GO verdict. Key strengths: best operating margins in peer group (22.6% non-GAAP), FCF >$1B second consecutive year, Q4 2025 beat by 8.1%, and Iran conflict demand pull direct to Black Hornet/GAVIA/ISR sensor portfolio. Key risks: 30-50% valuation premium to peer median at 27x forward P/E, stock within 6% of 52-week high after +56% rally, and no insider buying.
Full fundamental synthesis: analysis/fundamentals/TDY-synthesis.md Supporting modules: analysis/fundamentals/TDY-*.md
Technical Summary
| Metric | Value |
|---|---|
| Overall Score | 5.4/10 |
| Bias | Neutral (short-term Bearish, medium-term Bullish) |
| Red Flags | 1 HIGH |
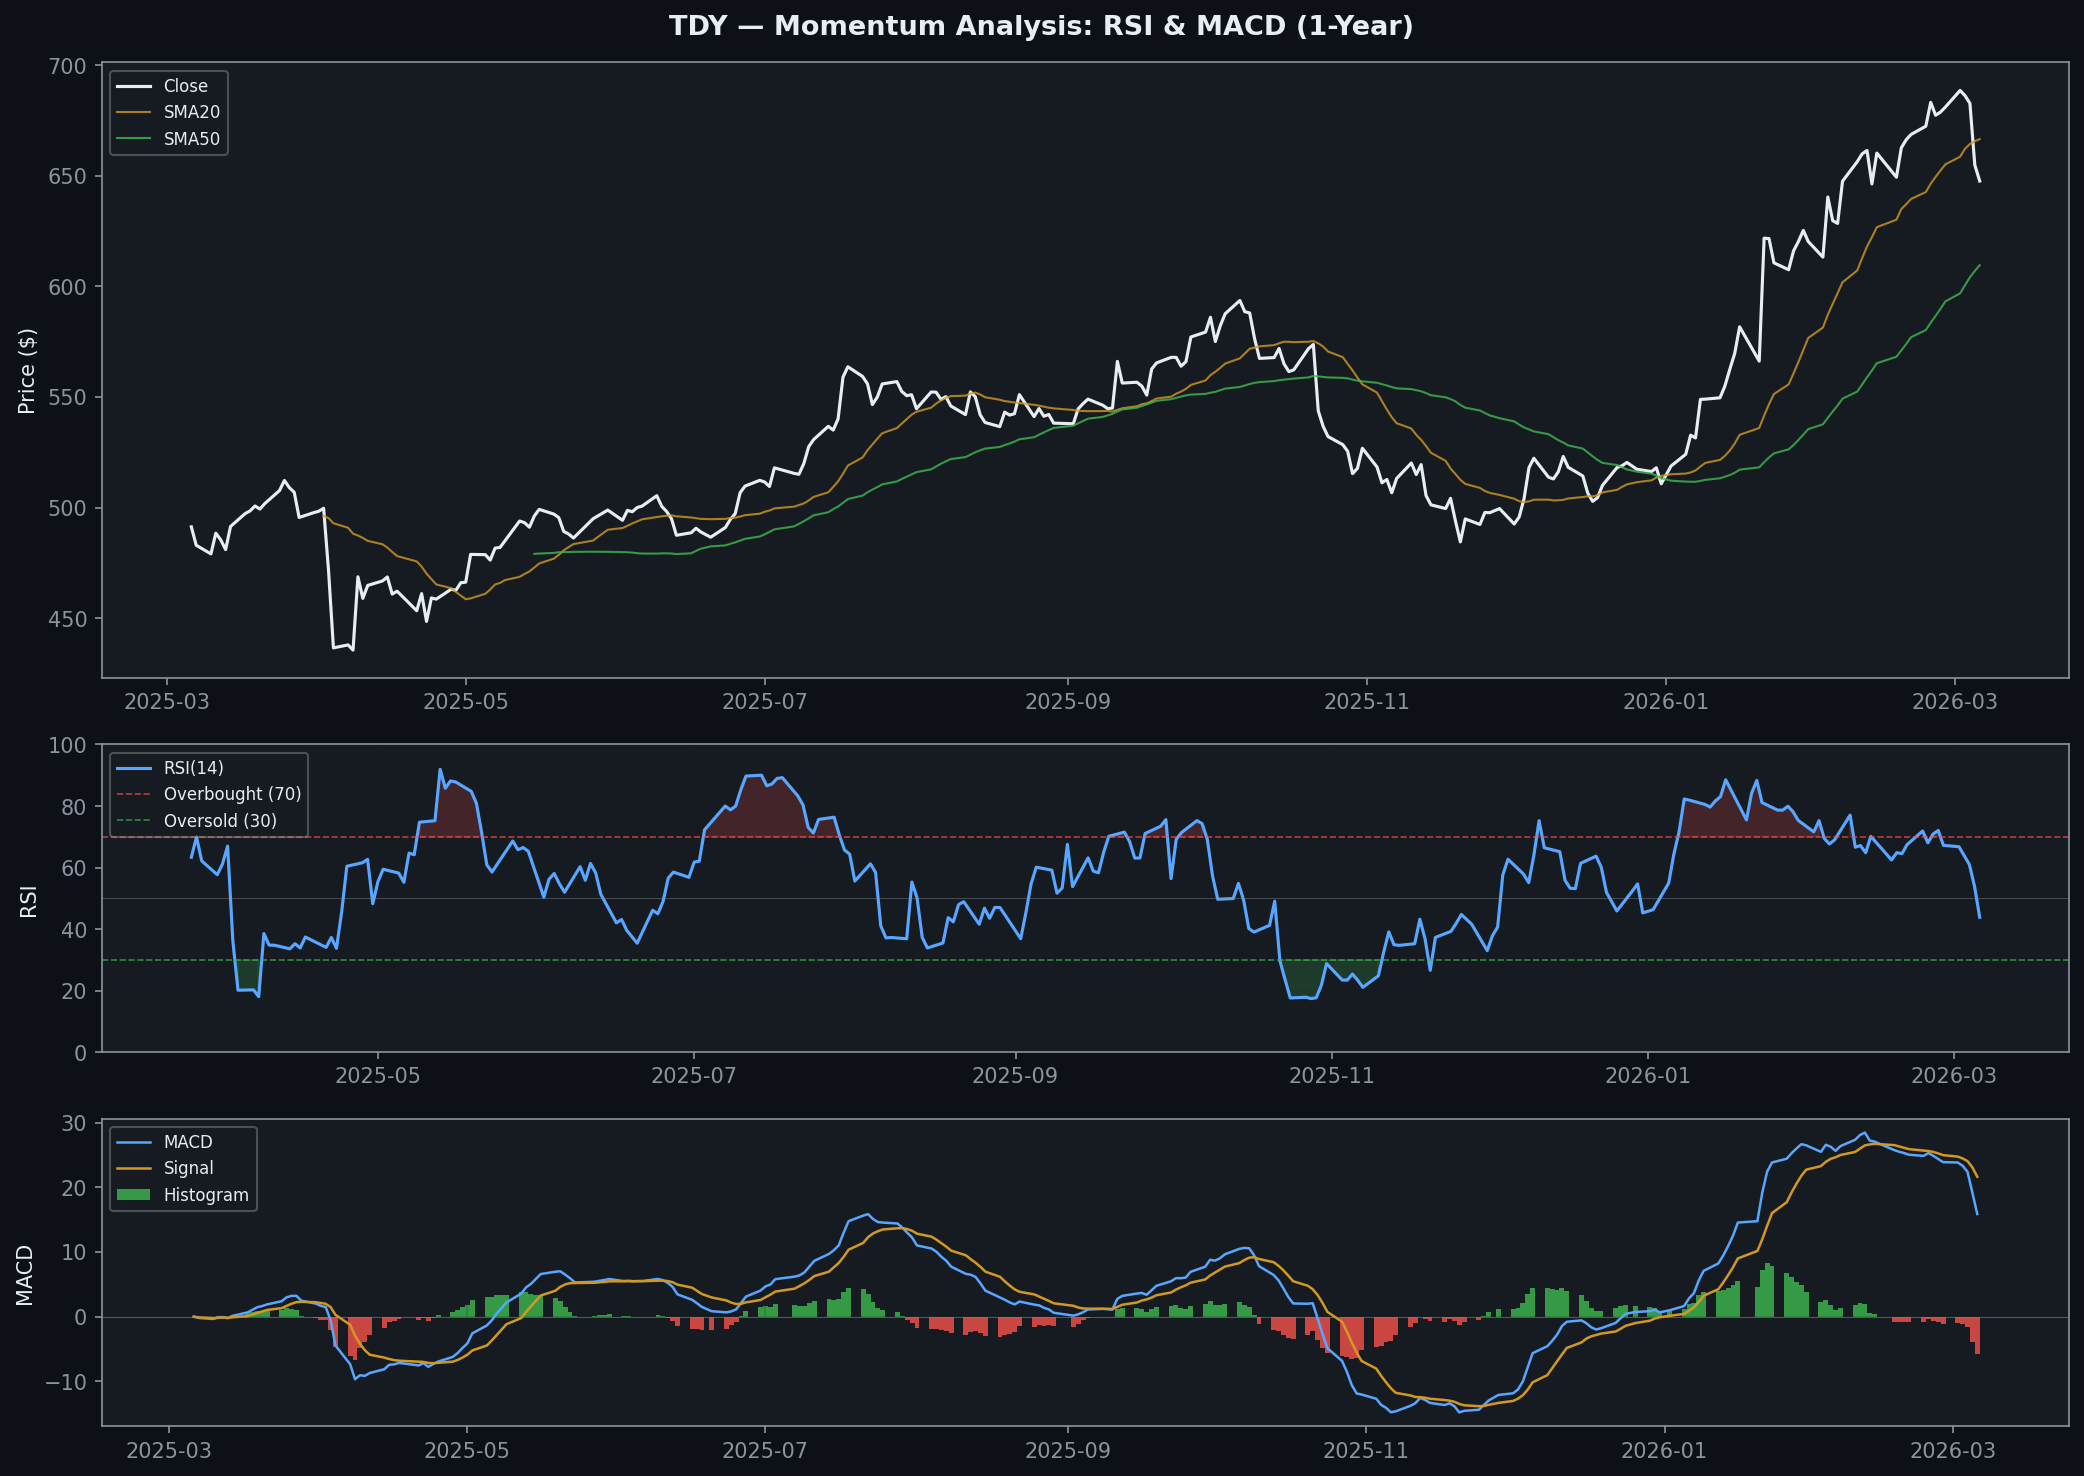
The Quant Researcher scored TDY at 5.4/10 with a Neutral bias. Trend alignment is strong (7.5/10) -- uptrend firmly intact with price 17.7% above SMA200 and 6.2% above SMA50 -- but price has crossed below SMA20 for the first time since the November lows. Momentum has deteriorated sharply (2.0/10) -- RSI dropped from 67.2 to 43.8 in 5 days, MACD histogram deeply negative at -5.76, distribution pattern in progress. One HIGH red flag: RSI dropped 23 points in 5 days with deeply negative MACD histogram.
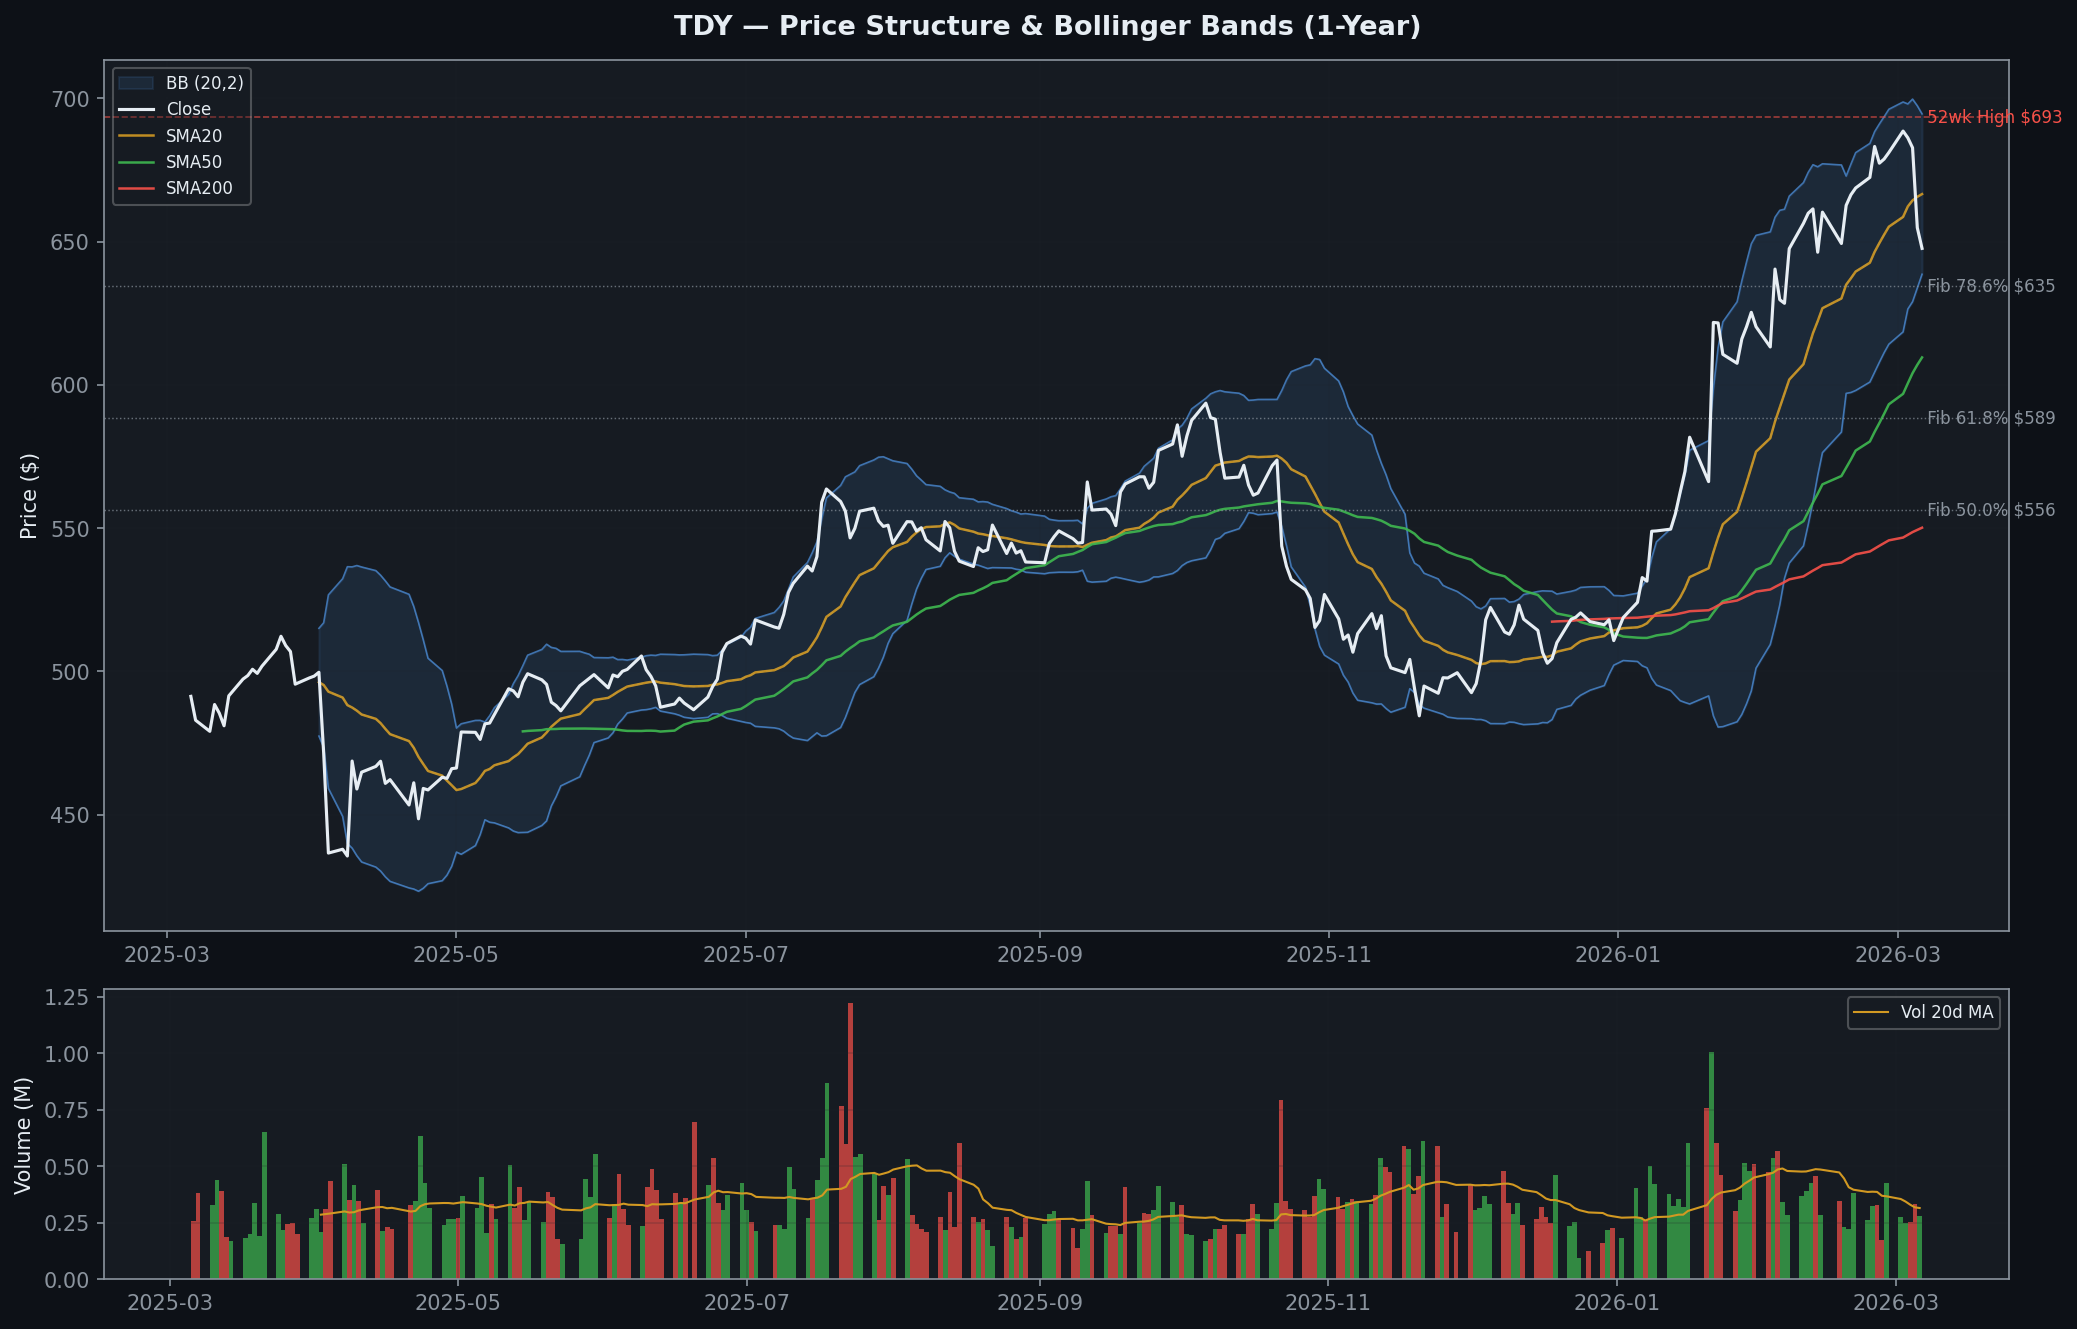
Key levels: Support $634.66 (78.6% Fib / lower BB); Resistance $693.38 (52-week high).
Full technical report: analysis/quant-research/TDY-technical-2026-03-08.md
PARTIAL AGREEMENT Assessment
Fundamental-Technical Alignment: PARTIAL -- Directionally aligned, timing diverges.
Both views say the same thing about direction: the medium-term bull thesis is intact. But they diverge on timing:
- Fundamental verdict: GO (score 70.2) but notes limited margin of safety at $655
- Technical verdict: Uptrend intact (trend score 7.5/10) but momentum deteriorating (momentum score 2.0/10) and RSI in the 43-range suggesting the stock is in a short-term pullback not yet at an attractive entry
Specific points of agreement:
- Medium-term bull thesis supported: Fundamentals (82/100 earnings, 85/100 catalysts) and technicals (SMA50 $609, SMA200 $550 both intact) both say this is a trending stock in a favorable sector.
- Valuation/price stretched: Fundamentals give valuation 48/100; technicals show stock printing below SMA20 near the 78.6% Fibonacci level.
- Ideal entry zone $607-640: Fundamentals thesis specifies "ideal entry zone $620-640"; technicals show earnings gap zone $607-621 as strongest support.
- Don't buy at $655 -- wait for the setup.
Specific point of disagreement:
- The fundamental analysis is less concerned about the short-term momentum collapse because the Q4 beat (+8.1%) and Iran conflict demand pull are business-level catalysts; the technical analysis weights momentum at 25% and the RSI collapse to 43.8 is the most negative near-term signal in the chart.
Conviction Score
| Input | Value | Rationale |
|---|---|---|
| Agreement | 0.6 | Partial -- directional alignment, timing divergence |
| Catalysts | 0.9 | Dense -- active conflict, Q1 earnings, Oceanology, MOU demos |
| Data Quality | 0.9 | Large-cap, full Q4 2025 disclosure, widely covered |
| Risk/Reward | 0.65 | Current $648 entry: ~2-3:1 R:R; ideal entry: 3.7:1 |
| Red Flags | 0.7 | All structural/disclosed -- no hidden deterioration |
Result: Conviction 4 (Above Average) -- Weighted Score 74.0/100 -- Position Sizing 75% of target
Actionable Framework
Position Type: WATCH / Conditional Entry (not immediate entry)
The combined assessment recommends WATCHING, not immediate entry at current levels. Both fundamental and technical analysis converge on patience being rewarded here.
Entry Zone A -- Aggressive (current price range)
| Parameter | Value |
|---|---|
| Entry | $634 - $650 (78.6% Fib / lower Bollinger Band zone) |
| Stop | $615 (below Q4 earnings gap low; -2.8% below lower entry) |
| Target 1 | $693 (52-week high recovery; +6.6% from $650 entry) |
| Target 2 | $720 (next measured move; +10.8% from $650 entry) |
| R:R to T1 | 1.9:1 (marginal -- acceptable minimum) |
| R:R to T2 | 2.9:1 (acceptable) |
| Condition | RSI stops declining and reverses above 45 + price holds $634 |
Entry Zone B -- Preferred (squeeze setup; ~2-4 weeks from now)
| Parameter | Value |
|---|---|
| Entry | $620 - $635 (post-Q4 earnings gap zone; SMA50 approaching) |
| Stop | $595 (below SMA50 at $609; -5.3% from $628 entry) |
| Target 1 | $693 (52-week high; +10.3% from $628) |
| Target 2 | $750 (squeeze extension target; +19.4% from $628) |
| Target 3 | $780 (bull case target; +24.2% from $628) |
| R:R to T1 | 1.9:1 |
| R:R to T2 | 3.7:1 (strong) |
| R:R to T3 | 4.6:1 (excellent) |
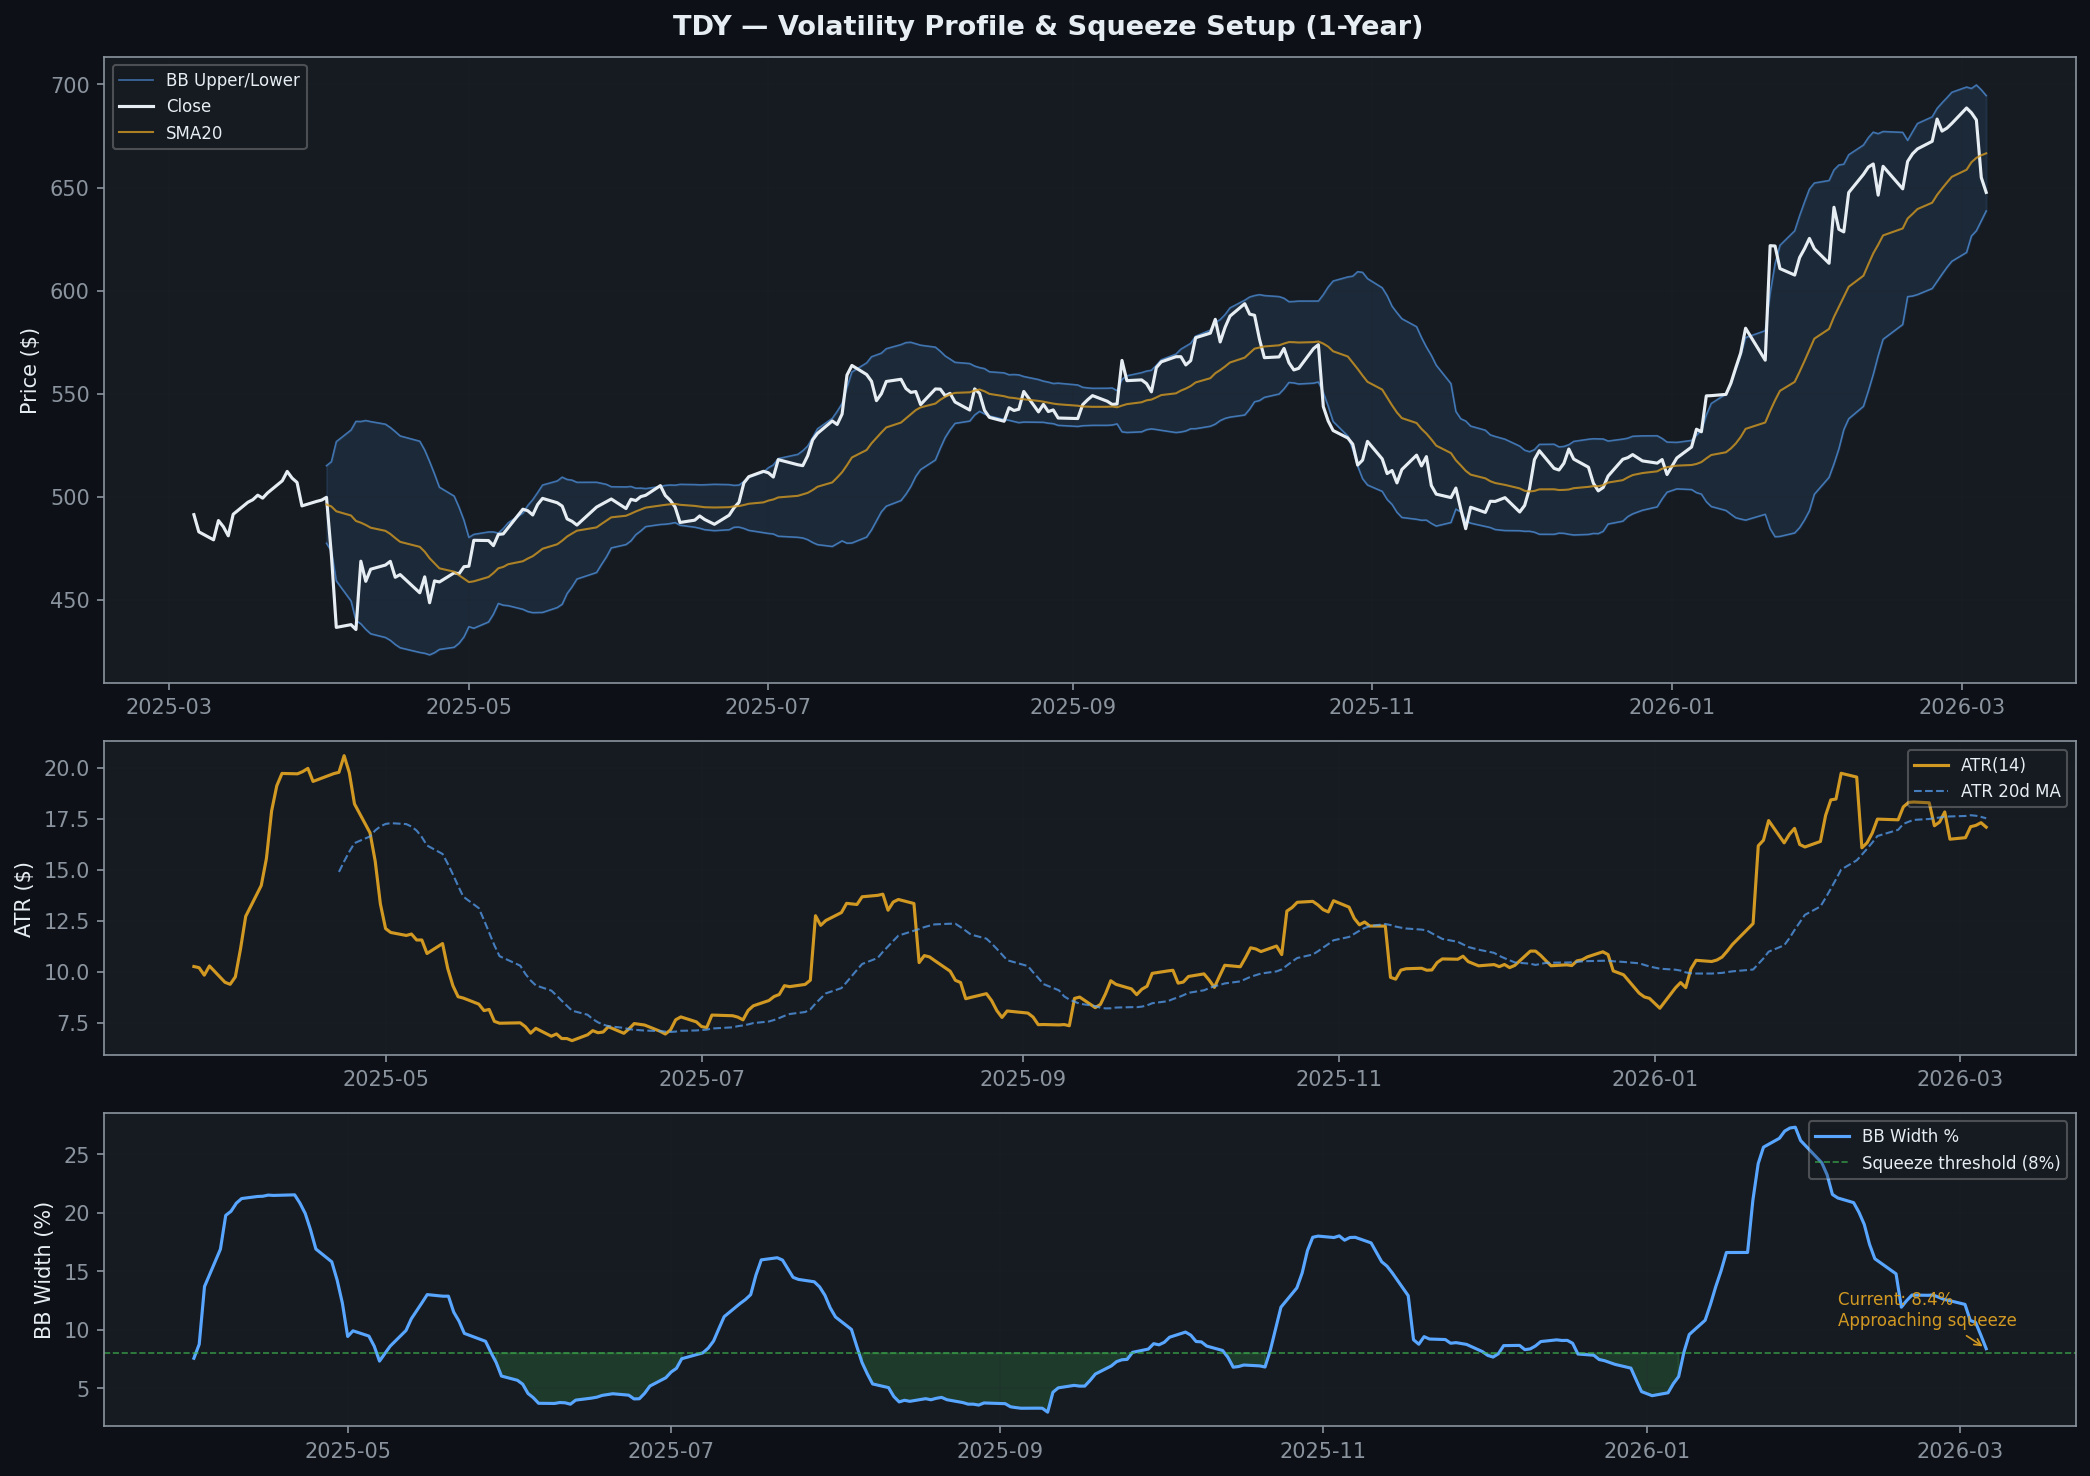
| Condition | Price retraces to $620-635, RSI resets to 35-42, BB Width contracts to <7%, price holds $620 for 2+ sessions, then breakout |
Position Sizing: 75% of target allocation (conviction score 4/5) - If using Entry Zone A: start with 50% of position, add remaining 25% on confirmation of RSI reversal above 50 - If using Entry Zone B (preferred): full 75% at entry on squeeze signal
Key Monitoring Triggers
Bull Confirmation (increase conviction / add)
- Q1 2026 earnings beat >5% + FY guidance raised
- Defense budget passed (not just CR) at >$900B
- Price reclaims SMA20 ($666+) on above-average volume
- Additional defense contract >$50M announced
- Iran conflict persists; procurement orders cited in next earnings call
Bear Invalidation (reduce / exit)
- Price breaks below $595 (below SMA50) on high volume -- exit entire position
- Q1 2026 guidance cut or miss >3% -- reassess fundamentals
- Iran conflict rapid de-escalation or ceasefire -- reduce on pop
- DOGE contract terminations specifically naming TDY programs -- reassess
- Bollinger Width fails to contract (no squeeze forming after 4 weeks) -- reconsider timing thesis
Hold Signal
- Stock consolidates $620-665 for 2-4 weeks with declining volume and BB Width contracting -- this is exactly the squeeze setup forming; hold the watch
Limitations
- Data lag: OHLCV data through March 5, 2026 (3 days old as of analysis date). Actual current price may differ from $647.64 used in technical analysis.
- No yfinance API access: All financial data sourced via WebSearch. Institutional ownership, short interest, and balance sheet figures rely on secondary sources.
- Squeeze signal incomplete: True TTM Squeeze requires Keltner Channel data. Bollinger Width proxy used as approximation -- actual squeeze signal requires real-time charting platform (TradingView) confirmation.
- Geopolitical uncertainty: The Iran conflict premium is difficult to quantify and may fade faster than expected. The base case assumes 20-60 day effect per quant research empirical findings.
- No quant backtesting of entry timing: The ideal entry zone is based on technical pattern recognition, not backtested signal performance for TDY.
Charts