PLTR — Technical Summary
Conviction 4PLTR -- Technical Deep Dive
===========================================================
  PLTR -- Technical Analysis                   2026-03-02
  Asset Class: Equity
  Price: $146.57  |  52wk: $126.23 - $207.52
===========================================================

  OVERALL SCORE: 5.5/10       BIAS: Neutral

  COMPONENT SCORES
  -----------------------------------------------------------
  Trend Alignment         4.5/10  wt 25%  Death cross, below major MAs
  Momentum                7.5/10  wt 20%  RSI surging, MACD bullish crossover
  Volume Confirmation     6.0/10  wt 20%  OBV rising, A/D divergence
  Volatility Profile      4.0/10  wt 15%  ATR 4.6%, fat-tailed returns
  Market Structure        5.5/10  wt 20%  Wyckoff Spring in progress

  KEY LEVELS
  -----------------------------------------------------------
  Resistance 2:  $160.25   SMA50/SMA200 death cross cluster
  Resistance 1:  $153.27   EMA 50, near-term overhead supply
  Current Price: $146.57
  Support 1:     $135.00   Consolidation zone mid-point
  Support 2:     $126.23   52-week low (double-tested)

  RED FLAGS                                    (2 found)
  -----------------------------------------------------------
  MEDIUM  Elevated daily ATR of 4.6%           [Volatility]
  MEDIUM  Excess kurtosis of 6.0 (fat tails)   [Volatility]

===========================================================
2. Executive Summary
PLTR scores 5.5/10 with a Neutral bias, reflecting a stock caught between a deteriorating intermediate trend and a powerful short-term reversal off deeply oversold conditions. The stock has declined 29.4% from its November 2025 all-time high of $207.52 to a current price of $146.57, but is rallying sharply off its February 2026 low of $126.23. A death cross (SMA 50 crossing below SMA 200) formed just three trading days ago on February 27, confirming the intermediate downtrend.
However, the Wyckoff analysis identifies a compelling Spring pattern: the Feb 13 low at $126.23 and the Feb 24 retest at $126.37 occurred on diminishing volume, followed by today's 6.8% surge to $146.57 with high conviction (0.88 body-to-range ratio). This Spring/Sign of Strength sequence is a classically bullish reversal setup, but it remains unconfirmed until price reclaims the $147-$153 zone and holds above it.
The core tension is between the bearish trend structure (death cross, below SMA 50/100/200) and the bullish momentum/Wyckoff reversal. This conflict is why the overall score sits at neutral. Patience for confirmation before committing capital is warranted.
3. Price Structure
52-Week Range
| Metric | Value |
|---|---|
| 52-Week High | $207.52 (Nov 3, 2025) |
| 52-Week Low | $126.23 (Feb 13, 2026) |
| Current Price | $146.57 |
| Range Position | 25.0% (lower quartile) |
| Distance from High | -29.4% |
| Distance from Low | +16.1% |
Recent Performance
| Period | Return |
|---|---|
| 1 Week | +12.2% |
| 2 Weeks | +11.5% |
| 1 Month | -3.5% |
| 3 Months | -11.6% |
| 6 Months | -7.3% |
| 1 Year | +72.9% |
The short-term performance (+12.2% in one week) contrasts starkly with the intermediate-term losses (-11.6% over 3 months, -7.3% over 6 months). This divergence is characteristic of a counter-trend rally within a correction, or alternatively, the early stages of a trend reversal. The 1-year return of +72.9% indicates the broader secular uptrend remains intact despite the recent correction.
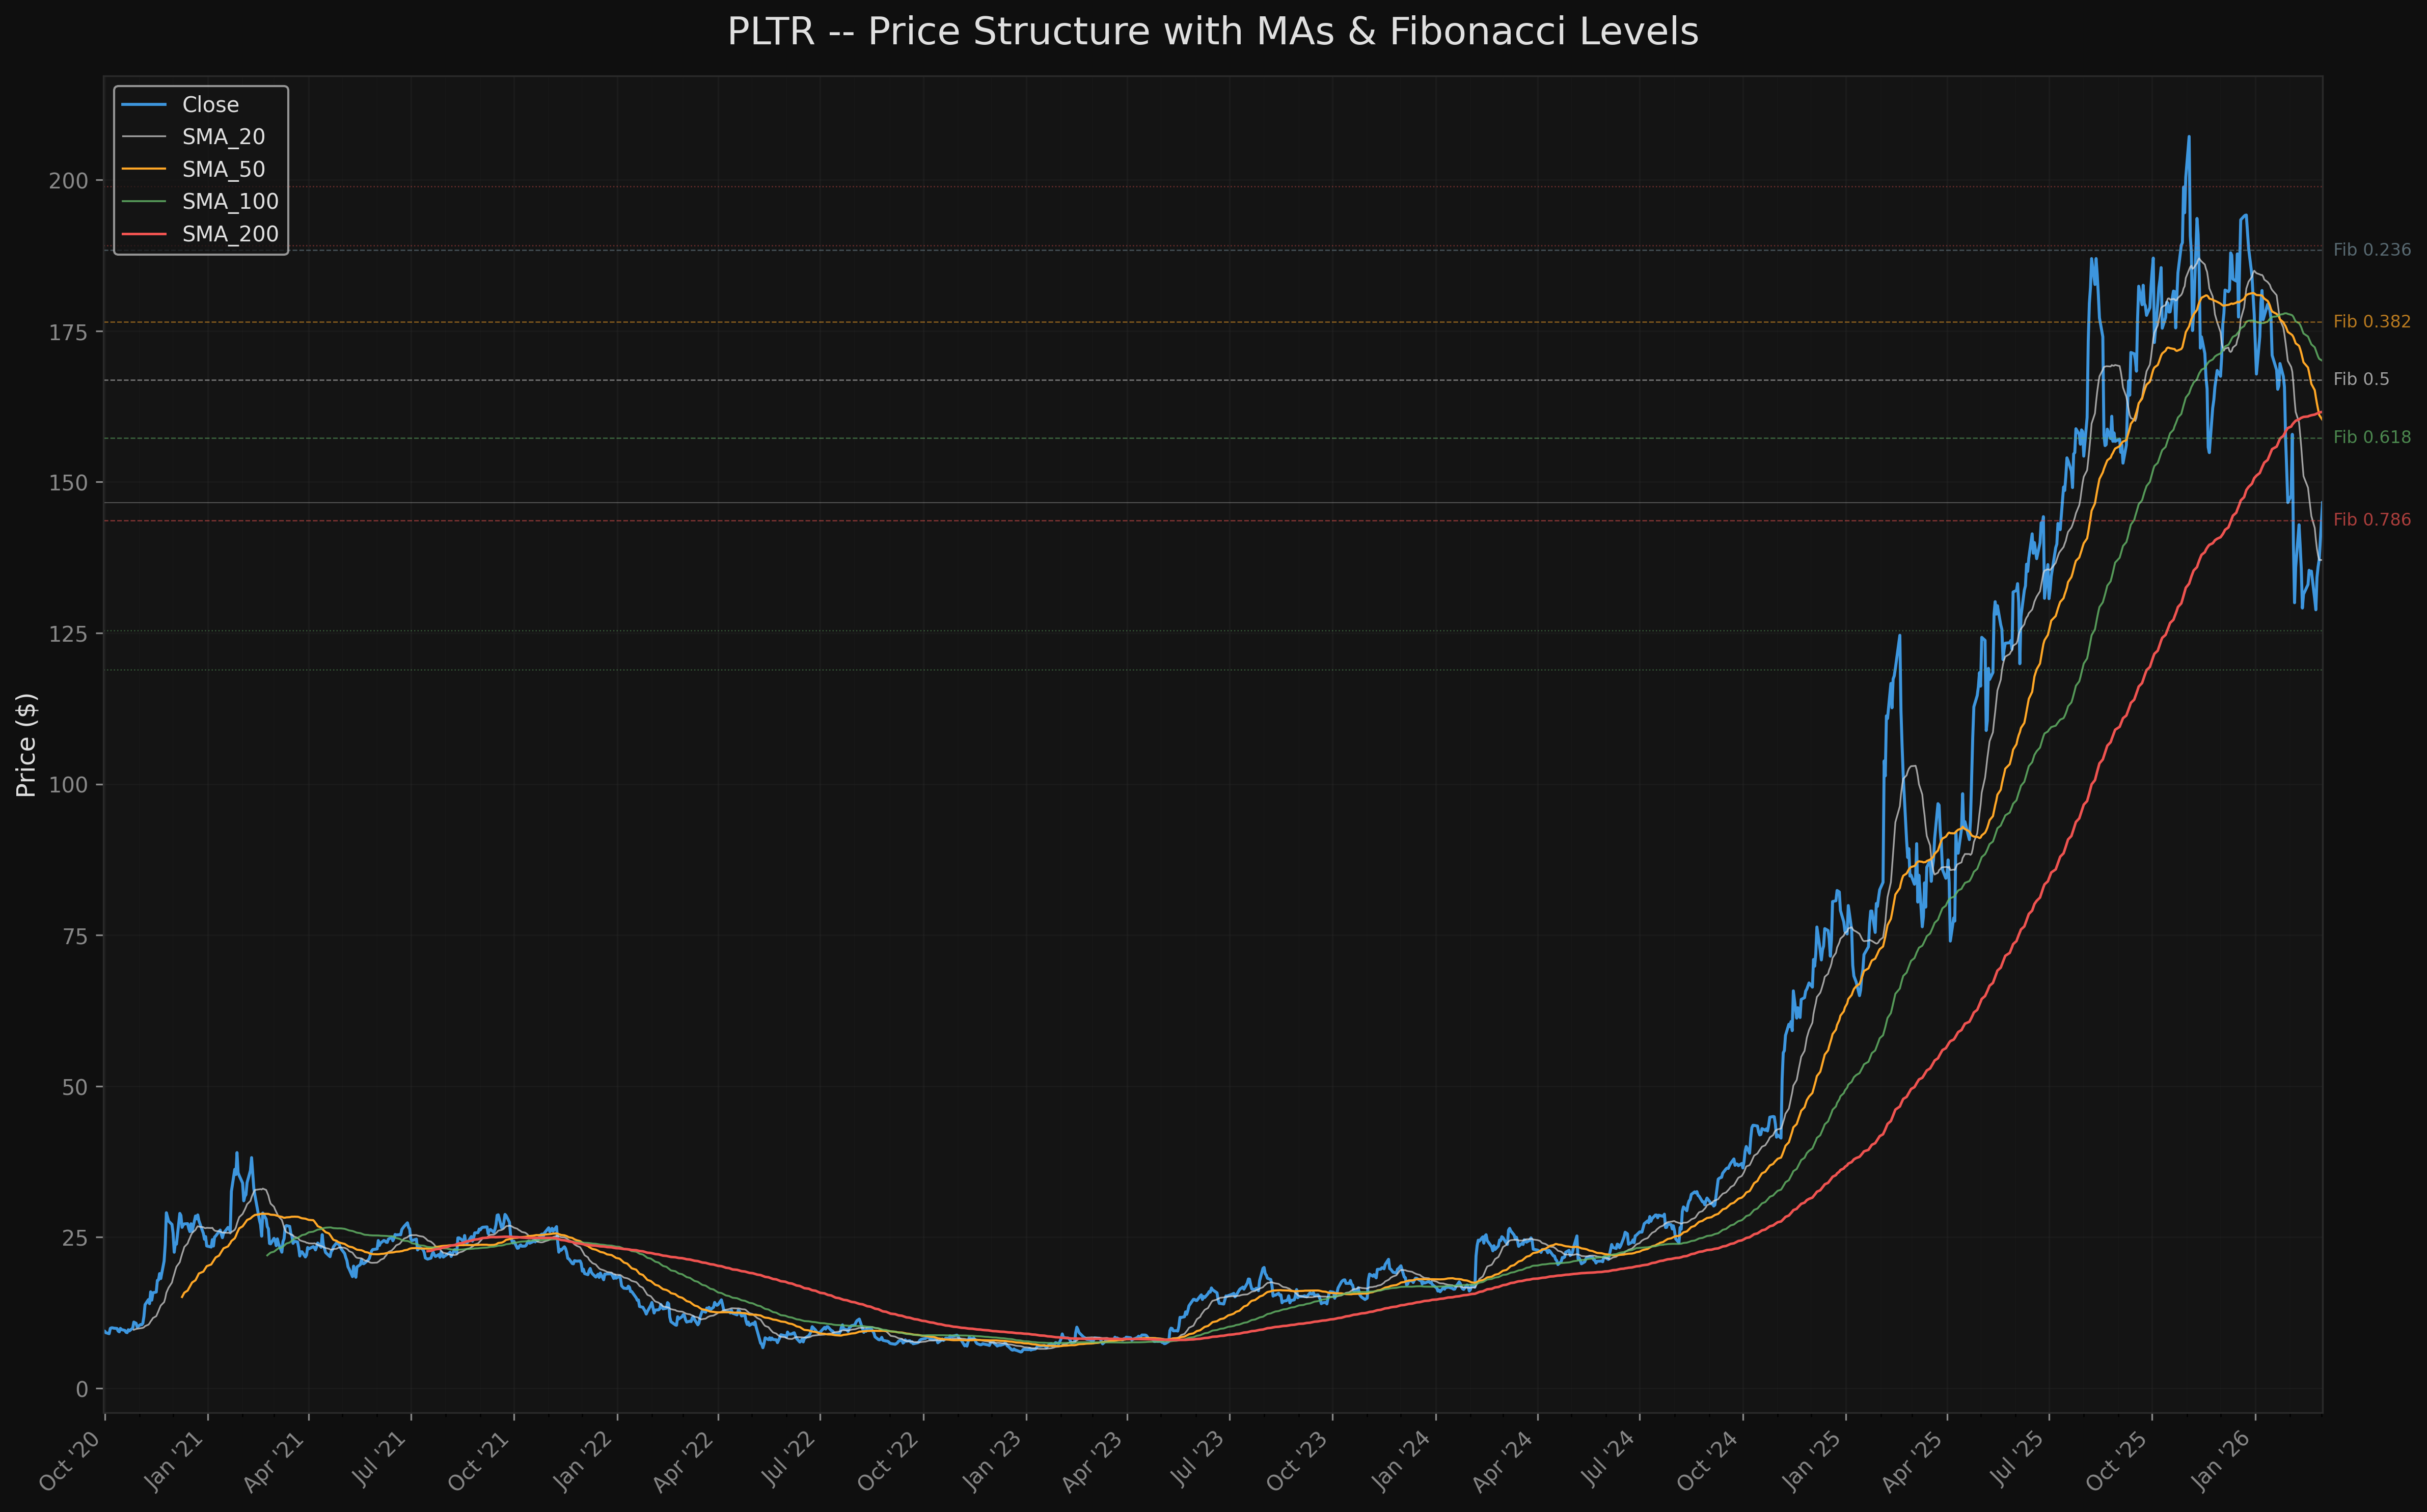
Fibonacci Retracement Levels (52-Week High to Low)
| Level | Price | Status |
|---|---|---|
| 1.000 (High) | $207.52 | Distant resistance |
| 0.786 | $190.16 | Upper resistance |
| 0.618 | $176.47 | Major resistance |
| 0.500 | $166.88 | Key mid-point |
| 0.382 | $157.28 | First major retracement target |
| 0.236 | $145.42 | Current zone (at this level) |
| 0.000 (Low) | $126.23 | Tested, held |
PLTR closed today at $146.57, just above the 0.236 Fibonacci retracement at $145.42. This is the first level the stock needs to reclaim and hold. A sustained move above $157.28 (0.382) would signal genuine recovery; failure to hold $145 would suggest this bounce is a dead cat rally within the larger correction.
4. Market Structure (Wyckoff Phase Analysis)
Current Phase: Early Re-Accumulation (Post-Spring)
The Wyckoff analysis reveals a textbook distribution-to-accumulation sequence unfolding since late 2025.
Phase A -- Selling Climax (Feb 3-5, 2026): - Feb 4: Price dropped from $155.41 to $139.54 on 113M shares (2.7x the 50-day average of 41M). - Feb 5: Continued to $130.01 on 94M shares. - Combined 2-day decline: -17.7%. Combined volume: 207M shares (5x normal). - This is a textbook selling climax: massive volume on a waterfall decline.
Phase B -- Automatic Rally and Secondary Test (Feb 6-23): - Automatic Rally to $142.91 on Feb 9. - Secondary Test: Feb 12 low at $126.56, Feb 13 low at $126.23. - Range established: $126-$143.
Phase C -- Spring (Feb 24): - Feb 24 low: $126.37, closing at $128.84 on 47M shares. - This low is just $0.14 above the Feb 13 low of $126.23. - Volume on the Spring day (47M) was 50% of the selling climax volume (94M). - Diminishing volume on successive tests of the $126 level is a hallmark of a Wyckoff Spring -- sellers are exhausted.
Phase D -- Sign of Strength (Feb 25 - present): - Five consecutive higher closes from Feb 25 ($134.19) through Mar 2 ($146.57). - Today's 6.8% gap-up rally on 43M shares with a 0.88 body/range ratio is the classic "Sign of Strength" (SOS) move. - The rally has now retraced +16.0% from the Spring low.
Confirmation Needed: - The SOS needs to clear the Phase A resistance at approximately $147.56 (the Nov 21, 2025 swing low that became the "ice" line during distribution). - Today's high of $147.14 approached but did not clear this level. - A close above $150 on elevated volume would confirm the Spring and shift the structure to unambiguously bullish.
Quantitative Evidence
| Metric (120-day) | Value |
|---|---|
| Price return | -9.7% |
| Price slope R-squared | 0.369 |
| Volume trend slope | -51,105 shares/day (declining) |
| ATR compression (1st half vs 2nd half) | -11.5% |
| Metric (60-day) | Value |
|---|---|
| Price return | -16.8% |
| Price slope R-squared | 0.815 (strong downtrend) |
| Volume trend slope | +502,371 shares/day (increasing) |
| ATR compression | +15.4% (expanding) |
The 60-day metrics show a strong, high-R-squared downtrend with expanding volume and ATR -- consistent with the selling climax and subsequent testing. The 120-day metrics show a weaker trend (lower R-squared) with declining volume, consistent with a transition phase.
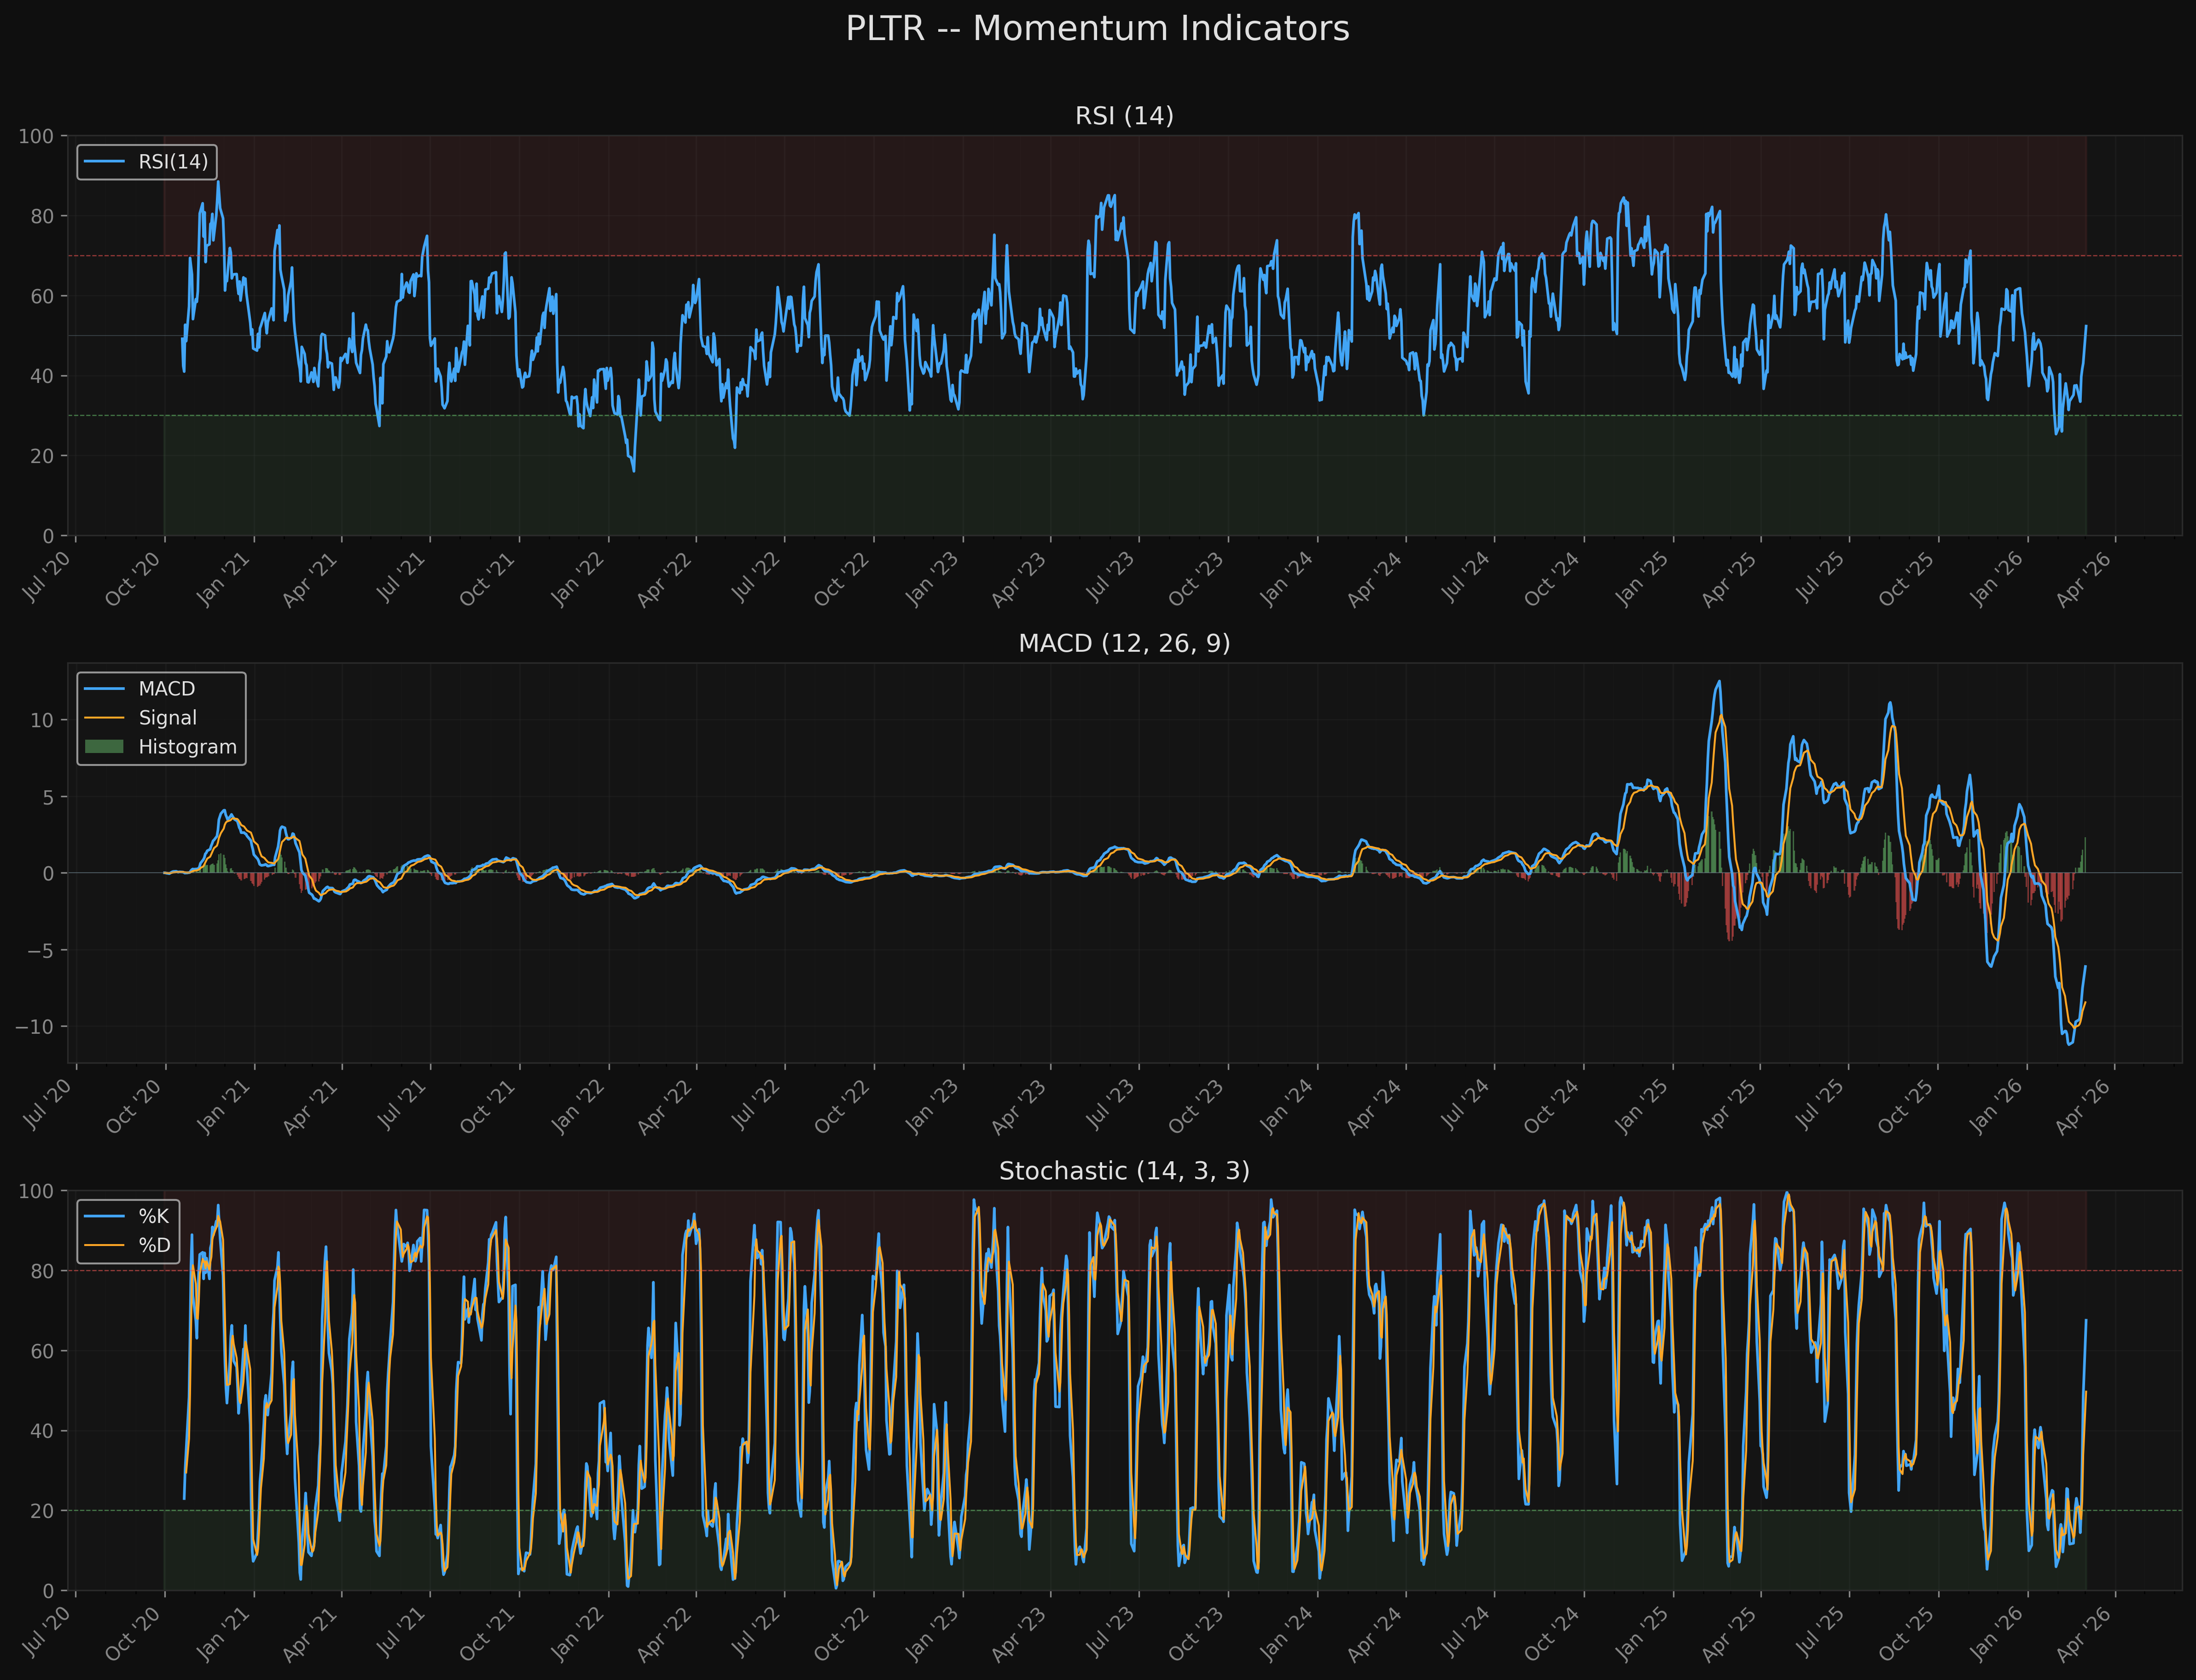
5. Momentum Analysis
RSI (14-period)
| Metric | Value |
|---|---|
| Current RSI | 52.3 |
| RSI 5 days ago | 34.5 |
| 5-day change | +17.8 points |
| Status | Neutral (recovering from oversold) |
The RSI surged from 34.5 (near oversold) to 52.3 in five trading days, a +17.8-point move. This rate of change is notable and indicates strong buying pressure. The RSI is now at the 50 midline, which historically acts as a battleground between bulls and bears. A sustained move above 55-60 would confirm the bullish momentum; failure at 50 would suggest the bounce is fading.
MACD (12, 26, 9)
| Metric | Value |
|---|---|
| MACD Line | -6.12 |
| Signal Line | -8.45 |
| Histogram | +2.34 |
| MACD above Signal | Yes |
| Histogram expanding | Yes |
The MACD generated a bullish crossover (MACD line crossed above the signal line) and the histogram is expanding in bullish territory. However, both lines remain deeply negative, indicating that the intermediate trend is still bearish. The bullish crossover from deeply negative territory is a characteristic of early reversal or counter-trend bounce signals. The MACD needs to approach the zero line from below for a more convincing reversal.
Stochastic Oscillator (14, 3, 3)
| Metric | Value |
|---|---|
| %K | 67.5 |
| %D | 49.7 |
| %K above %D | Yes |
| Status | Bullish crossover, mid-range |
The Stochastic %K has crossed above %D from the lower portion of the range, confirming the short-term bullish momentum. %K at 67.5 has room before reaching overbought territory at 80, suggesting the current rally may have more room to run in the near term.
Momentum Synthesis
All three momentum indicators are aligned bullish in the short term: RSI recovering from oversold, MACD bullish crossover with expanding histogram, and Stochastic bullish crossover. This unanimity supports the Wyckoff Sign of Strength interpretation. The key caveat is that the MACD line remains deeply negative (-6.12), which means the intermediate momentum backdrop is still bearish despite the short-term surge.
6. Moving Average Analysis
Current MA Positioning
| MA | Value | Price vs MA | Slope (20d) |
|---|---|---|---|
| SMA 10 | $135.19 | +8.4% above | -17.0% |
| SMA 20 | $137.08 | +6.9% above | -19.4% |
| SMA 50 | $160.25 | -8.5% below | -8.3% |
| SMA 100 | $170.04 | -13.8% below | -4.4% |
| SMA 200 | $161.59 | -9.3% below | +1.7% |
| EMA 50 | $153.27 | -4.4% below | -- |
| EMA 200 | $151.43 | -3.2% below | -- |
Key Cross Events
- Death Cross formed Feb 27, 2026: SMA 50 ($160.25) crossed below SMA 200 ($161.59). This is a widely-watched bearish signal. The previous Golden Cross occurred on April 5, 2023 and held for nearly three years during PLTR's massive secular rally.
- The death cross is very recent (3 trading days ago) and the spread is narrow ($1.34). It could potentially reverse if the rally continues aggressively.
MA Interpretation
PLTR is currently below all major moving averages except the short-term SMA 10 and SMA 20. The stock's position relative to MAs paints a clear bearish intermediate picture:
- Below SMA 50, 100, and 200 -- intermediate and long-term trend is down.
- Death cross active -- the most widely-watched bearish MA signal.
- Above SMA 10 and 20 -- short-term bounce is real.
- SMA 200 slope still positive (+1.7%) -- the long-term trend has not fully reversed yet.
- All MA slopes negative except SMA 200 -- confirming intermediate downtrend.
The overhead MA cluster at $153-162 (EMA 50, SMA 50, SMA 200) represents significant resistance. This zone is where the death cross occurred and will likely attract selling pressure on any rally approach.
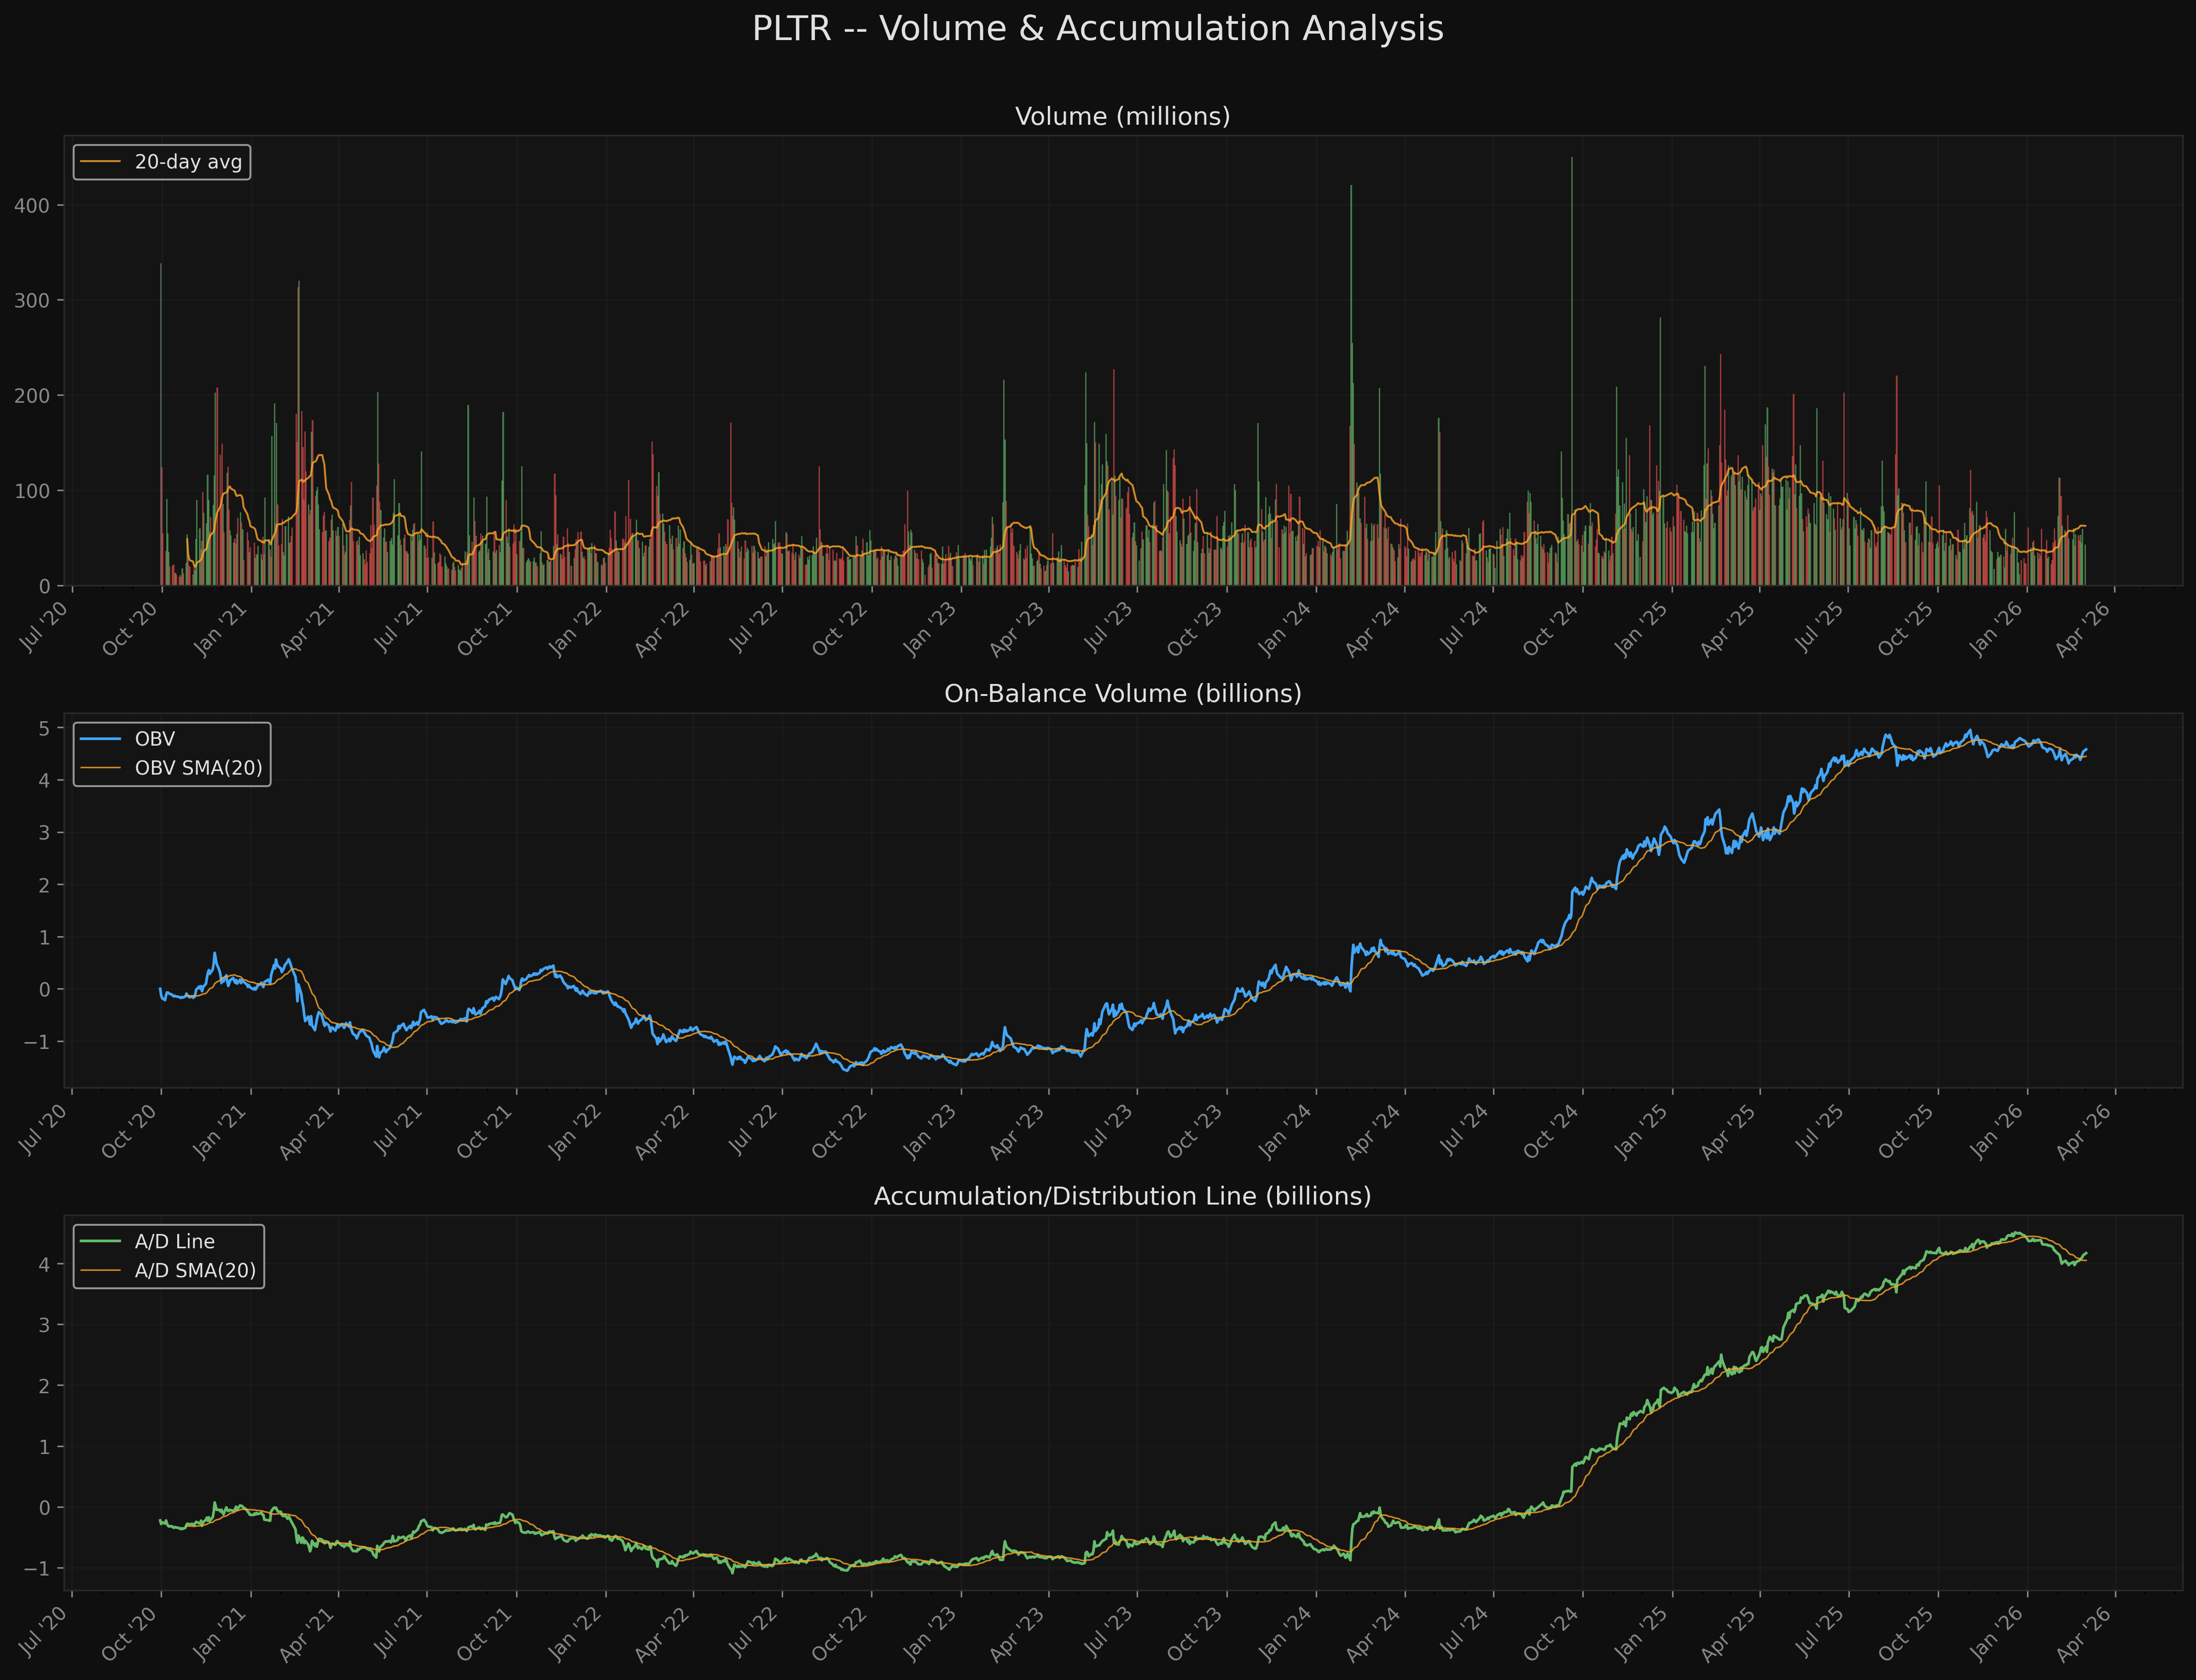
7. Volume Analysis
Volume Statistics
| Metric | Value |
|---|---|
| Current day volume | 43.2M |
| 20-day average volume | 62.5M |
| 50-day average volume | 47.6M |
| Current vs 20d avg | 0.69x |
| Average dollar volume | $9,162.6M/day |
| Up/down volume ratio (20d) | 1.21 |
On-Balance Volume (OBV)
OBV is currently rising over the last 20 days and sits above its 20-day SMA. This is a positive signal -- it means volume is flowing in on up days more than it flows out on down days. The OBV trend supports the idea that accumulation is occurring despite the price weakness.
Accumulation/Distribution Line
The A/D line is falling over the last 20 days. This creates a divergence with OBV and warrants attention. The A/D line incorporates the close's position within the daily range (not just direction), so a falling A/D line while OBV rises means that while net volume favors up days, the closes are tending toward the lower end of daily ranges. This is common in volatile, choppy markets where intraday reversals occur frequently.
Volume During Wyckoff Phases
| Phase | Avg Daily Volume | vs. Normal (41M) |
|---|---|---|
| Selling Climax (Feb 3-5) | 107M | 2.6x |
| Testing (Feb 6-13) | 60M | 1.5x |
| Spring (Feb 24) | 47M | 1.1x |
| Sign of Strength (Feb 25-Mar 2) | 50M | 1.2x |
The classic Wyckoff volume pattern is present: climax volume on the decline, diminishing volume on tests, and moderate volume on the recovery. The Sign of Strength move ideally would show increasing volume, which has not yet materialized -- today's volume at 43M is below average. This is a minor concern for the Wyckoff thesis.
Volume Synthesis
Volume analysis is mixed. OBV is constructive (rising), the Wyckoff volume pattern is supportive (diminishing on tests), and liquidity is excellent ($9.2B average daily dollar volume). However, the A/D divergence and below-average volume on today's SOS rally are concerns. Score: 6.0/10.
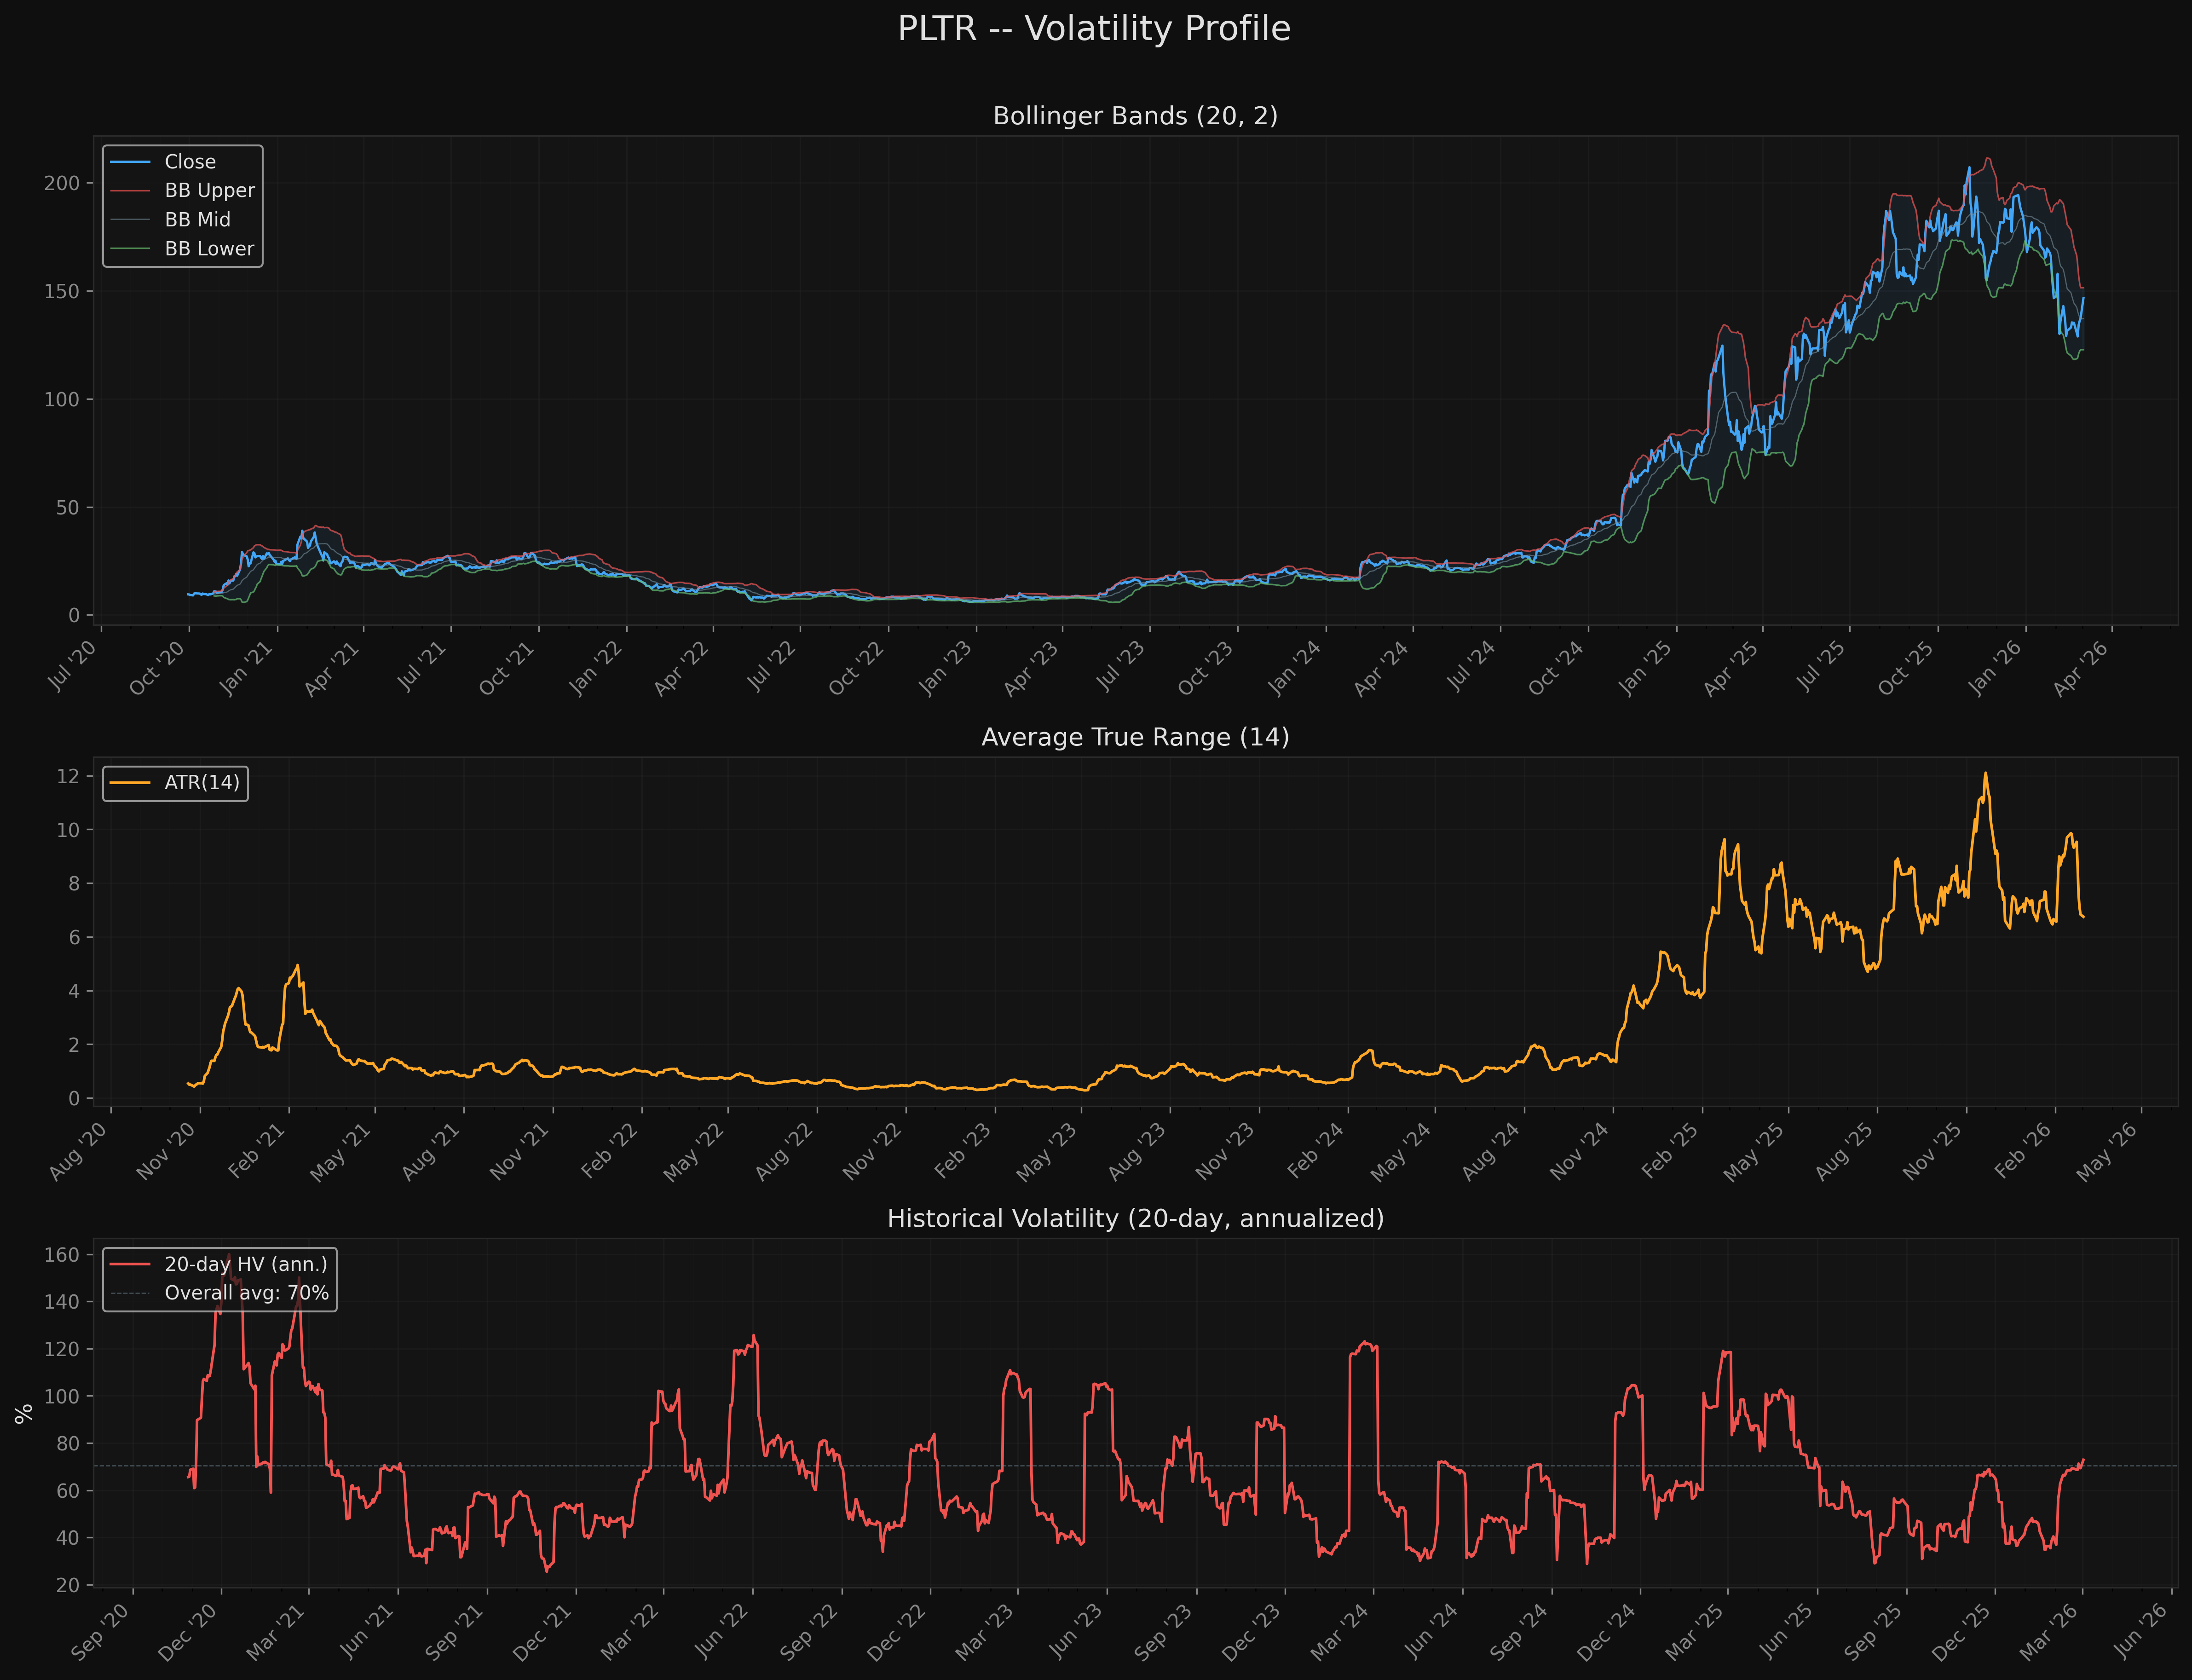
8. Volatility Profile
ATR and Volatility Statistics
| Metric | Value |
|---|---|
| ATR (14-day) | $6.75 |
| ATR as % of price | 4.6% |
| Daily return std dev | 4.44% |
| Annualized volatility (full history) | 70.5% |
| 30-day annualized vol | 63.7% |
| 90-day annualized vol | 55.1% |
| Skewness | +1.023 |
| Kurtosis (excess) | 6.037 |
| Max daily gain | +30.8% |
| Max daily loss | -21.3% |
| Annualized Sharpe ratio | 1.06 |
Bollinger Bands (20, 2)
| Level | Price |
|---|---|
| Upper Band | $151.43 |
| Middle (SMA 20) | $137.08 |
| Lower Band | $122.73 |
| Bandwidth | 20.94% |
| %B position | 0.83 |
PLTR's %B at 0.83 places the price in the upper portion of the Bollinger Band, consistent with the strong short-term rally. The bandwidth of 20.94% is wide, reflecting the elevated volatility of the recent correction. The price is approaching the upper band at $151.43, which may act as short-term resistance.
Return Distribution
PLTR's return distribution has positive skewness (+1.023) and significant excess kurtosis (6.037). This means: - Positive skew: extreme returns tend to be positive (fat right tail). - High kurtosis: returns have fatter tails than a normal distribution, meaning large daily moves occur more frequently than expected. - The max daily gain (+30.8%) and loss (-21.3%) over the stock's history confirm the fat-tailed nature.
Volatility Regime
30-day volatility (63.7%) is elevated relative to 90-day volatility (55.1%), indicating the recent volatility spike from the Feb correction has not yet fully mean-reverted. However, the 30-day figure is declining from its peak, which is constructive.
For position sizing, the ATR of 4.6% means a 1-ATR stop on PLTR requires approximately 4.6% of risk per share. This limits position size for risk-managed portfolios.
9. Entry Point Assessment
Confluence Zones (Ranked by Risk/Reward)
Zone 1 -- Aggressive Entry: $135 - $140 - Rationale: Pullback to the SMA 20 ($137.08) / consolidation zone mid-point. - Confluence: 20-day moving average, prior consolidation range, EMA 20 ($140.60). - R:R to Target 1 ($160.25): 1.3:1 (from $137.50 midpoint, stop at $120). - R:R to Target 2 ($176.47): 2.2:1. - Probability: Moderate -- requires a pullback from today's strong move.
Zone 2 -- Conservative Entry: $126 - $131 - Rationale: Retest of the Wyckoff Spring zone / 52-week low. - Confluence: Double-tested support at $126.23, Fibonacci 0.0 level, the Spring low. - R:R to Target 1 ($160.25): 3.7:1 (from $128.50 midpoint, stop at $120). - R:R to Target 2 ($176.47): 5.6:1. - Probability: Lower -- would require a failure of the current rally and a retest of lows, but offers exceptional R:R if triggered.
Not Recommended: Chasing at Current Levels ($146+) - R:R to Target 1 ($160.25): 0.5:1 (from $146.57, stop at $120). - The risk/reward at current levels is unfavorable for new entries. The stock has already rallied 16% off the Spring low and sits near the Bollinger upper band and Fibonacci 0.236 resistance.
Entry Priority
Zone 2 is the higher-quality entry by R:R, but Zone 1 is more likely to be triggered given the current upward momentum. Scaling in (partial at Zone 1, add at Zone 2 if triggered) is the most prudent approach for the current environment.
10. Risk/Reward Framework
Scenario 1: Bullish -- Wyckoff Spring Confirms (60-day view)
| Parameter | Value |
|---|---|
| Entry | $137.50 (Zone 1 pullback) |
| Stop Loss | $120.00 (below 52-week low with 5% buffer) |
| Target 1 | $160.25 (SMA 50 / death cross cluster) |
| Target 2 | $176.47 (Fibonacci 0.382 retracement) |
| Risk per share | $17.50 |
| Reward to T1 | $22.75 |
| Reward to T2 | $38.97 |
| R:R to T1 | 1.3:1 |
| R:R to T2 | 2.2:1 |
Catalyst: Spring confirmation via close above $150 on elevated volume. Momentum indicators continue improving, MACD zero-line crossover.
Scenario 2: Conservative -- Deep Retest Entry (90-day view)
| Parameter | Value |
|---|---|
| Entry | $128.50 (Zone 2 retest) |
| Stop Loss | $120.00 (below 52-week low) |
| Target 1 | $160.25 (SMA 50 cluster) |
| Target 2 | $176.47 (Fibonacci 0.382) |
| Risk per share | $8.50 |
| Reward to T1 | $31.75 |
| Reward to T2 | $47.97 |
| R:R to T1 | 3.7:1 |
| R:R to T2 | 5.6:1 |
Catalyst: Broader market weakness pulls PLTR back to retest the $126-$128 zone. The Spring holds on diminishing volume, creating a higher low.
Scenario 3: Bearish -- Spring Fails
| Parameter | Value |
|---|---|
| Trigger | Close below $126 on elevated volume |
| Downside Target | $100-$110 (measured move from distribution) |
| Action | No entry; wait for new base to form |
| Significance | A break below $126 negates the Wyckoff Spring thesis and signals a deeper correction. The measured move target from the $207.52 high through the $126 support break projects to approximately $100-$110. |
11. Key Levels Summary
| Level | Price | Type | Description |
|---|---|---|---|
| $207.52 | Resistance | 52-week / all-time high (Nov 3, 2025) | |
| $198.88 | Resistance | Dec 22 swing high | |
| $188.20 | Resistance | Oct 2 swing high | |
| $176.47 | Resistance | Fibonacci 0.382 retracement | |
| $170.04 | Resistance | SMA 100 | |
| $166.88 | Resistance | Fibonacci 0.500 retracement | |
| $161.59 | Resistance | SMA 200 (death cross zone) | |
| $160.25 | Resistance | SMA 50 (death cross zone) | |
| $157.28 | Resistance | Fibonacci 0.618 retracement | |
| $153.27 | Resistance | EMA 50 | |
| $151.43 | Resistance | Bollinger upper band / EMA 200 | |
| $147.56 | Resistance | Nov 21 swing low (Phase A "ice" line) | |
| $146.57 | Current | Current price | |
| $145.42 | Support/Resistance | Fibonacci 0.236 retracement | |
| $140.60 | Support | EMA 20 | |
| $137.08 | Support | SMA 20 | |
| $135.00 | Support | Consolidation zone mid-point | |
| $126.23 | Support | 52-week low (Spring zone, double-tested) | |
| $122.73 | Support | Bollinger lower band | |
| $120.00 | Support | Stop loss level (psychological + buffer) |
12. Overall Technical Score
Weighted Composite Breakdown
| Component | Score | Weight | Contribution | Notes |
|---|---|---|---|---|
| Trend Alignment | 4.5/10 | 25% | 1.125 | Death cross just formed (Feb 27). Below SMA 50/100/200. Above SMA 10/20 (bounce). SMA 200 slope barely positive (+1.7%). |
| Momentum | 7.5/10 | 20% | 1.500 | RSI surged +17.8 pts in 5 days (34.5 to 52.3). MACD bullish crossover with expanding histogram. Stochastic %K above %D. All three aligned bullish short-term. MACD line still deeply negative (-6.12). |
| Volume Confirmation | 6.0/10 | 20% | 1.200 | OBV rising (positive). A/D line falling (divergence, negative). Wyckoff volume pattern intact (diminishing on tests). Below-average volume on today's SOS. Excellent liquidity ($9.2B/day). |
| Volatility Profile | 4.0/10 | 15% | 0.600 | ATR 4.6% (elevated for large-cap). Kurtosis 6.0 (fat tails). 30d vol expanding vs 90d (63.7% vs 55.1%). %B at 0.83 approaching upper BB. Positive skew is constructive. |
| Market Structure | 5.5/10 | 20% | 1.100 | Wyckoff Spring identified (Feb 24 low at $126.37). Sign of Strength rally in progress (+16% off Spring). Approaching Phase A resistance (~$147.56). Unconfirmed -- needs close above $150. |
Overall Score: 5.5/10 (= 1.125 + 1.500 + 1.200 + 0.600 + 1.100)
Bias: Neutral -- The stock sits at a critical juncture where the bearish intermediate trend (death cross, below major MAs) is being challenged by a textbook Wyckoff Spring reversal with aligned momentum. The outcome depends on whether the Spring confirms (bullish) or fails (bearish). Until confirmation, the neutral rating is appropriate.
Score Sensitivity
- If the Spring confirms (close above $150 + volume): Structure upgrades to 7.0, Trend to 5.0 --> Overall moves to 5.8 (Bullish).
- If the rally fails at $147 resistance: Momentum downgrades to 5.5, Structure to 4.0 --> Overall drops to 4.7 (Bearish).
13. Limitations
-
Data history since Sept 2020: PLTR has approximately 5.4 years of trading data since its direct listing. This is sufficient for most technical analysis but limits the usefulness of very long-term cycle analysis. The stock has never experienced a full secular bear market since listing (the 2022 drawdown was a sector-wide tech correction from which it recovered).
-
Single timeframe analysis: This analysis uses daily timeframe data only. Intraday and weekly timeframe confirmation would strengthen the Wyckoff interpretation. The weekly chart context is inferred but not directly analyzed.
-
Wyckoff interpretation subjectivity: While the quantitative evidence (diminishing volume on tests, selling climax volume, rally metrics) supports the Spring interpretation, Wyckoff analysis involves pattern recognition that is inherently subjective. The "Spring" could alternatively be interpreted as a brief pause before further decline if macro conditions deteriorate.
-
Death cross reliability: Research on death crosses shows mixed results as predictive signals. The signal often occurs after much of the decline has already happened. In PLTR's case, the death cross formed at $137.19 -- approximately 34% below the high -- suggesting much of the damage may already be priced in. However, death crosses in recent years (2022-2023 market) did precede extended periods of underperformance for high-multiple tech stocks.
-
Volatility limits position sizing: PLTR's 4.6% daily ATR and 70.5% annualized volatility are at the upper end of the equity spectrum. This is not a "set and forget" position -- active risk management is required.
-
Relative strength weakness: PLTR has underperformed SPY by -2.5% (1m), -12.9% (3m), and -13.8% (6m). The beta of 1.97 means PLTR amplifies market moves roughly 2:1. If the broader market weakens, PLTR is likely to decline proportionally more.
-
Correlation with SPY (0.472): The moderate correlation means PLTR is partially a market-beta play and partially an idiosyncratic story. Fundamental catalysts (earnings, government contracts, AI narrative) can dominate price action independently of market direction.
Charts
| Chart | Location |
|---|---|
| Price Structure | analysis/quant-research/charts/pltr_price_structure.png |
| Momentum | analysis/quant-research/charts/pltr_momentum.png |
| Volume/Accumulation | analysis/quant-research/charts/pltr_volume_accumulation.png |
| Volatility | analysis/quant-research/charts/pltr_volatility.png |
Analysis Script
analysis/quant-research/scripts/PLTR-technical-2026-03-02.py
Charts