OPEN — Technical Summary
Conviction 3OPEN -- Technical Deep Dive
- Date: 2026-03-18
- Researcher: Quant Researcher (Signals)
- Status: Complete
- Script:
analysis/quant-research/scripts/OPEN-technical-2026-03-18.py - Charts:
analysis/quant-research/charts/open_*.png
1. Score Box
===========================================================
  OPEN -- Technical Analysis                   2026-03-18
  Asset Class: Equity
  Price: $5.28  |  52wk: $0.51 - $10.87
===========================================================

  OVERALL SCORE: 5.5/10      BIAS: Neutral

  COMPONENT SCORES
  -----------------------------------------------------------
  Trend Alignment         5.0/10  wt 25%  Mixed; above EMA/SMA200, below SMA50/100
  Momentum                6.0/10  wt 20%  RSI neutral, MACD histogram turning up
  Volume Confirmation     6.0/10  wt 20%  OBV confirming, slight volume decline
  Volatility Profile      5.5/10  wt 15%  Extreme HVol 81%, BB compressing
  Market Structure        5.0/10  wt 20%  Wide range, mid-range position, no clear trend

  KEY LEVELS
  -----------------------------------------------------------
  Resistance 2:  $6.91   Fibonacci 38.2% retracement
  Resistance 1:  $5.69   Fibonacci 50.0% / round $5.70
  Current Price: $5.28
  Support 1:     $5.16   SMA 200 / round $5.00 zone
  Support 2:     $4.47   Fibonacci 61.8% retracement

  RED FLAGS                                    (4 found)
  -----------------------------------------------------------
  HIGH   Extreme annualized volatility (81.3%)        [Volatility]
  HIGH   ATR% at 7.46% (typical equity 1-3%)          [Volatility]
  MEDIUM 6-month decline of -48.3%                     [Price Structure]
  MEDIUM Deeply negative A/D line (-4.37B)             [Volume]

===========================================================
2. Executive Summary
Opendoor Technologies (OPEN) presents a neutral technical picture with extreme volatility characteristics that dominate the risk profile. The stock trades at $5.28, roughly mid-range in its 52-week window ($0.51 - $10.87), having recovered sharply from its March 2026 lows near $3.00. Short-term momentum is improving -- RSI sits at 52 with MACD histogram turning positive -- but the longer-term trend remains damaged with price below the falling SMA 50 ($5.44) and well below SMA 100 ($6.27).
The most significant technical feature is the extreme volatility: annualized historical volatility of 81.3% and daily ATR of 7.46% of price. This is 3-5x typical for a mid-cap equity and means position sizing must be dramatically reduced versus normal equity allocations. Bollinger Band width is at the 1.6th percentile of its 1-year range, suggesting a volatility compression that may precede a directional breakout.
The stock is essentially in no-man's-land -- above the rising SMA 200 ($5.16) but below the falling SMA 50 ($5.44). This MA divergence reflects a stock that rallied hard off extreme lows but has not yet established a sustainable uptrend. The Fibonacci 50% retracement at $5.69 is the key level to watch: a close above it would suggest the recovery has legs, while failure to reclaim the SMA 50 would indicate continued distribution.
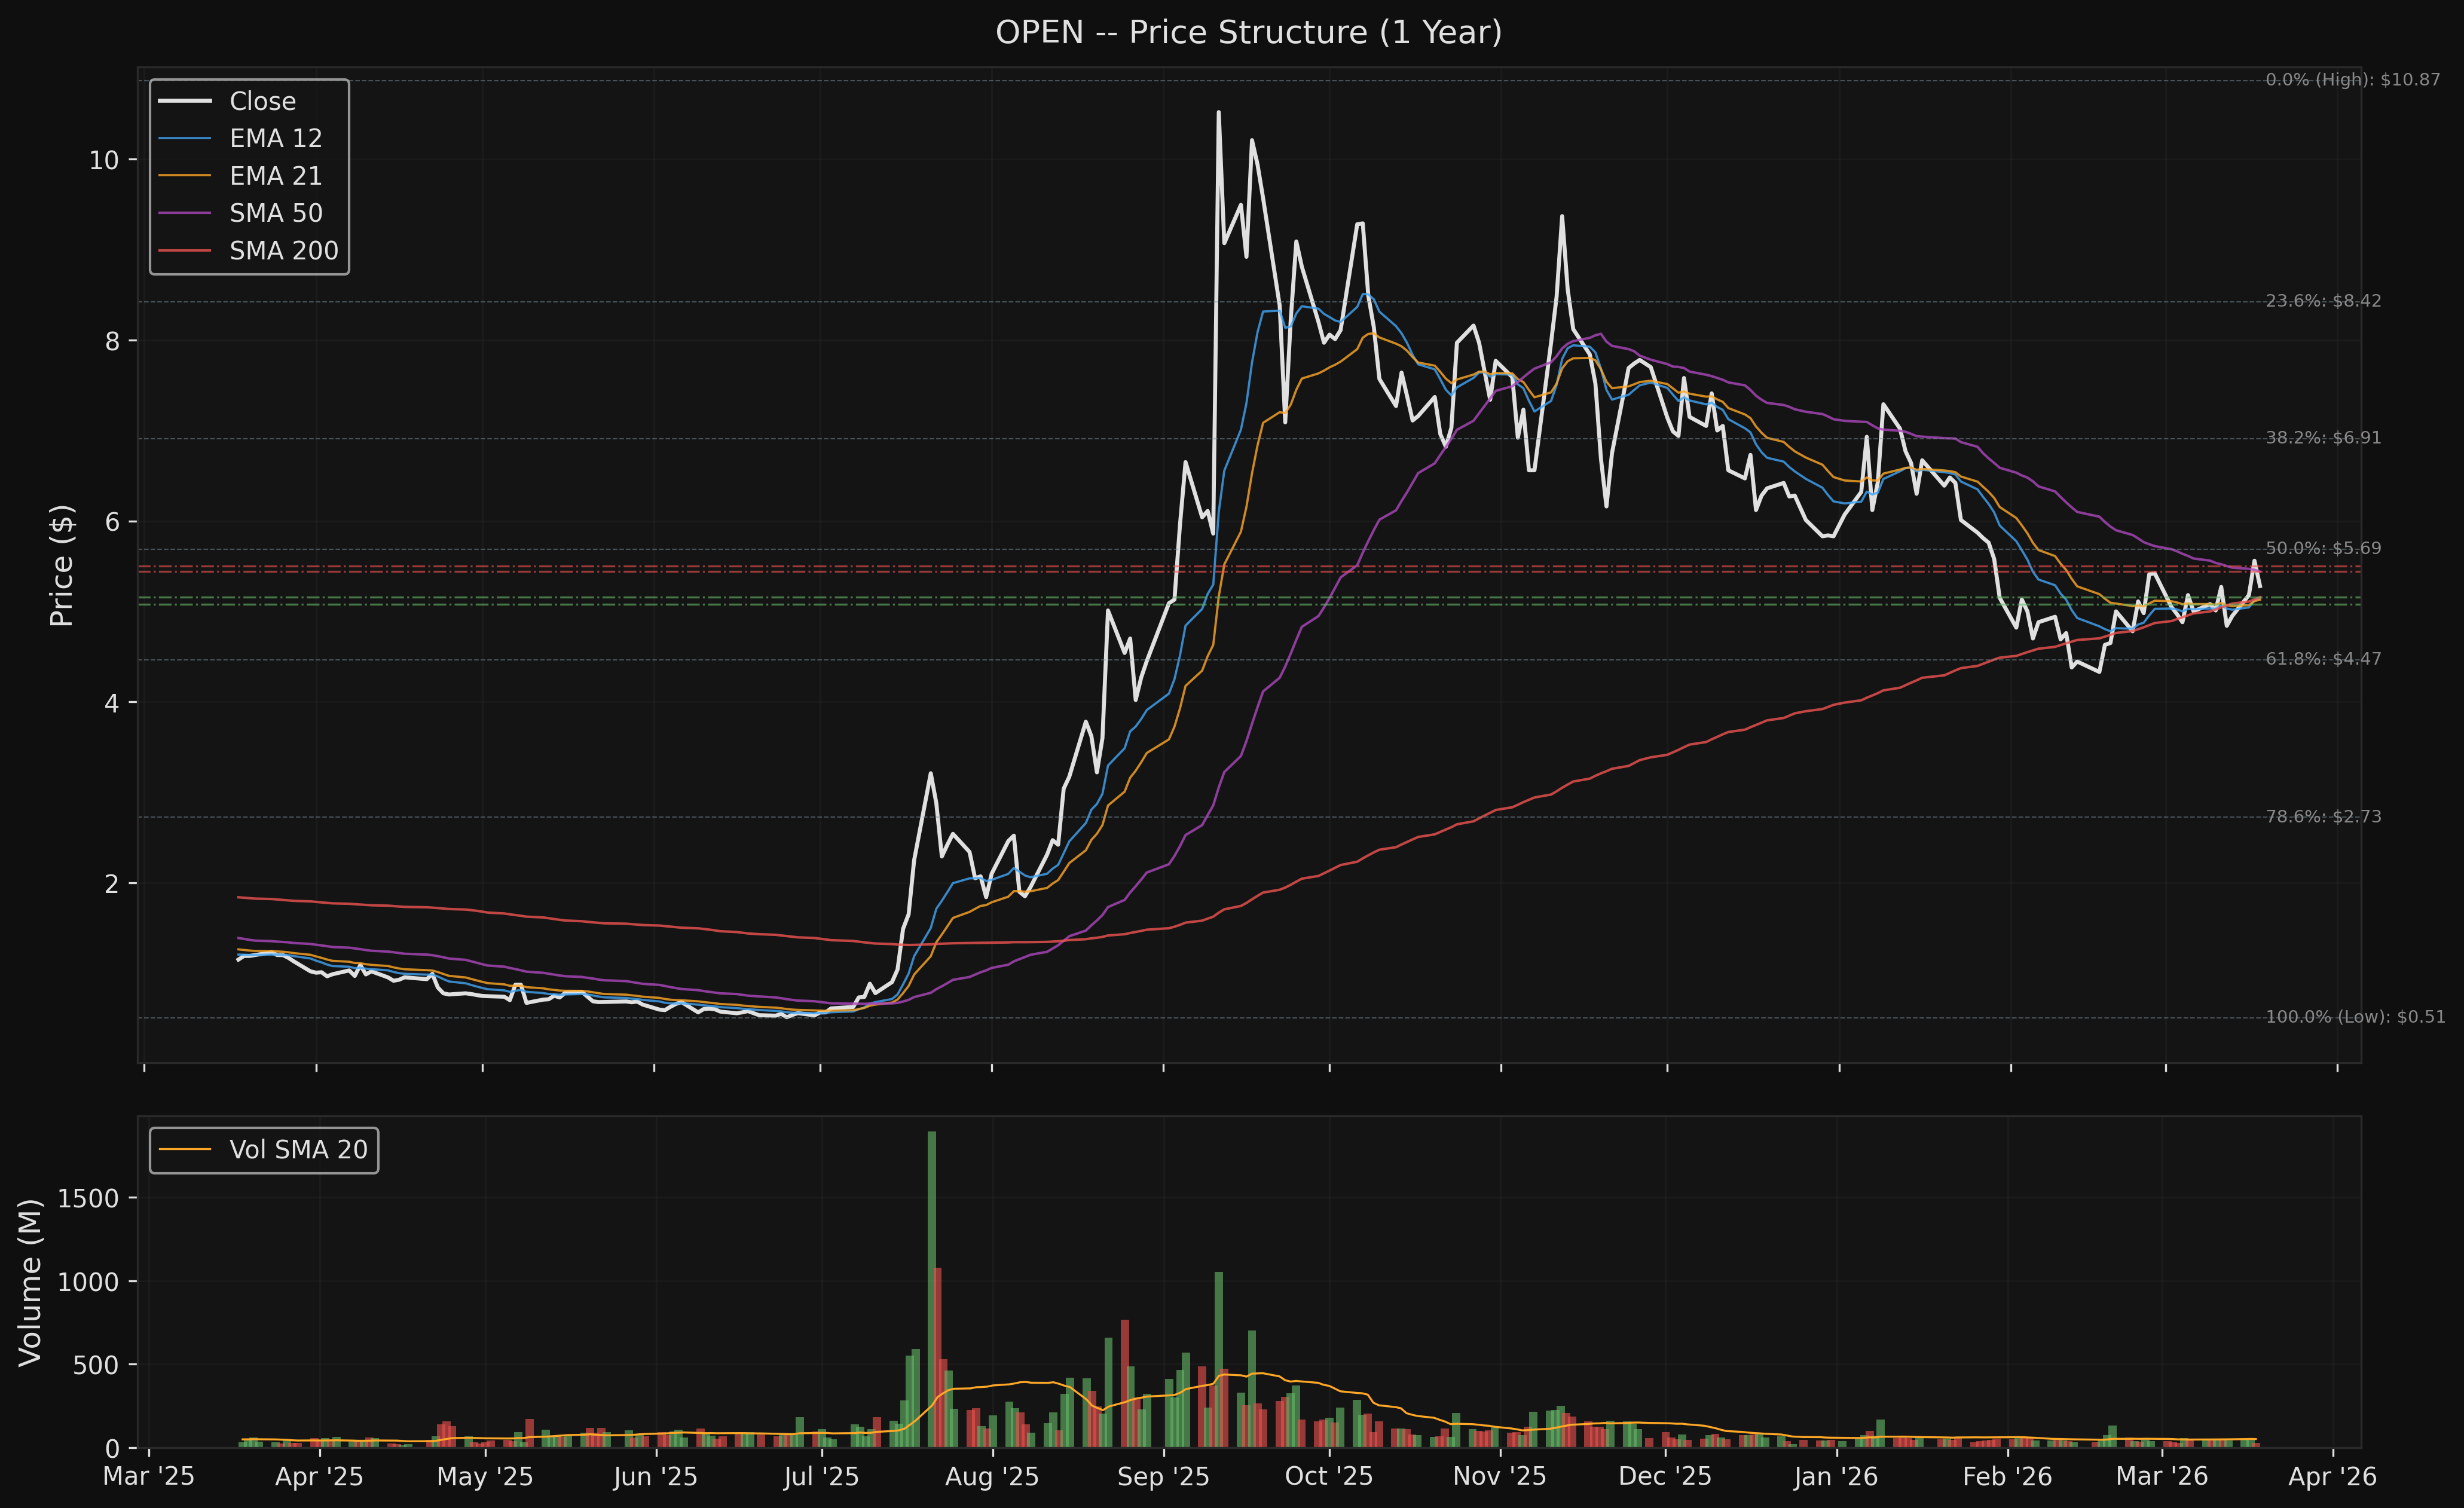
3. Price Structure
| Metric | Value |
|---|---|
| 52-Week High | $10.87 |
| 52-Week Low | $0.51 |
| Current Price | $5.28 |
| Position in 52wk Range | 46.1% |
| 20-Day High | $5.67 |
| 20-Day Low | $4.48 |
Performance Summary
| Period | Return |
|---|---|
| 1 Week | +9.1% |
| 1 Month | +14.0% |
| 3 Months | -21.5% |
| 6 Months | -48.3% |
| 1 Year | +359.1% |
The performance table reveals OPEN's extreme character: a 359% 1-year gain masks a -48% drawdown over the last 6 months. The stock has been a rollercoaster, with the 52-week range spanning from $0.51 to $10.87 -- a factor of 21x. The recent bounce (+14% in the last month, +9.1% last week) is encouraging but occurs within the context of a much larger decline from the highs.
Fibonacci Retracement Levels (252-day swing)
| Level | Price |
|---|---|
| 0.0% (High) | $10.87 |
| 23.6% | $8.42 |
| 38.2% | $6.91 |
| 50.0% | $5.69 |
| 61.8% | $4.47 |
| 78.6% | $2.73 |
| 100.0% (Low) | $0.51 |
Price currently sits just below the 50% retracement ($5.69), which acts as the first meaningful Fibonacci resistance. The 61.8% level at $4.47 is the critical support -- a breach would suggest the recovery is failing. The wide distance between Fibonacci levels (each ~$1.50 apart) reflects the extreme range and means each level carries significant profit/loss potential.
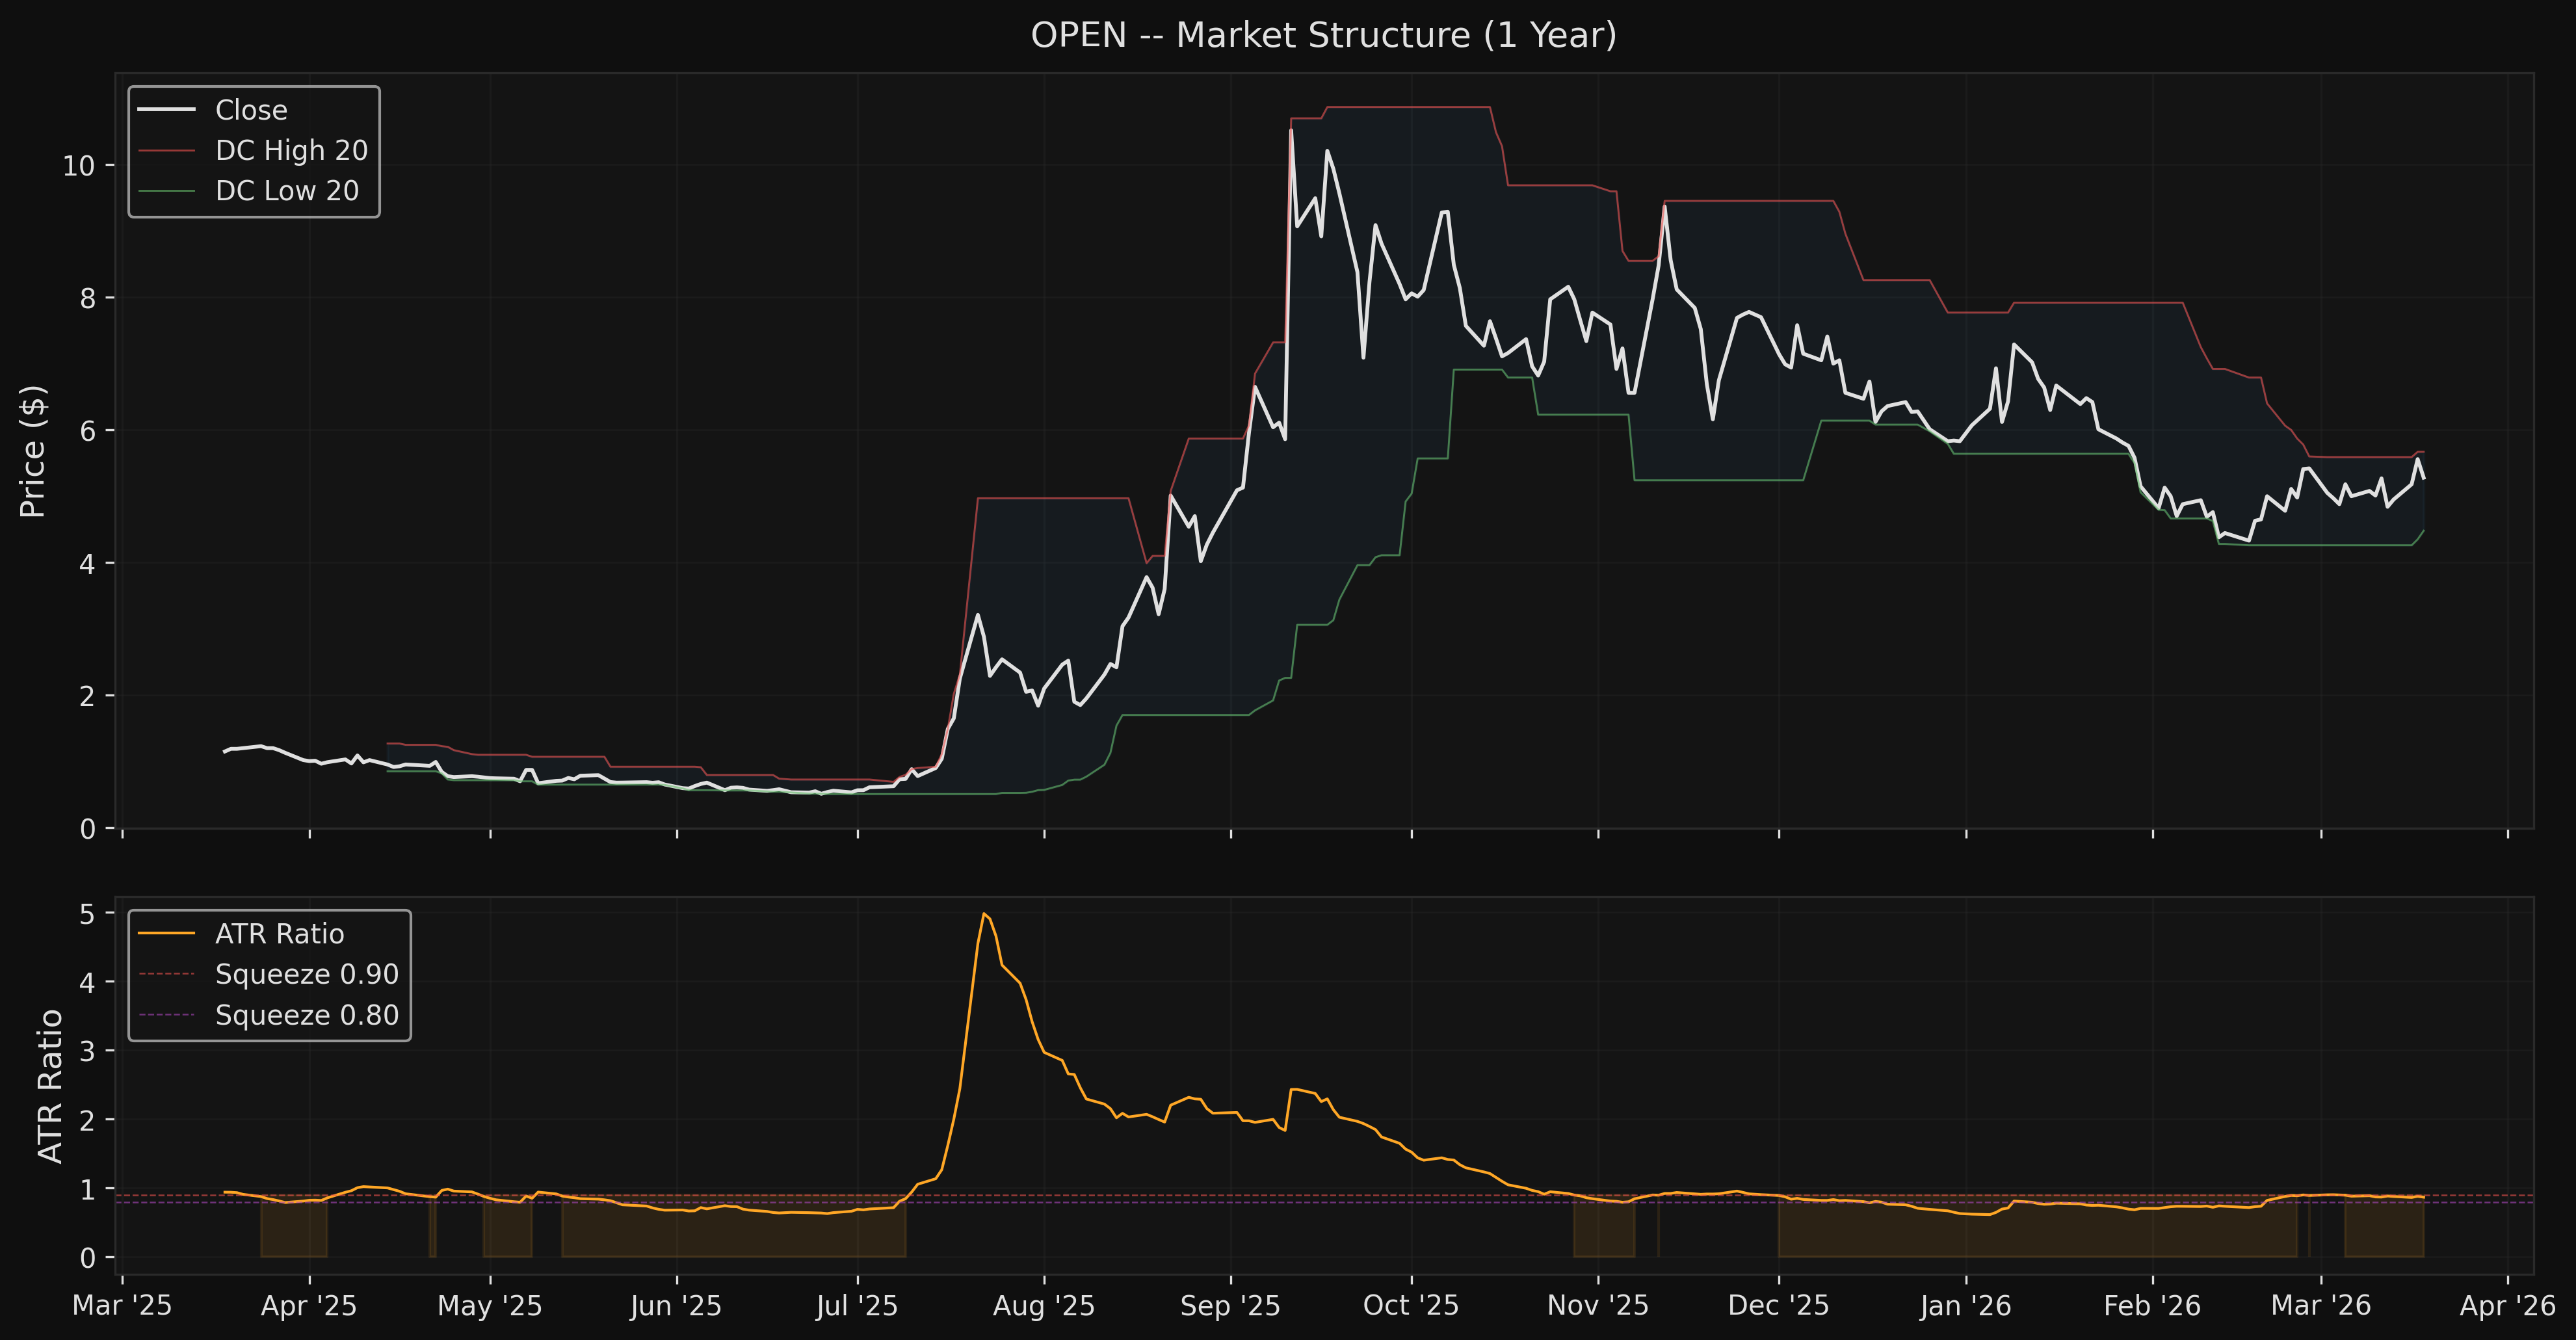
4. Market Structure
Wyckoff Phase: Markdown / Redistribution
The quantitative evidence points to a Markdown (Phase D) structure over the intermediate term, though with emerging signs of potential re-accumulation:
| Evidence | Value | Implication |
|---|---|---|
| 60-day price range | 65.9% | Extremely wide, characteristic of markdown/capitulation |
| 20-day price range | 23.4% | Narrowing, possible stabilization |
| 60-day price trend | -17.0% | Downward bias over 2 months |
| Volume trend (20d/60d) | 0.96x | Slightly declining, consistent with late markdown |
| OBV 60-day change | +49.97M | Positive OBV into weakness = potential accumulation |
The conflict between the declining price trend (-17% over 60 days) and the positive OBV trend is notable. In Wyckoff terms, this could represent a Spring or Test phase where smart money accumulates into weakness. However, the 65.9% price range over 60 days is extreme and suggests the stock has not yet established a clear trading range for accumulation.
Donchian Channel Analysis
The 20-day Donchian channel ($4.48 - $5.67) is narrowing after the volatile January-February period. Price closed at $5.28, in the upper half of the channel. A close above $5.67 (channel breakout) would be a bullish structural signal; a close below $4.48 would confirm continued markdown.
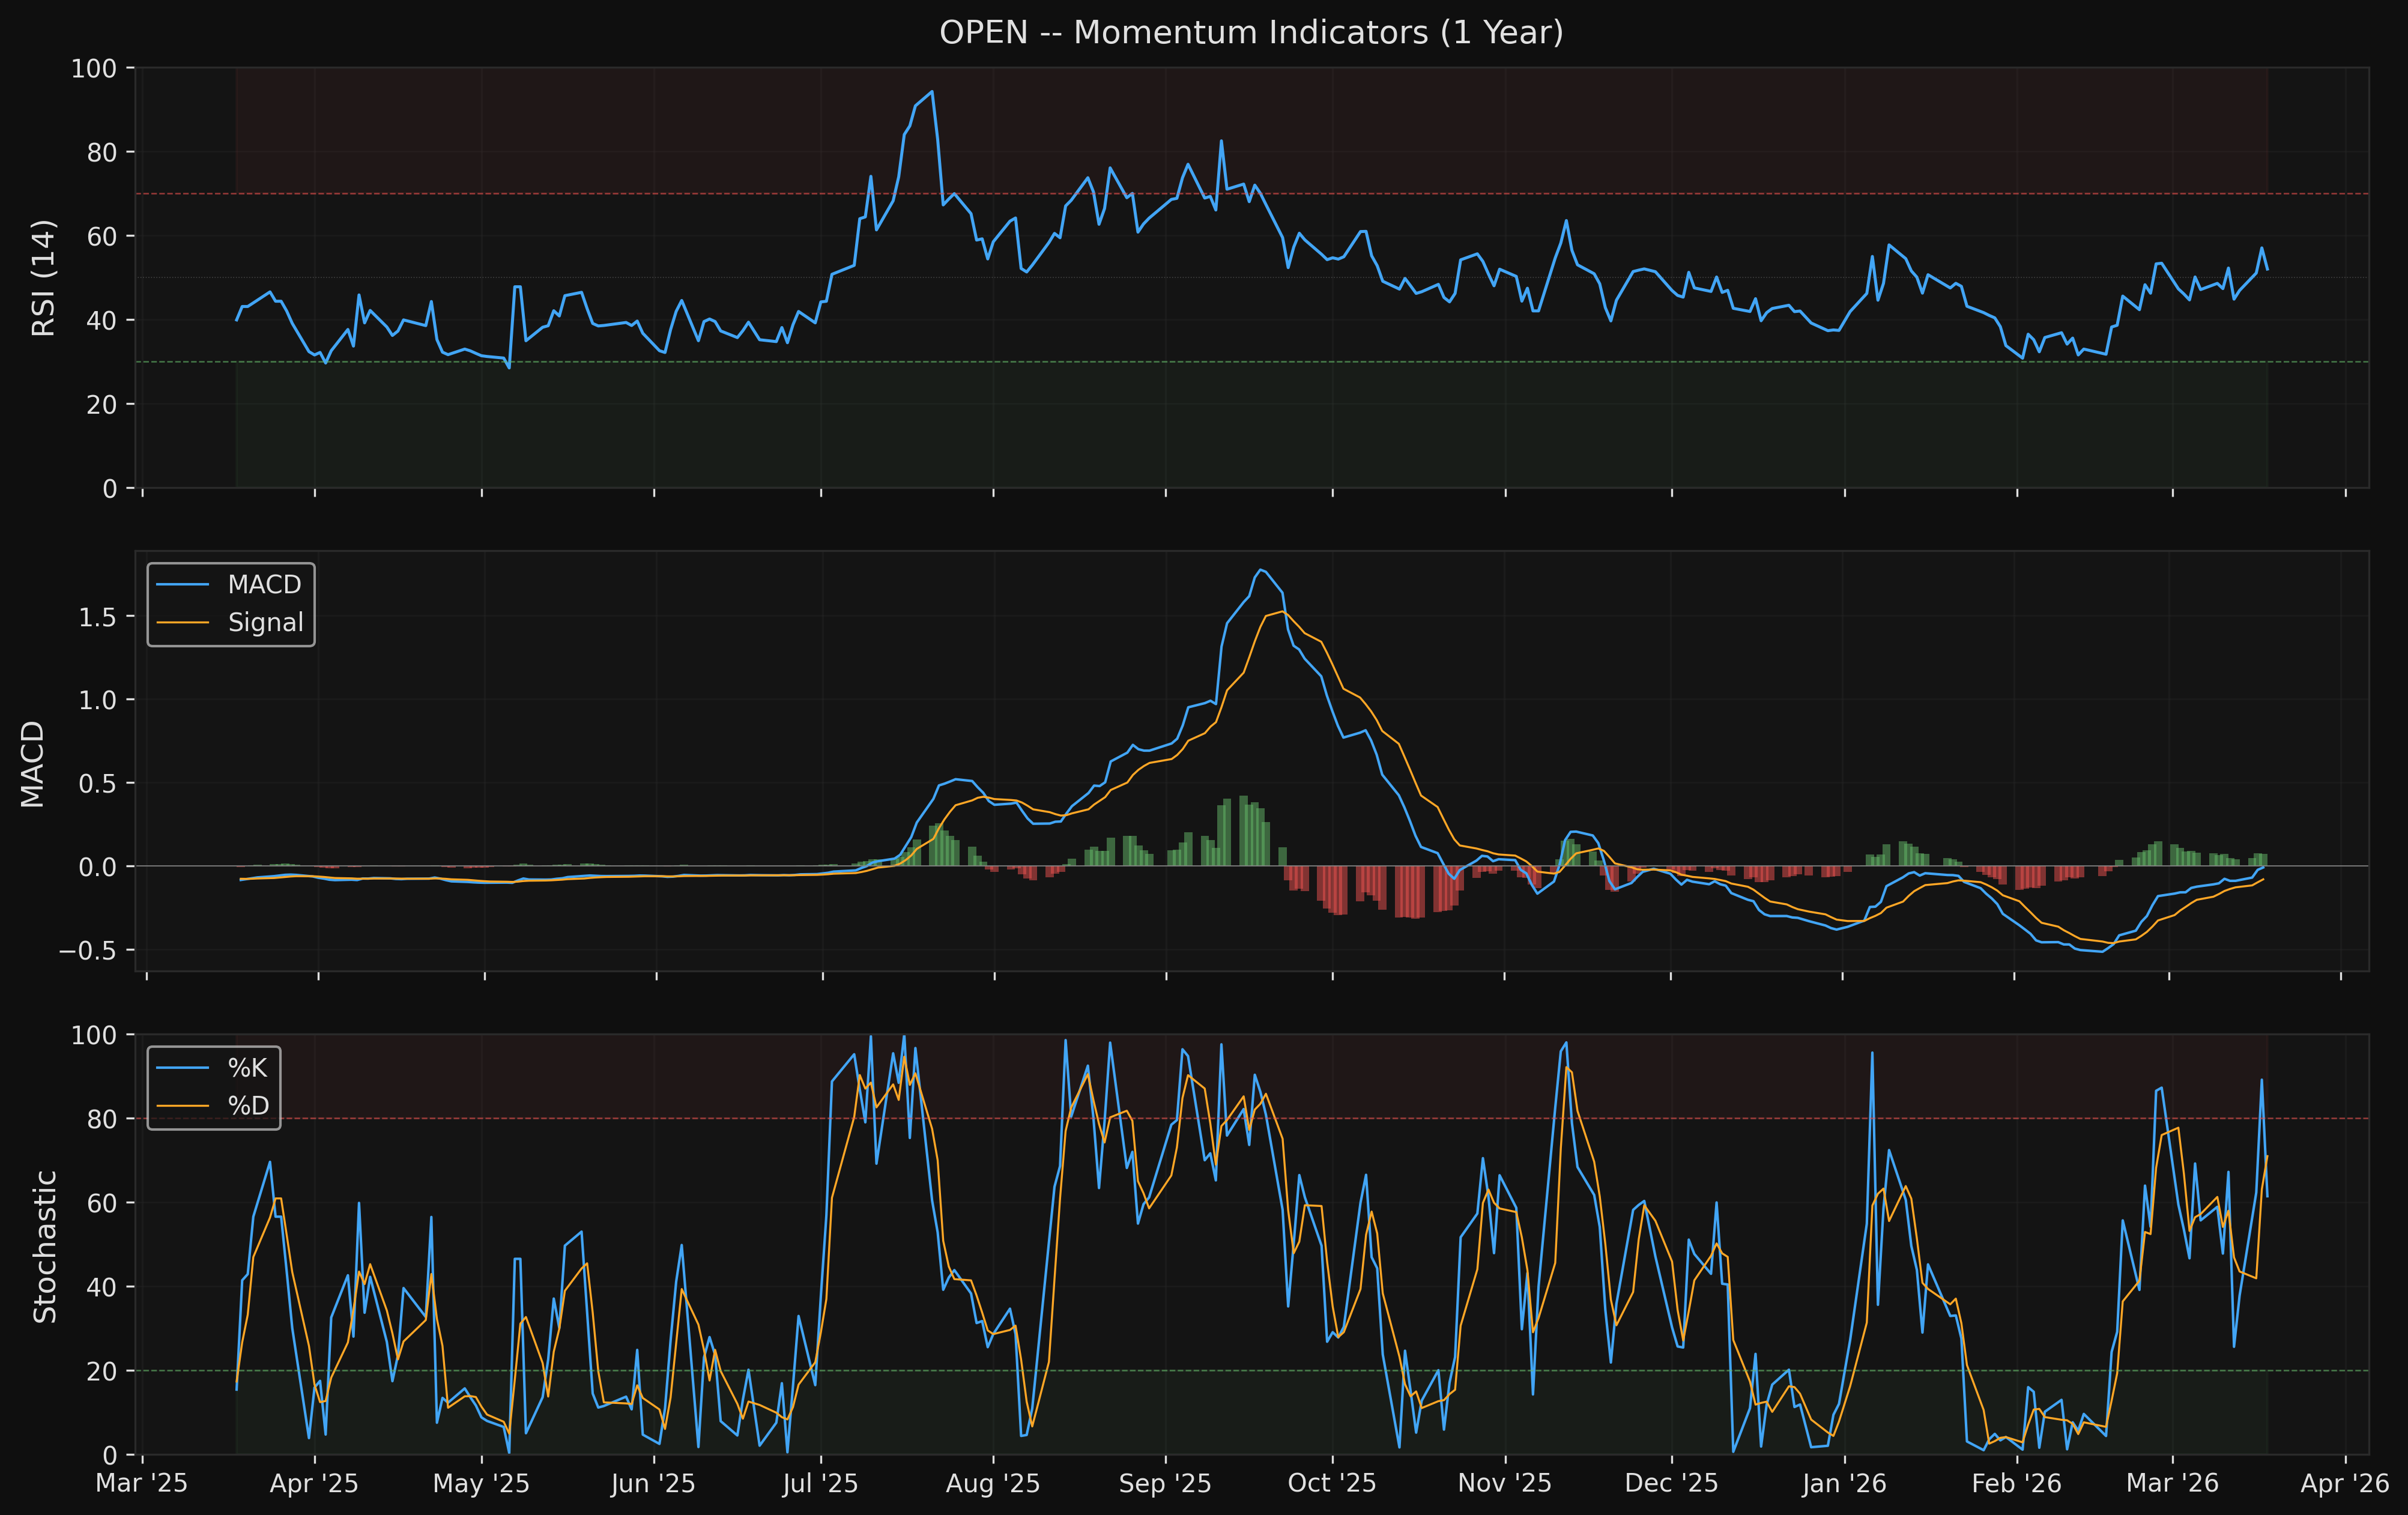
5. Momentum Analysis
| Indicator | Value | Signal |
|---|---|---|
| RSI (14) | 52.0 | Neutral -- no overbought/oversold |
| MACD | -0.0092 | Just below zero, recovering |
| MACD Signal | -0.0803 | MACD above signal line |
| MACD Histogram | +0.0710 | Positive and expanding |
| Stochastic %K | 61.4 | Mid-range, no extreme |
| Stochastic %D | 70.9 | Elevated, approaching overbought |
RSI at 52.0 is essentially dead neutral. After touching oversold territory during the February-March decline, the recovery to 52 indicates momentum has stabilized but is not yet bullish.
MACD is the most constructive momentum indicator. The histogram has turned positive at +0.0710 and is expanding, with the MACD line crossing above the signal line. This bullish crossover occurred within the last few sessions and suggests short-term momentum is building. The MACD line itself is still marginally negative (-0.0092), which means the broader momentum regime has not fully flipped bullish.
Stochastic shows %K at 61.4 below %D at 70.9 -- a slight negative divergence. The %D is approaching the 80 overbought threshold, which could limit near-term upside if it triggers a sell signal.
Overall momentum score: 6.0/10 -- improving but not yet decisively bullish.
6. Moving Average Analysis
| MA | Value | Price Position | Distance |
|---|---|---|---|
| EMA 12 | $5.15 | ABOVE | +2.6% |
| EMA 21 | $5.13 | ABOVE | +2.9% |
| SMA 50 | $5.44 | BELOW | -2.9% |
| SMA 100 | $6.27 | BELOW | -15.8% |
| SMA 200 | $5.16 | ABOVE | +2.4% |
MA Slope Analysis (20-bar change)
| MA | Slope | Direction |
|---|---|---|
| SMA 50 | -8.40% | Falling sharply |
| SMA 200 | +8.77% | Rising |
The MA picture is split: short-term EMAs (12, 21) are below price and providing dynamic support, while the SMA 200 is also below and rising. However, the SMA 50 is above price and falling sharply (-8.40% slope), creating overhead resistance. The SMA 100 at $6.27 is 15.8% above price, representing a significant headwind.
Key MA observation: The SMA 50 ($5.44) is still above the SMA 200 ($5.16) -- so there is no death cross. However, the SMA 50 is declining rapidly toward the SMA 200. If the SMA 50 crosses below the SMA 200, it would constitute a death cross, which would be a significant bearish structural signal. The current gap is only $0.28 (5.1%), meaning a death cross could occur within 2-4 weeks if the SMA 50 continues declining at its current rate.
EMA stack: EMA 12 ($5.15) > EMA 21 ($5.13) is barely bullish. The spread is only $0.02, indicating a very early-stage recovery that has not yet developed meaningful trend strength.
7. Volume Analysis
| Metric | Value |
|---|---|
| Current Volume | 27.36M |
| 20-Day Avg Volume | 50.77M |
| 50-Day Avg Volume | 54.17M |
| Volume Ratio (20d/50d) | 0.94x |
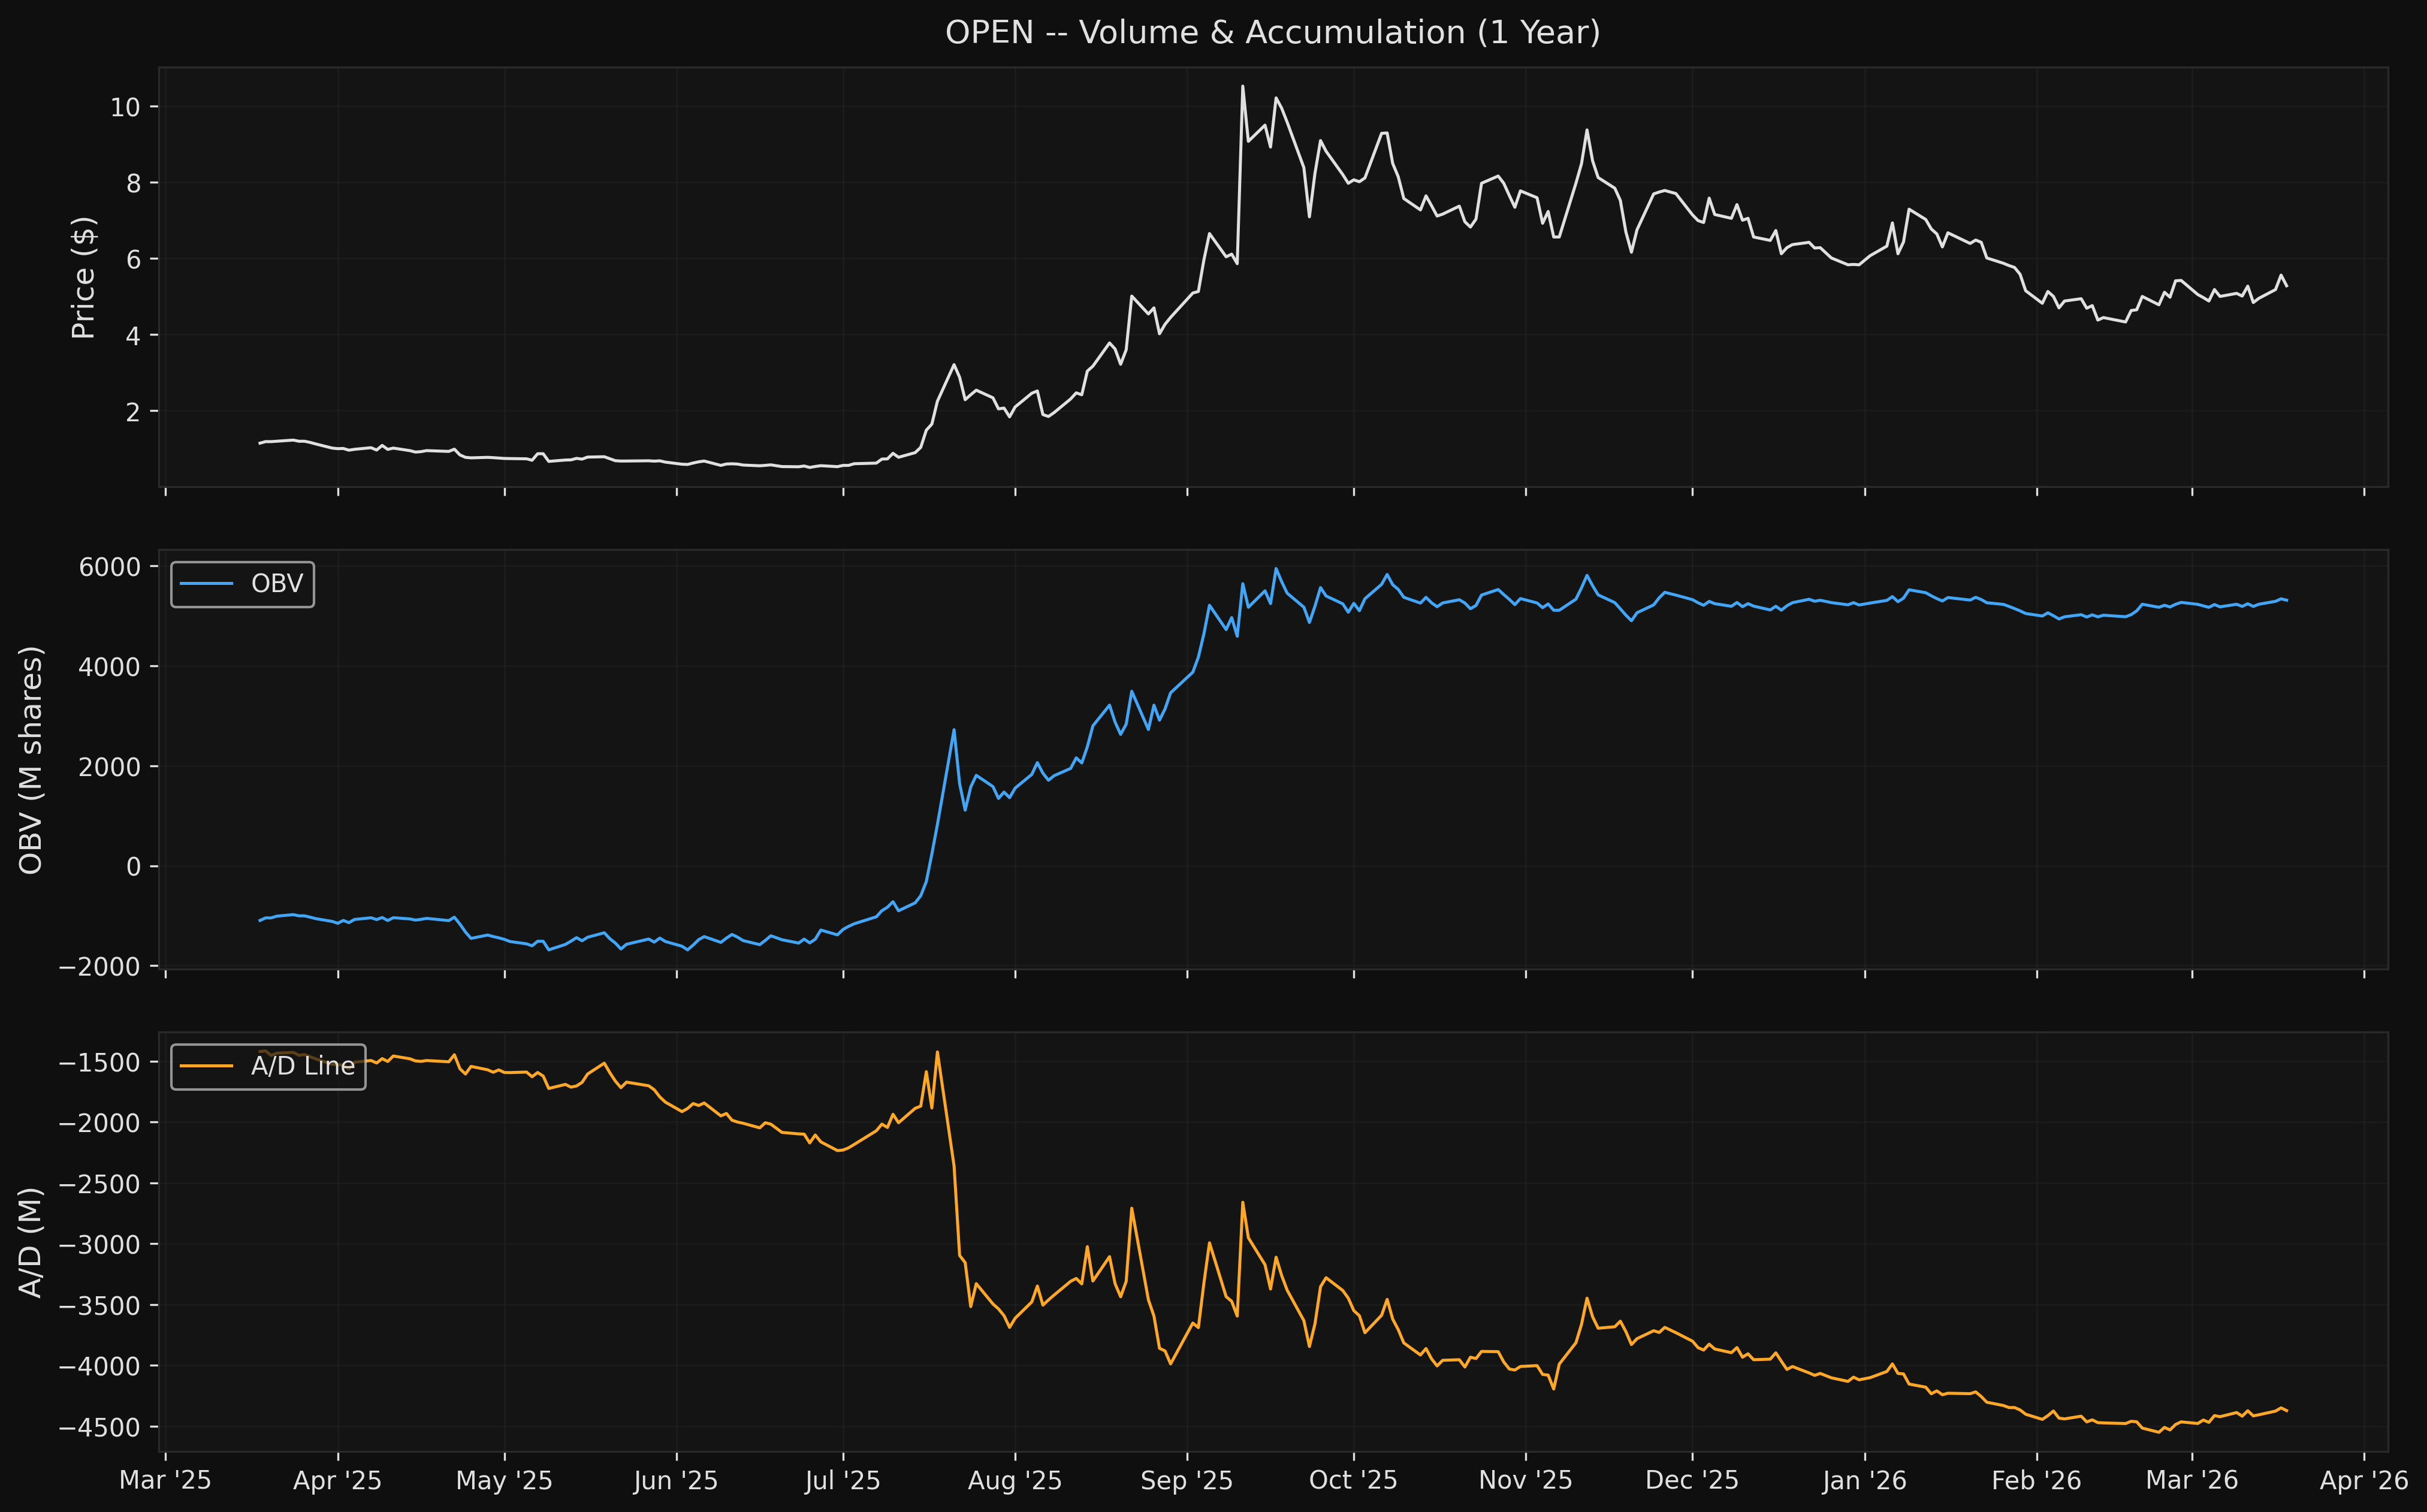
| OBV | +5.31B |
| A/D Line | -4.37B |
Volume Trend
Volume has been moderately declining, with the 20-day average (50.77M) slightly below the 50-day average (54.17M). Today's volume (27.36M) is well below average, which is notable on a -5% down day -- selling pressure is not intensifying.
OBV (On-Balance Volume)
OBV is at +5.31B and has been trending positively over the last 20 days, even as price declined. This positive OBV divergence suggests that net buying pressure exceeds selling pressure on a cumulative basis. Buyers are accumulating during pullbacks, which is a constructive sign for the intermediate-term outlook.
A/D Line (Accumulation/Distribution)
The A/D line is deeply negative at -4.37B, which reflects the long history of closes near the lows of daily ranges. This is a structural negative that indicates sustained distribution over the stock's trading history. However, the A/D line should be interpreted with caution for stocks with such extreme price histories -- the absolute level is less meaningful than the trend direction.
Volume Verdict
The volume picture is mixed but leaning constructive: OBV confirms the recent price recovery, volume is not expanding on down days, but the A/D line remains deeply negative. Score: 6.0/10.
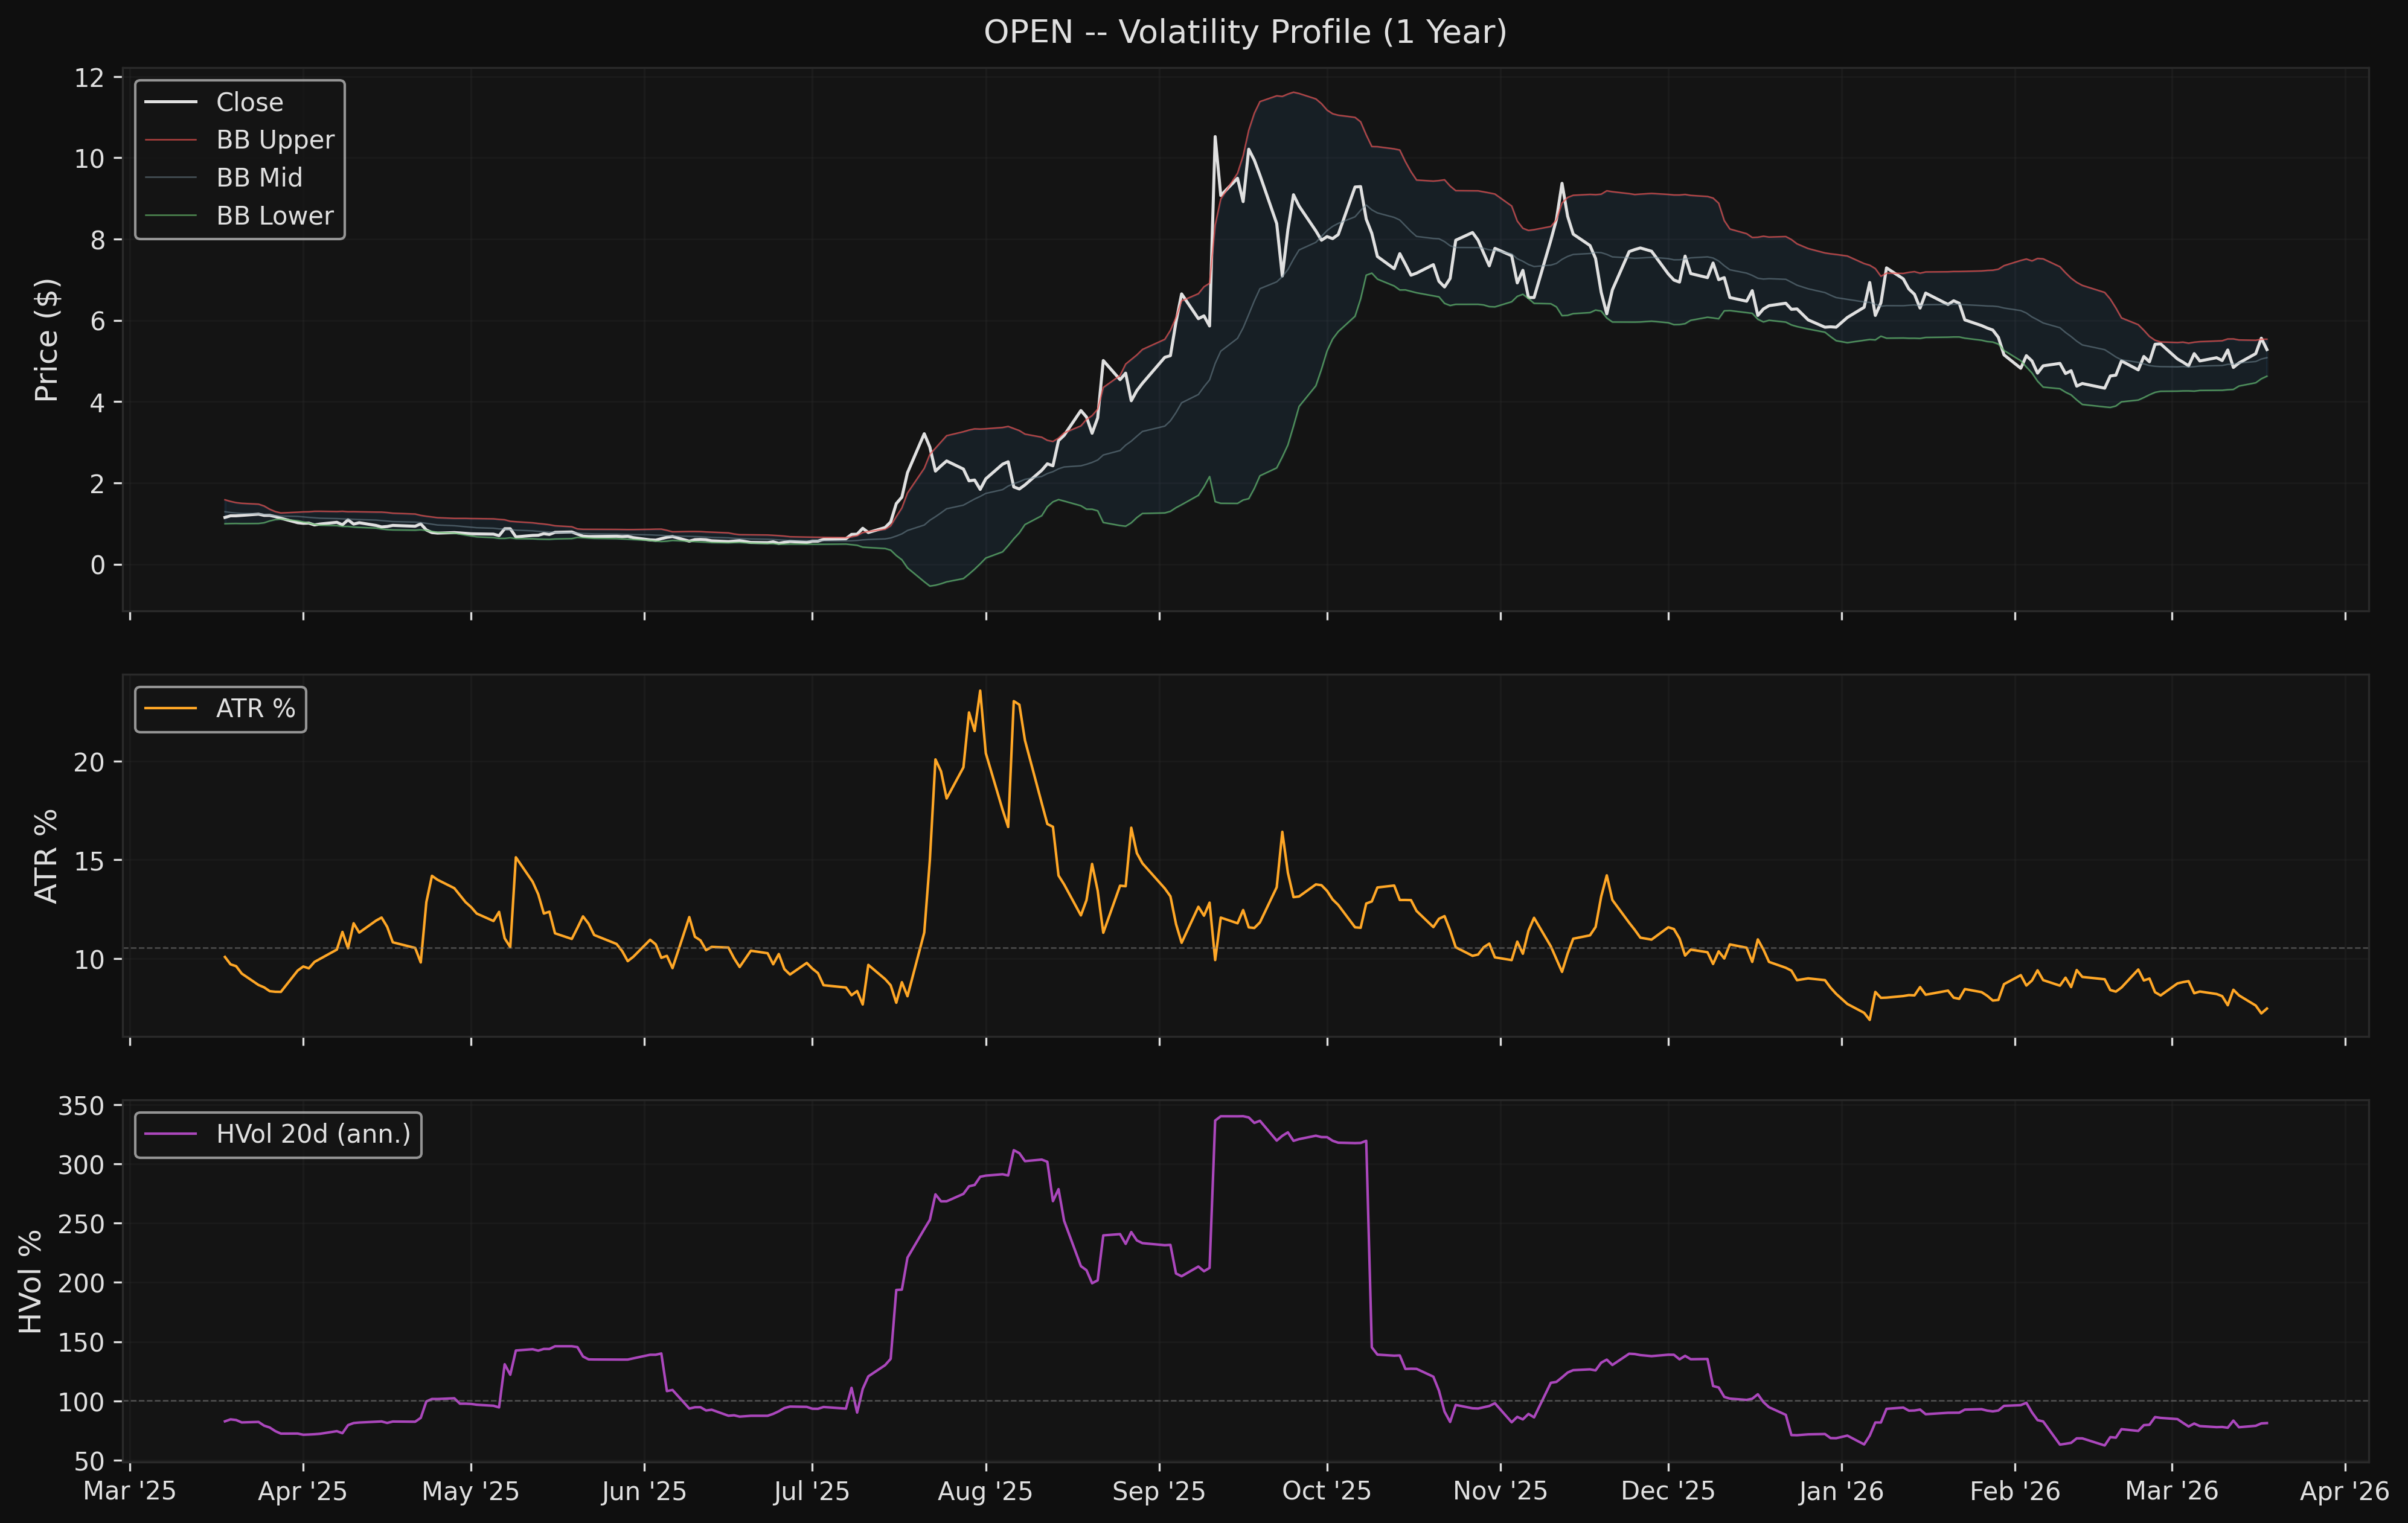
8. Volatility Profile
| Metric | Value | Percentile (1yr) |
|---|---|---|
| ATR (14) | $0.39 | -- |
| ATR % | 7.46% | -- |
| BB Width | 17.90% | 1.6th percentile |
| BB %B | 0.72 | Upper half |
| HVol 20d (annualized) | 81.3% | -- |
Return Distribution (60-day)
| Statistic | Value |
|---|---|
| Mean Daily Return | -0.162% |
| Std Daily Return | 5.094% |
| Skewness | +0.315 |
| Kurtosis | -0.188 |
| Max Drawdown (60d) | 49.68% |
The volatility profile is the most striking feature of OPEN's technicals. An annualized volatility of 81.3% and daily standard deviation of 5.1% mean that a 2-standard-deviation daily move is over 10%. This is not equity-like volatility -- it is closer to crypto or meme stock behavior.
Bollinger Band compression is notable: BB width at the 1.6th percentile of its 1-year range indicates extreme compression. This is one of the tightest BB readings in a year and historically precedes significant directional moves. The current BB %B of 0.72 shows price in the upper half of the bands, with a slight bullish bias.
ATR ratio at 0.868 is below the 0.90 squeeze threshold, confirming that volatility is compressed relative to its own recent history. This squeeze condition combined with the BB compression creates a potential breakout setup -- the question is direction.
Return distribution is slightly positively skewed (+0.315), which is favorable (larger positive moves than negative), with near-normal kurtosis (-0.188, slight platykurtic). The 60-day max drawdown of 49.68% underscores the extreme risk.
9. Entry Point Assessment
Entry zones ranked by risk/reward, accounting for OPEN's extreme volatility.
Zone 1: Pullback to SMA 200 / $5.00 Support (Primary)
| Parameter | Value |
|---|---|
| Entry Range | $5.00 - $5.16 |
| Target | $5.69 (Fib 50%) |
| Stop Loss | $4.47 (Fib 61.8%) |
| Reward | $0.53 - $0.69 |
| Risk | $0.53 - $0.69 |
| R:R | ~1.0:1 |
| Confluence | SMA 200, round $5.00, EMA 21 |
This is the highest-confluence entry but offers only breakeven R:R due to the wide distance between support and resistance levels.
Zone 2: Breakout Above SMA 50 / Fib 50% ($5.44 - $5.69)
| Parameter | Value |
|---|---|
| Entry | Close above $5.69 |
| Target | $6.91 (Fib 38.2%) |
| Stop Loss | $5.28 (current price zone) |
| Reward | $1.22 |
| Risk | $0.41 |
| R:R | 2.98:1 |
| Confluence | Breakout above falling SMA 50 + Fib 50% |
This is the best R:R setup but requires waiting for confirmation. A close above $5.69 with volume > 50M (above 20d average) would confirm the breakout.
Zone 3: Aggressive Accumulation Near Fib 61.8% ($4.47)
| Parameter | Value |
|---|---|
| Entry Range | $4.40 - $4.60 |
| Target | $5.69 (Fib 50%) |
| Stop Loss | $3.50 |
| Reward | $1.09 - $1.29 |
| Risk | $0.90 - $1.10 |
| R:R | ~1.2:1 |
| Confluence | Fib 61.8%, below round $4.50 |
Higher risk entry for a deeper pullback scenario. Only suitable for traders willing to accept the extreme volatility profile.
10. Risk/Reward Framework
Scenario 1: Bullish -- Recovery Continues (40% probability)
- Trigger: Price reclaims SMA 50 ($5.44) and closes above Fib 50% ($5.69)
- Target 1: $6.91 (Fib 38.2%) -- +30.9% from current
- Target 2: $8.42 (Fib 23.6%) -- +59.5% from current
- Stop: $4.47 (Fib 61.8%) -- -15.3% from current
- R:R to Target 1: 2.0:1
- Supporting evidence: Positive OBV divergence, MACD bullish crossover, BB squeeze suggesting imminent move, rising SMA 200
Scenario 2: Bearish -- Markdown Resumes (35% probability)
- Trigger: Price breaks below SMA 200 ($5.16) and closes below $5.00
- Target 1: $4.47 (Fib 61.8%) -- -15.3% from current
- Target 2: $3.50 (round number / prior support) -- -33.7% from current
- Stop (for shorts): $5.69 (Fib 50%) -- +7.8% from current
- R:R to Target 1: 1.98:1 (short side)
- Supporting evidence: Falling SMA 50 approaching death cross, 6-month decline of -48%, deeply negative A/D line
Scenario 3: Neutral -- Range-Bound (25% probability)
- Range: $4.50 - $5.70 for 4-8 weeks
- Implication: Wait for directional confirmation before committing
- Supporting evidence: RSI at neutral 52, conflicting MA signals, mid-range position in 52wk range
11. Key Levels Summary
| Level | Price | Type | Significance |
|---|---|---|---|
| Fib 23.6% | $8.42 | Resistance | Major -- requires trend reversal |
| Fib 38.2% | $6.91 | Resistance | Bull target 1, major structural |
| SMA 100 | $6.27 | Resistance | Intermediate declining MA |
| 20-Day High | $5.67 | Resistance | Near-term breakout trigger |
| Fib 50.0% | $5.69 | Resistance | Key -- recovery validation level |
| SMA 50 | $5.44 | Resistance | Dynamic, falling (-8.4% slope) |
| Current | $5.28 | -- | -- |
| SMA 200 | $5.16 | Support | Dynamic, rising (+8.8% slope) |
| EMA 21 | $5.13 | Support | Short-term dynamic support |
| Round $5.00 | $5.00 | Support | Psychological |
| 20-Day Low | $4.48 | Support | Near-term breakdown level |
| Fib 61.8% | $4.47 | Support | Critical -- recovery failure below |
| Round $3.50 | $3.50 | Support | Prior congestion zone |
| Fib 78.6% | $2.73 | Support | Extreme downside target |
12. Overall Technical Score
| Component | Score | Weight | Weighted |
|---|---|---|---|
| Trend Alignment | 5.0 | 25% | 1.25 |
| Momentum | 6.0 | 20% | 1.20 |
| Volume Confirmation | 6.0 | 20% | 1.20 |
| Volatility Profile | 5.5 | 15% | 0.83 |
| Market Structure | 5.0 | 20% | 1.00 |
| TOTAL | -- | 100% | 5.5 |
Overall Score: 5.5/10 -- Neutral
The 5.5 score reflects a stock that is neither clearly bullish nor bearish. Short-term momentum indicators (MACD crossover, improving RSI) are constructive, but they are offset by the damaged intermediate-term trend (falling SMA 50, price below SMA 100) and extreme volatility. The stock needs to reclaim the SMA 50 at $5.44 and ideally the Fib 50% at $5.69 to shift the bias to bullish.
Scoring Rationale by Component
- Trend (5.0): Price above short EMAs and SMA 200 but below SMA 50 and SMA 100. Mixed signals cancel out.
- Momentum (6.0): MACD bullish crossover with expanding histogram is the primary positive. RSI neutral at 52, stochastic approaching overbought zone keeps this from scoring higher.
- Volume (6.0): Positive OBV divergence is constructive. Volume declining on down days is favorable. A/D line structural negative tempers the score.
- Volatility (5.5): BB squeeze at 1.6th percentile is a potential catalyst, but 81.3% annualized HVol is extreme and demands reduced position sizing.
- Structure (5.0): Mid-range 52wk position, 60-day markdown trend, but potential accumulation via OBV. No clear Wyckoff phase confirmation.
13. Limitations
-
Extreme volatility distorts traditional TA. With daily moves of 5%+ being routine, standard indicator thresholds (RSI 30/70, etc.) are less reliable. OPEN behaves more like a speculative/meme stock than a traditional equity.
-
Price history context. OPEN went public via SPAC in late 2020 and has traded from $0.51 to $35+. The stock's entire trading history has been characterized by extreme volatility, making it difficult to establish reliable support/resistance levels from historical price action.
-
52-week range distortion. The $0.51 low and $10.87 high create a massive range, making Fibonacci levels very wide. Each Fibonacci level is separated by $1.50+, which means the "significance" of any single level is lower than for a stock with a tighter range.
-
Fundamental sensitivity. OPEN (Opendoor, iBuyer real estate) is highly sensitive to interest rates, housing market conditions, and operating metrics. Technical analysis alone cannot capture the fundamental risks that drive this stock's extreme moves.
-
Low conviction on direction. The neutral score (5.5) reflects genuine uncertainty. The technical evidence is balanced between bullish (MACD crossover, OBV divergence, BB squeeze) and bearish (falling SMA 50, 6-month decline, extreme volatility) signals. Waiting for confirmation is the prudent approach.
-
Position sizing imperative. Given the 81.3% annualized volatility, any position in OPEN should be sized at 30-50% of what would be used for a typical equity position. A 2x ATR stop ($0.79) represents 15% of the stock price.
Appendix A: Models & Configuration
Data Source
| Field | Value |
|---|---|
| Ticker | OPEN |
| Source File | data-samples/ohlcv/OPEN.csv |
| Date Range | 2020-06-18 to 2026-03-18 |
| Bar Count | 1,444 |
| Benchmark | N/A |
| Comparables | N/A |
Indicator Configuration
| Indicator | Parameters | Library/Source |
|---|---|---|
| SMA | 10, 20, 50, 100, 200 | pandas rolling |
| EMA | 12, 21, 50 | pandas ewm |
| RSI | 14-period, Wilder smoothing | pandas ewm (alpha=1/14) |
| MACD | 12, 26, 9 | pandas ewm |
| Stochastic | 14, 3, 3 (%K, %K smooth, %D) | pandas rolling |
| ATR | 14-period, Wilder smoothing | pandas ewm |
| Bollinger Bands | 20-period, 2 std dev | pandas rolling |
| OBV | Cumulative volume direction | Manual cumsum |
| A/D Line | CLV * Volume cumsum | Manual calc |
| ATR Ratio | ATR(14) / SMA(ATR, 50) | Custom |
| HVol | 20-day rolling std * sqrt(252) | pandas rolling |
| Fibonacci | 252-day swing high/low | Manual |
Script
Analysis script: analysis/quant-research/scripts/OPEN-technical-2026-03-18.py
Charts