OPEN
Conviction 3OPEN — Combined Deep Dive Assessment
Date: 2026-03-18 Asset Class: Equity Ticker: OPEN (Opendoor Technologies)
Fundamental Summary
| Metric | Value |
|---|---|
| Overall Score | 33/100 |
| Verdict | AVOID |
| Red Flags | 5 HIGH |
The Market Analyst scored OPEN at 33/100 with an AVOID verdict, triggered three ways: (1) overall score below 40, (2) Earnings component 18 below 20 minimum, (3) 2+ HIGH flags with at least one Hidden/Undisclosed. Key red flags: revenue declining 3 consecutive years with no GAAP profitability ever; stock at 3.4x analyst median target ($1.60) with 0% Buy / 75% Sell ratings; $933M shareholder wealth destruction disguised as "non-cash" debt extinguishment; 207M share (27%) dilution overhang from $1.57 convertible notes; and iBuying model graveyard (Zillow and Redfin both failed).
Technical Summary
| Metric | Value |
|---|---|
| Overall Score | 5.5/10 |
| Bias | Neutral |
| Red Flags | 4 (2 HIGH, 2 MEDIUM) |
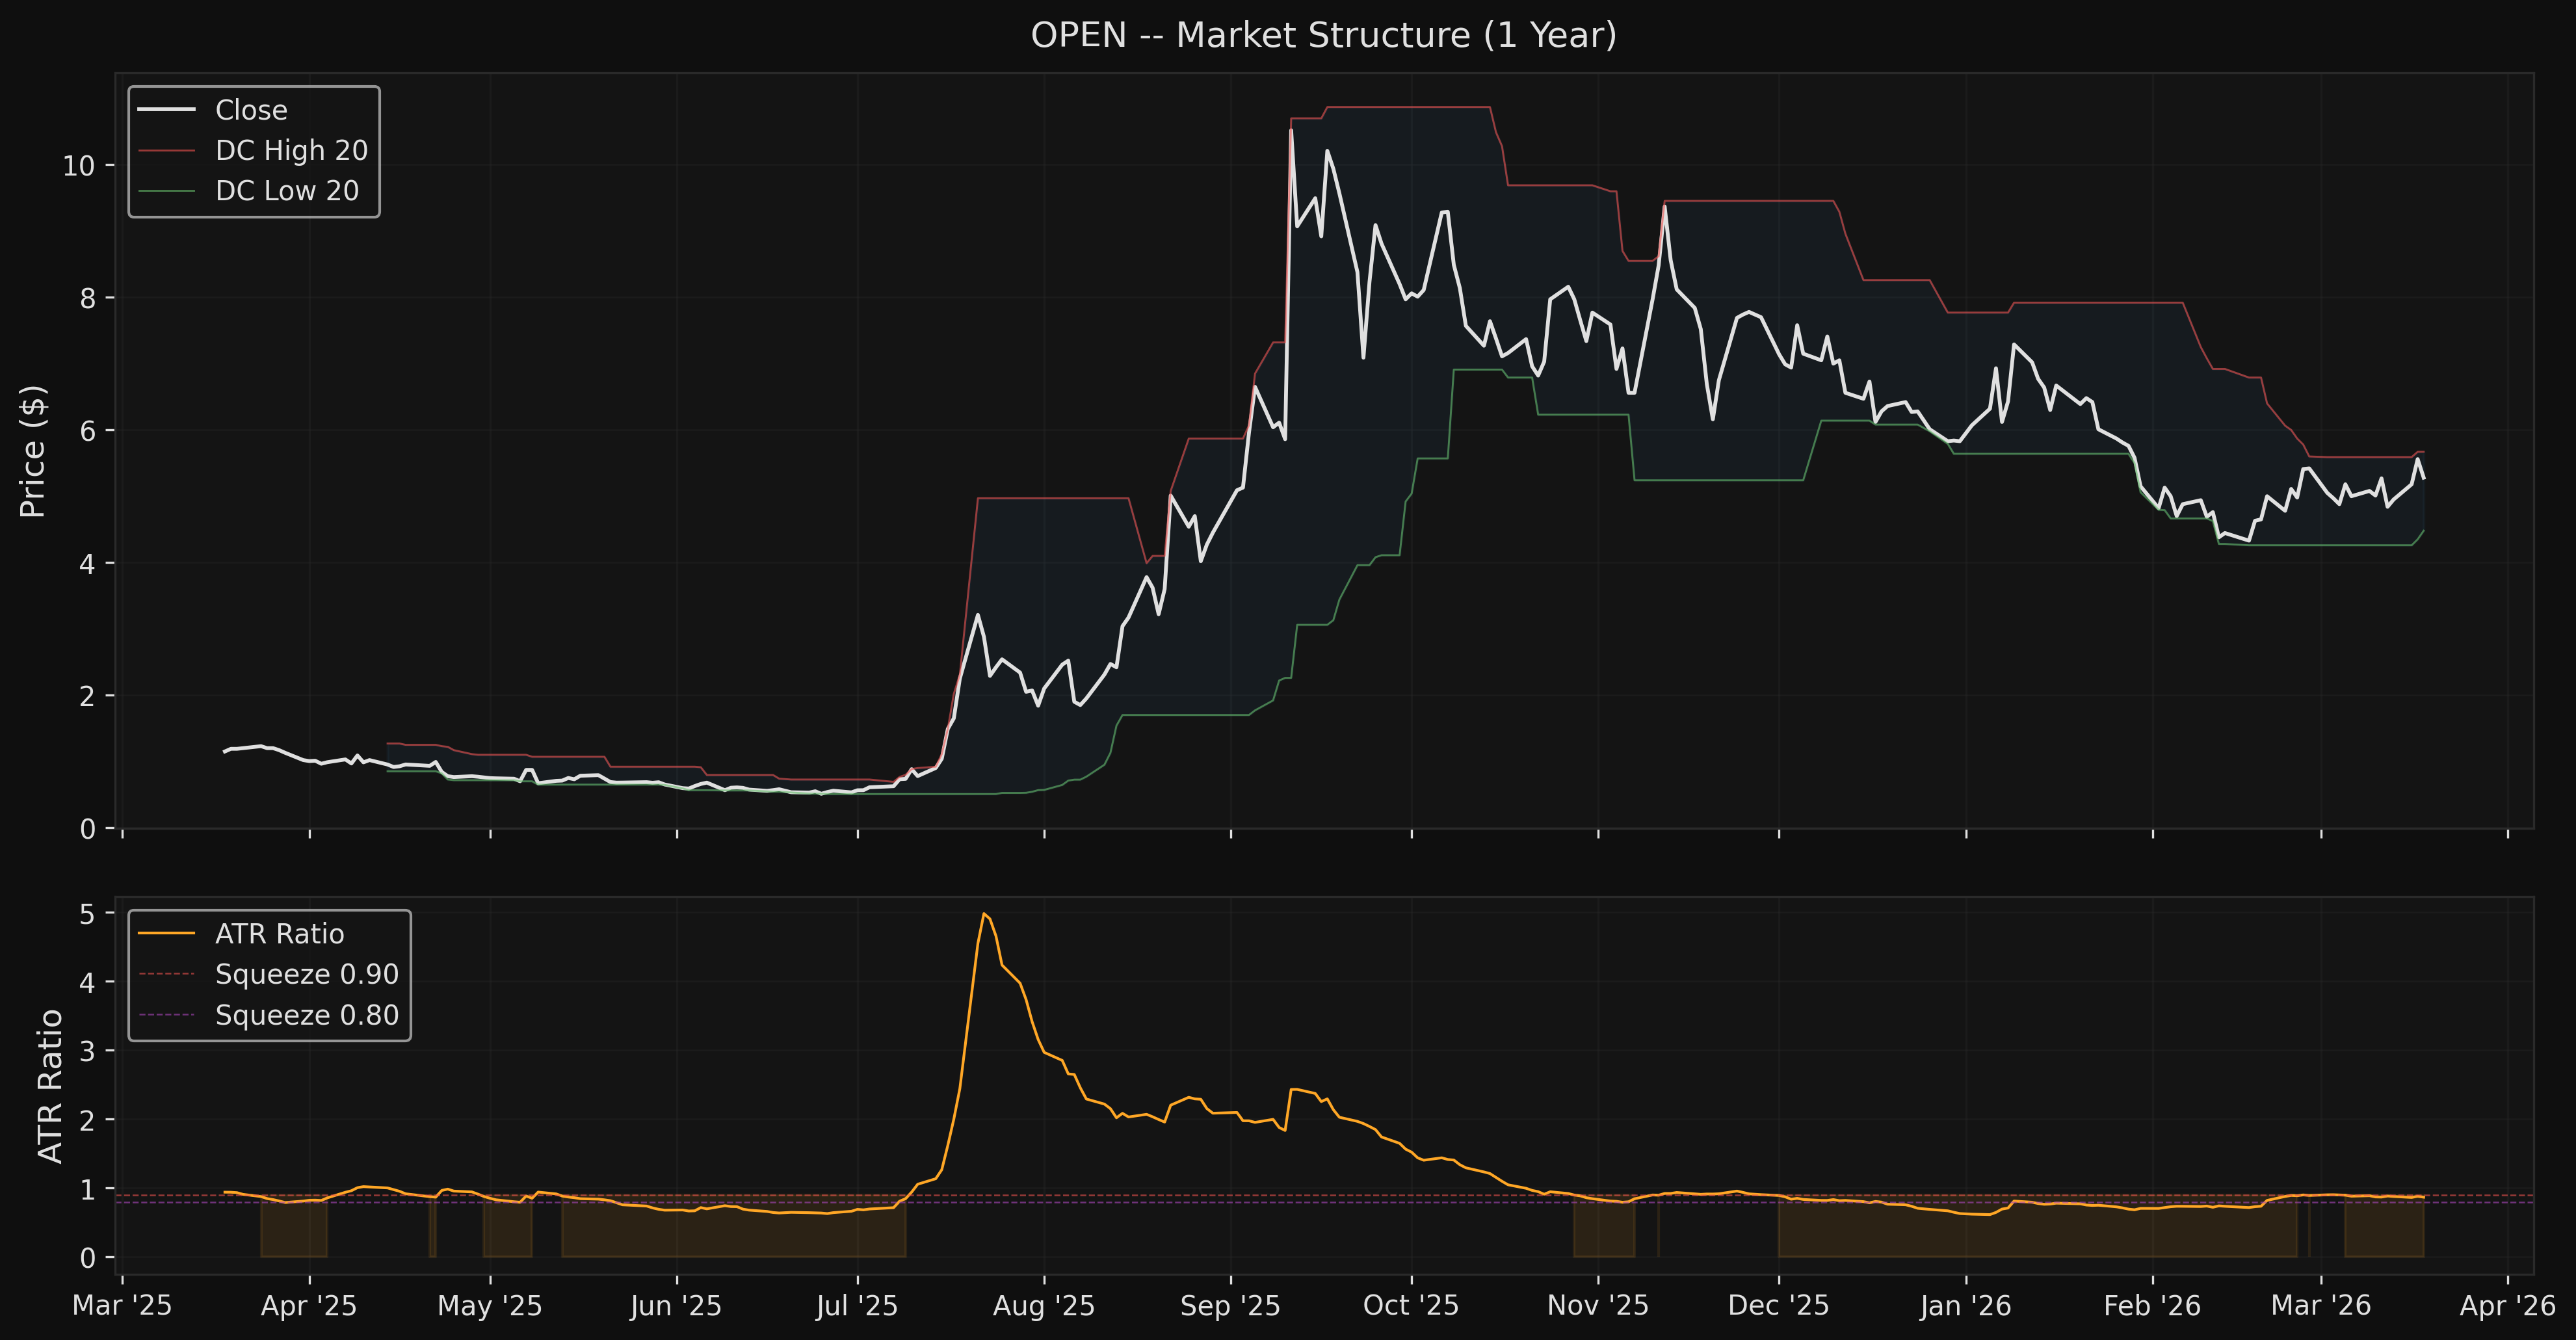
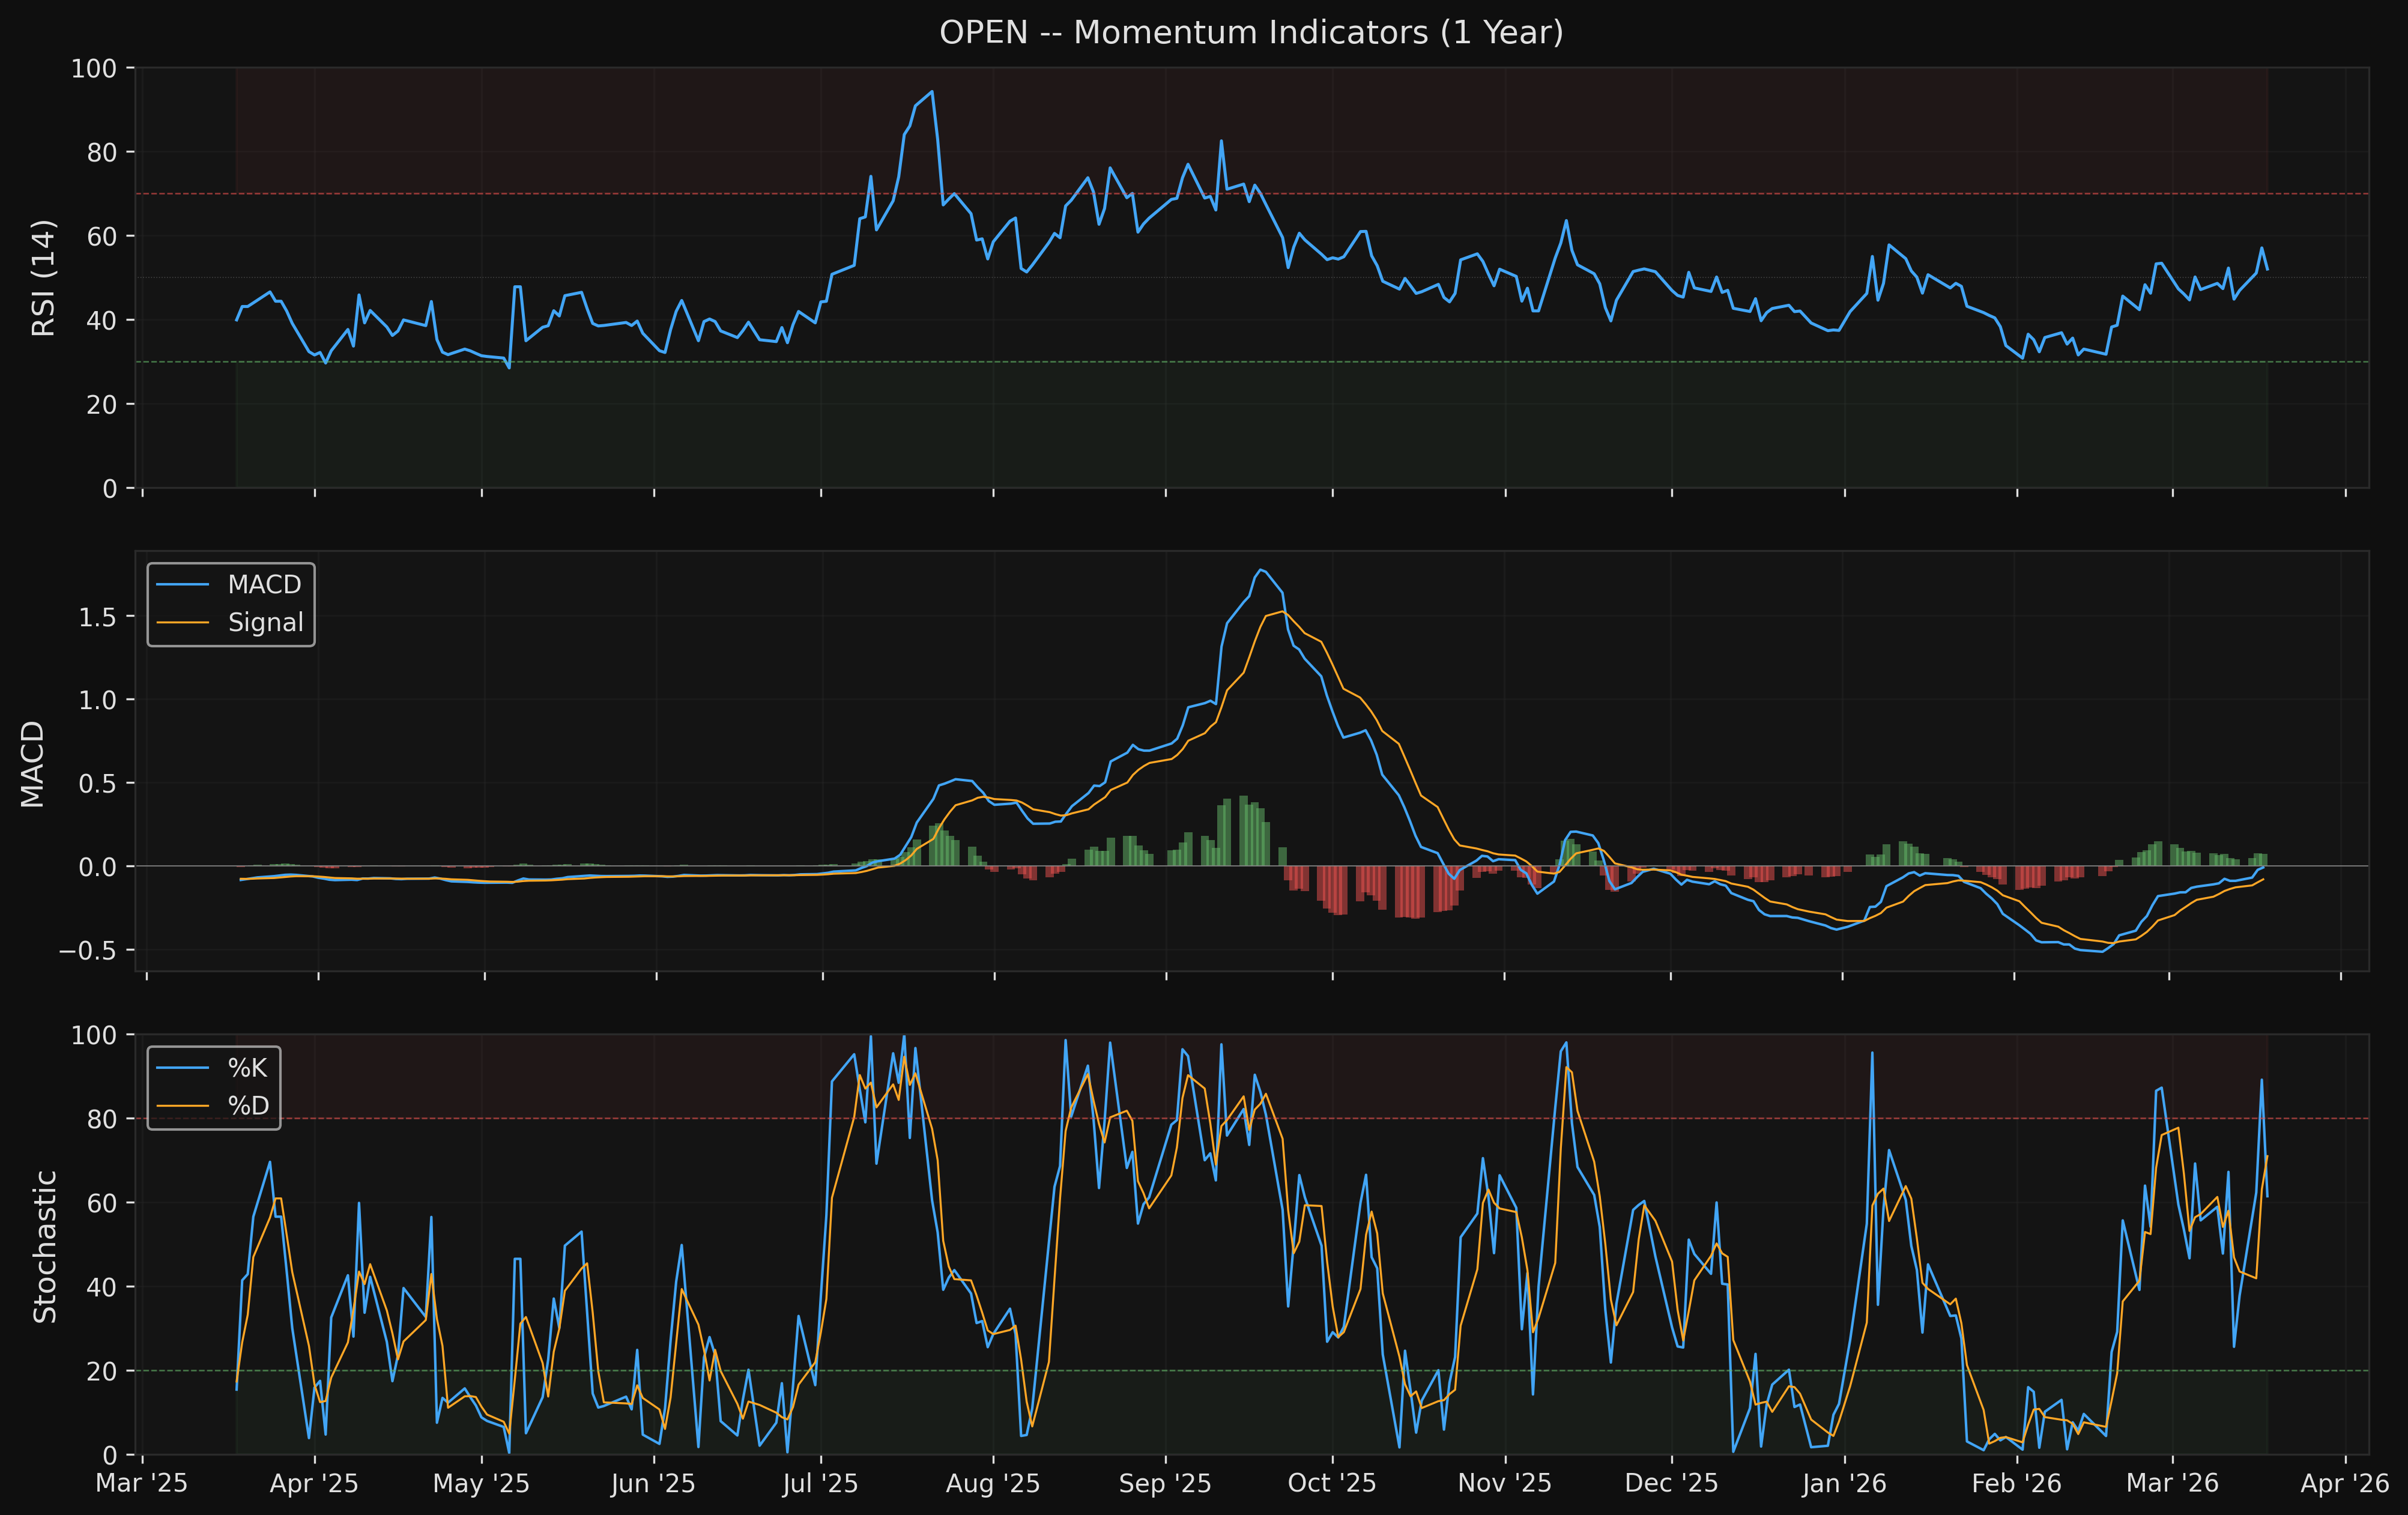
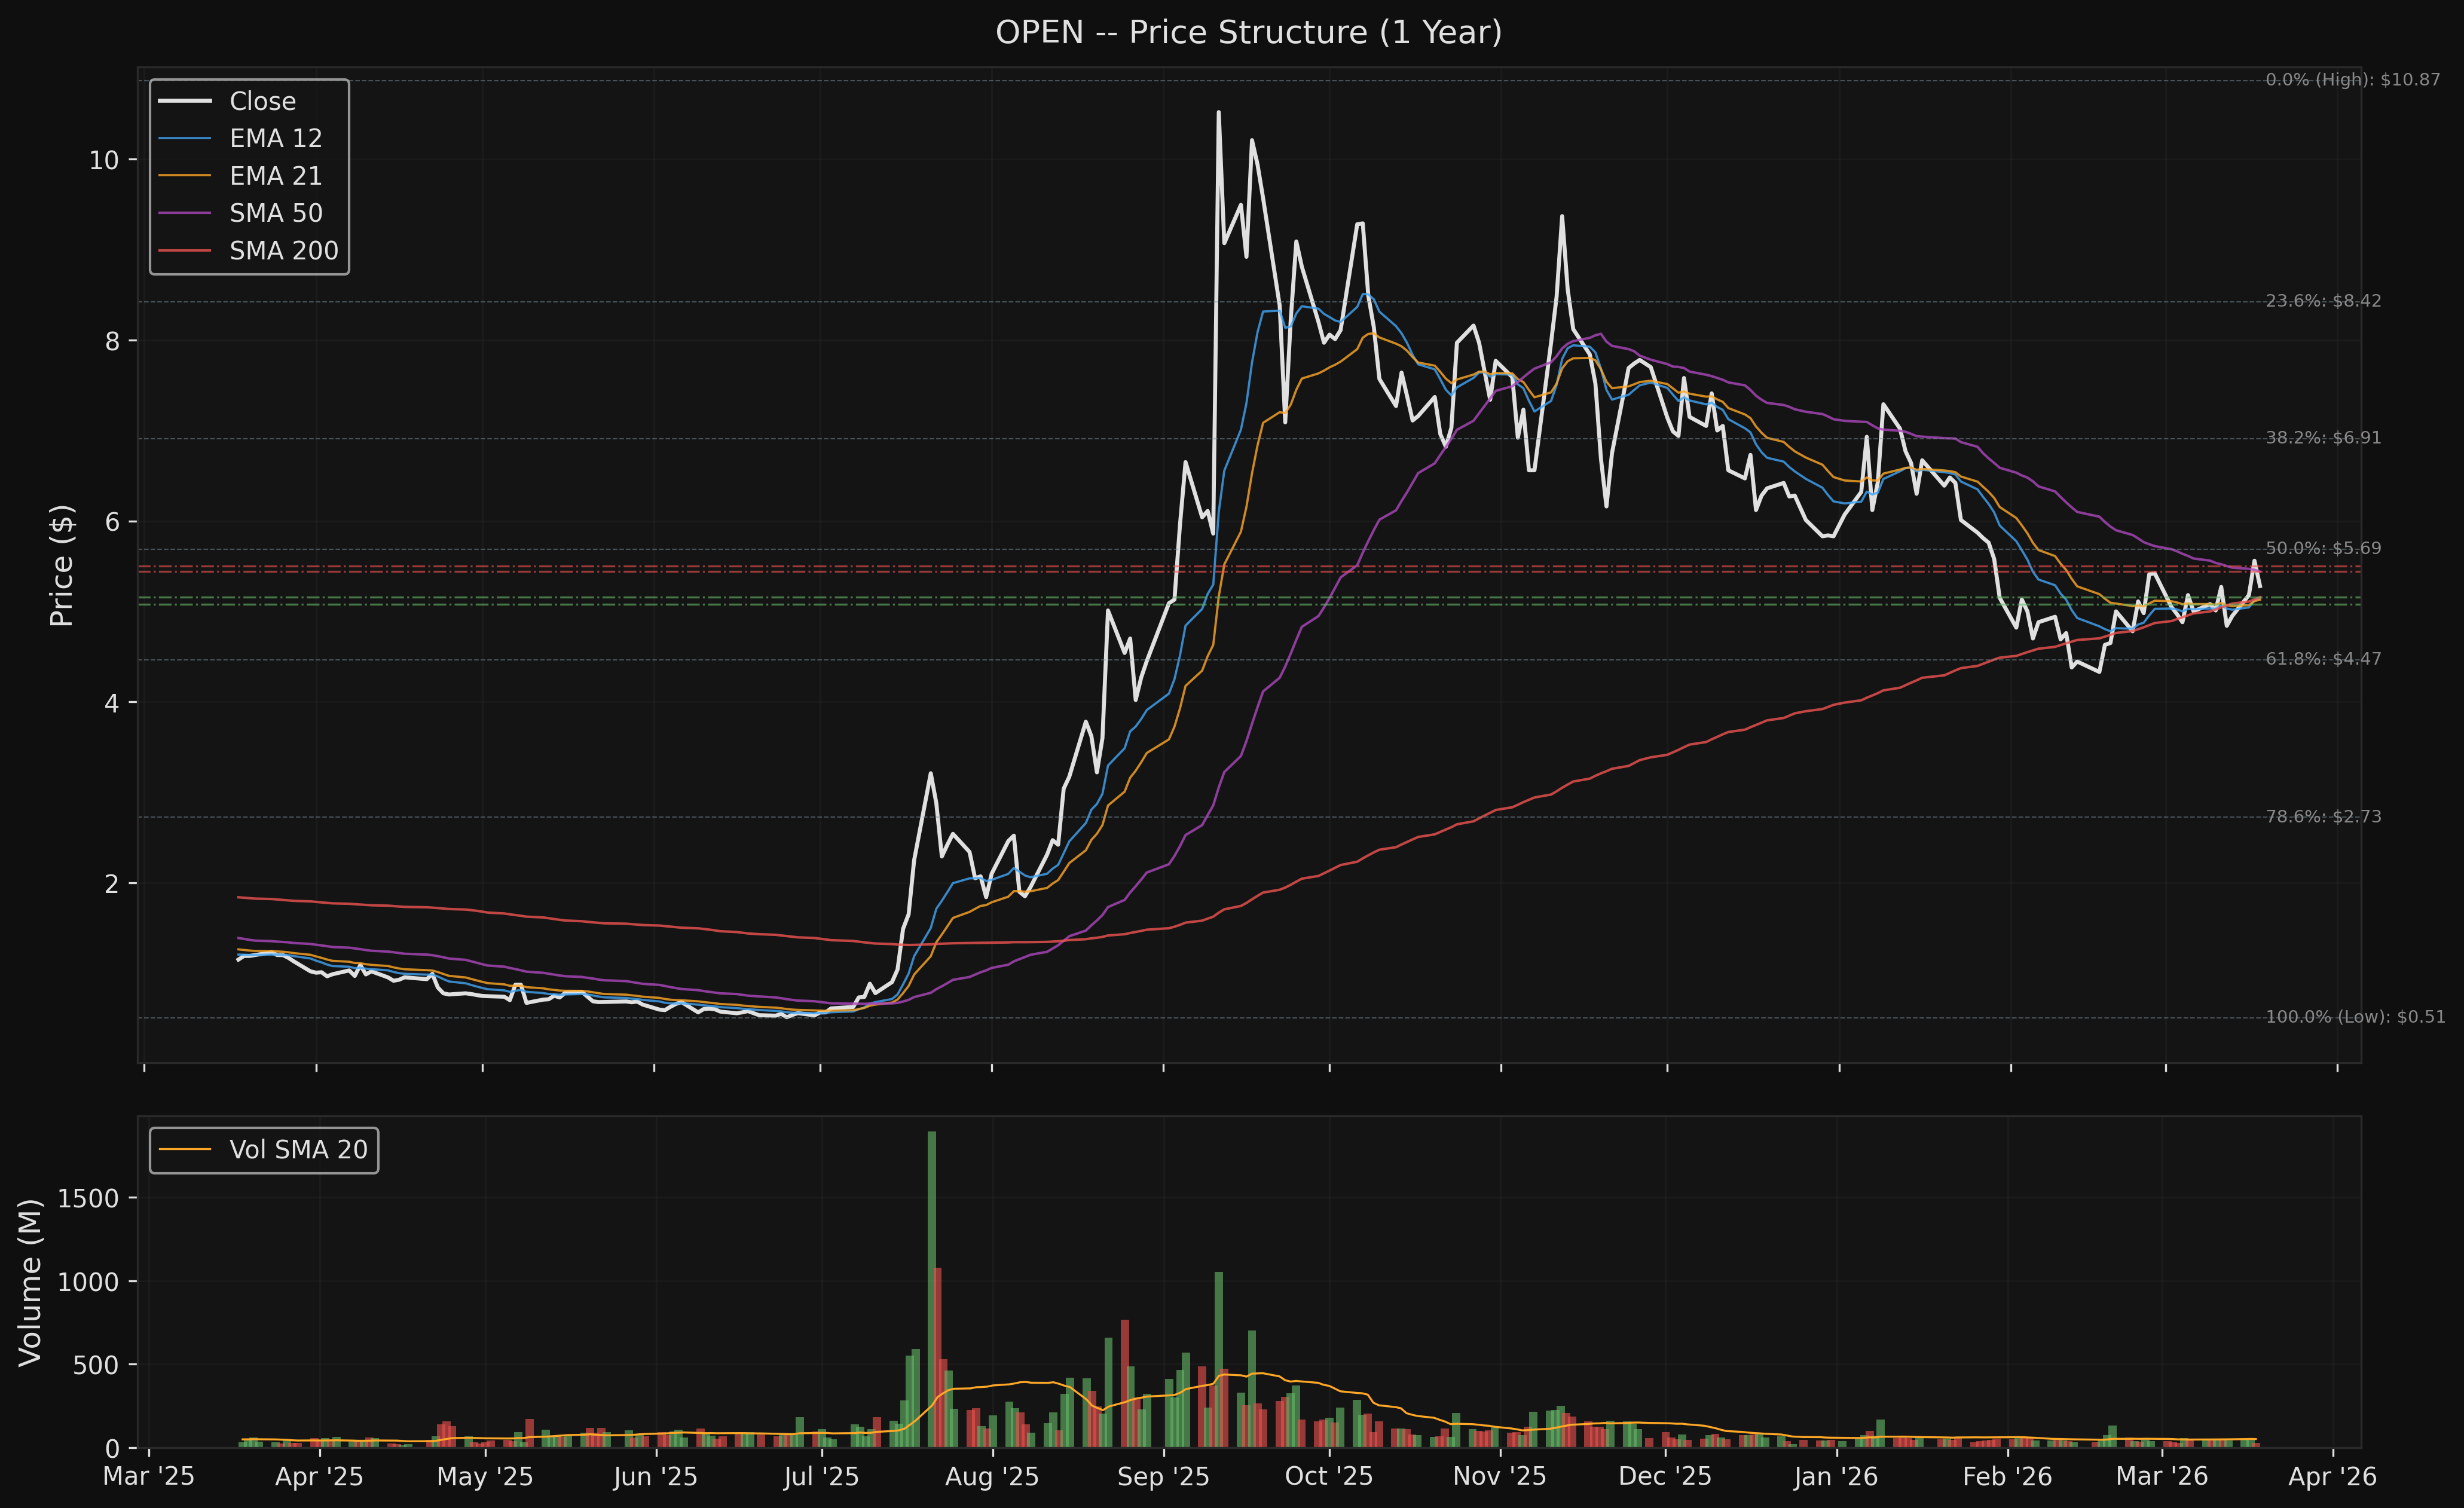
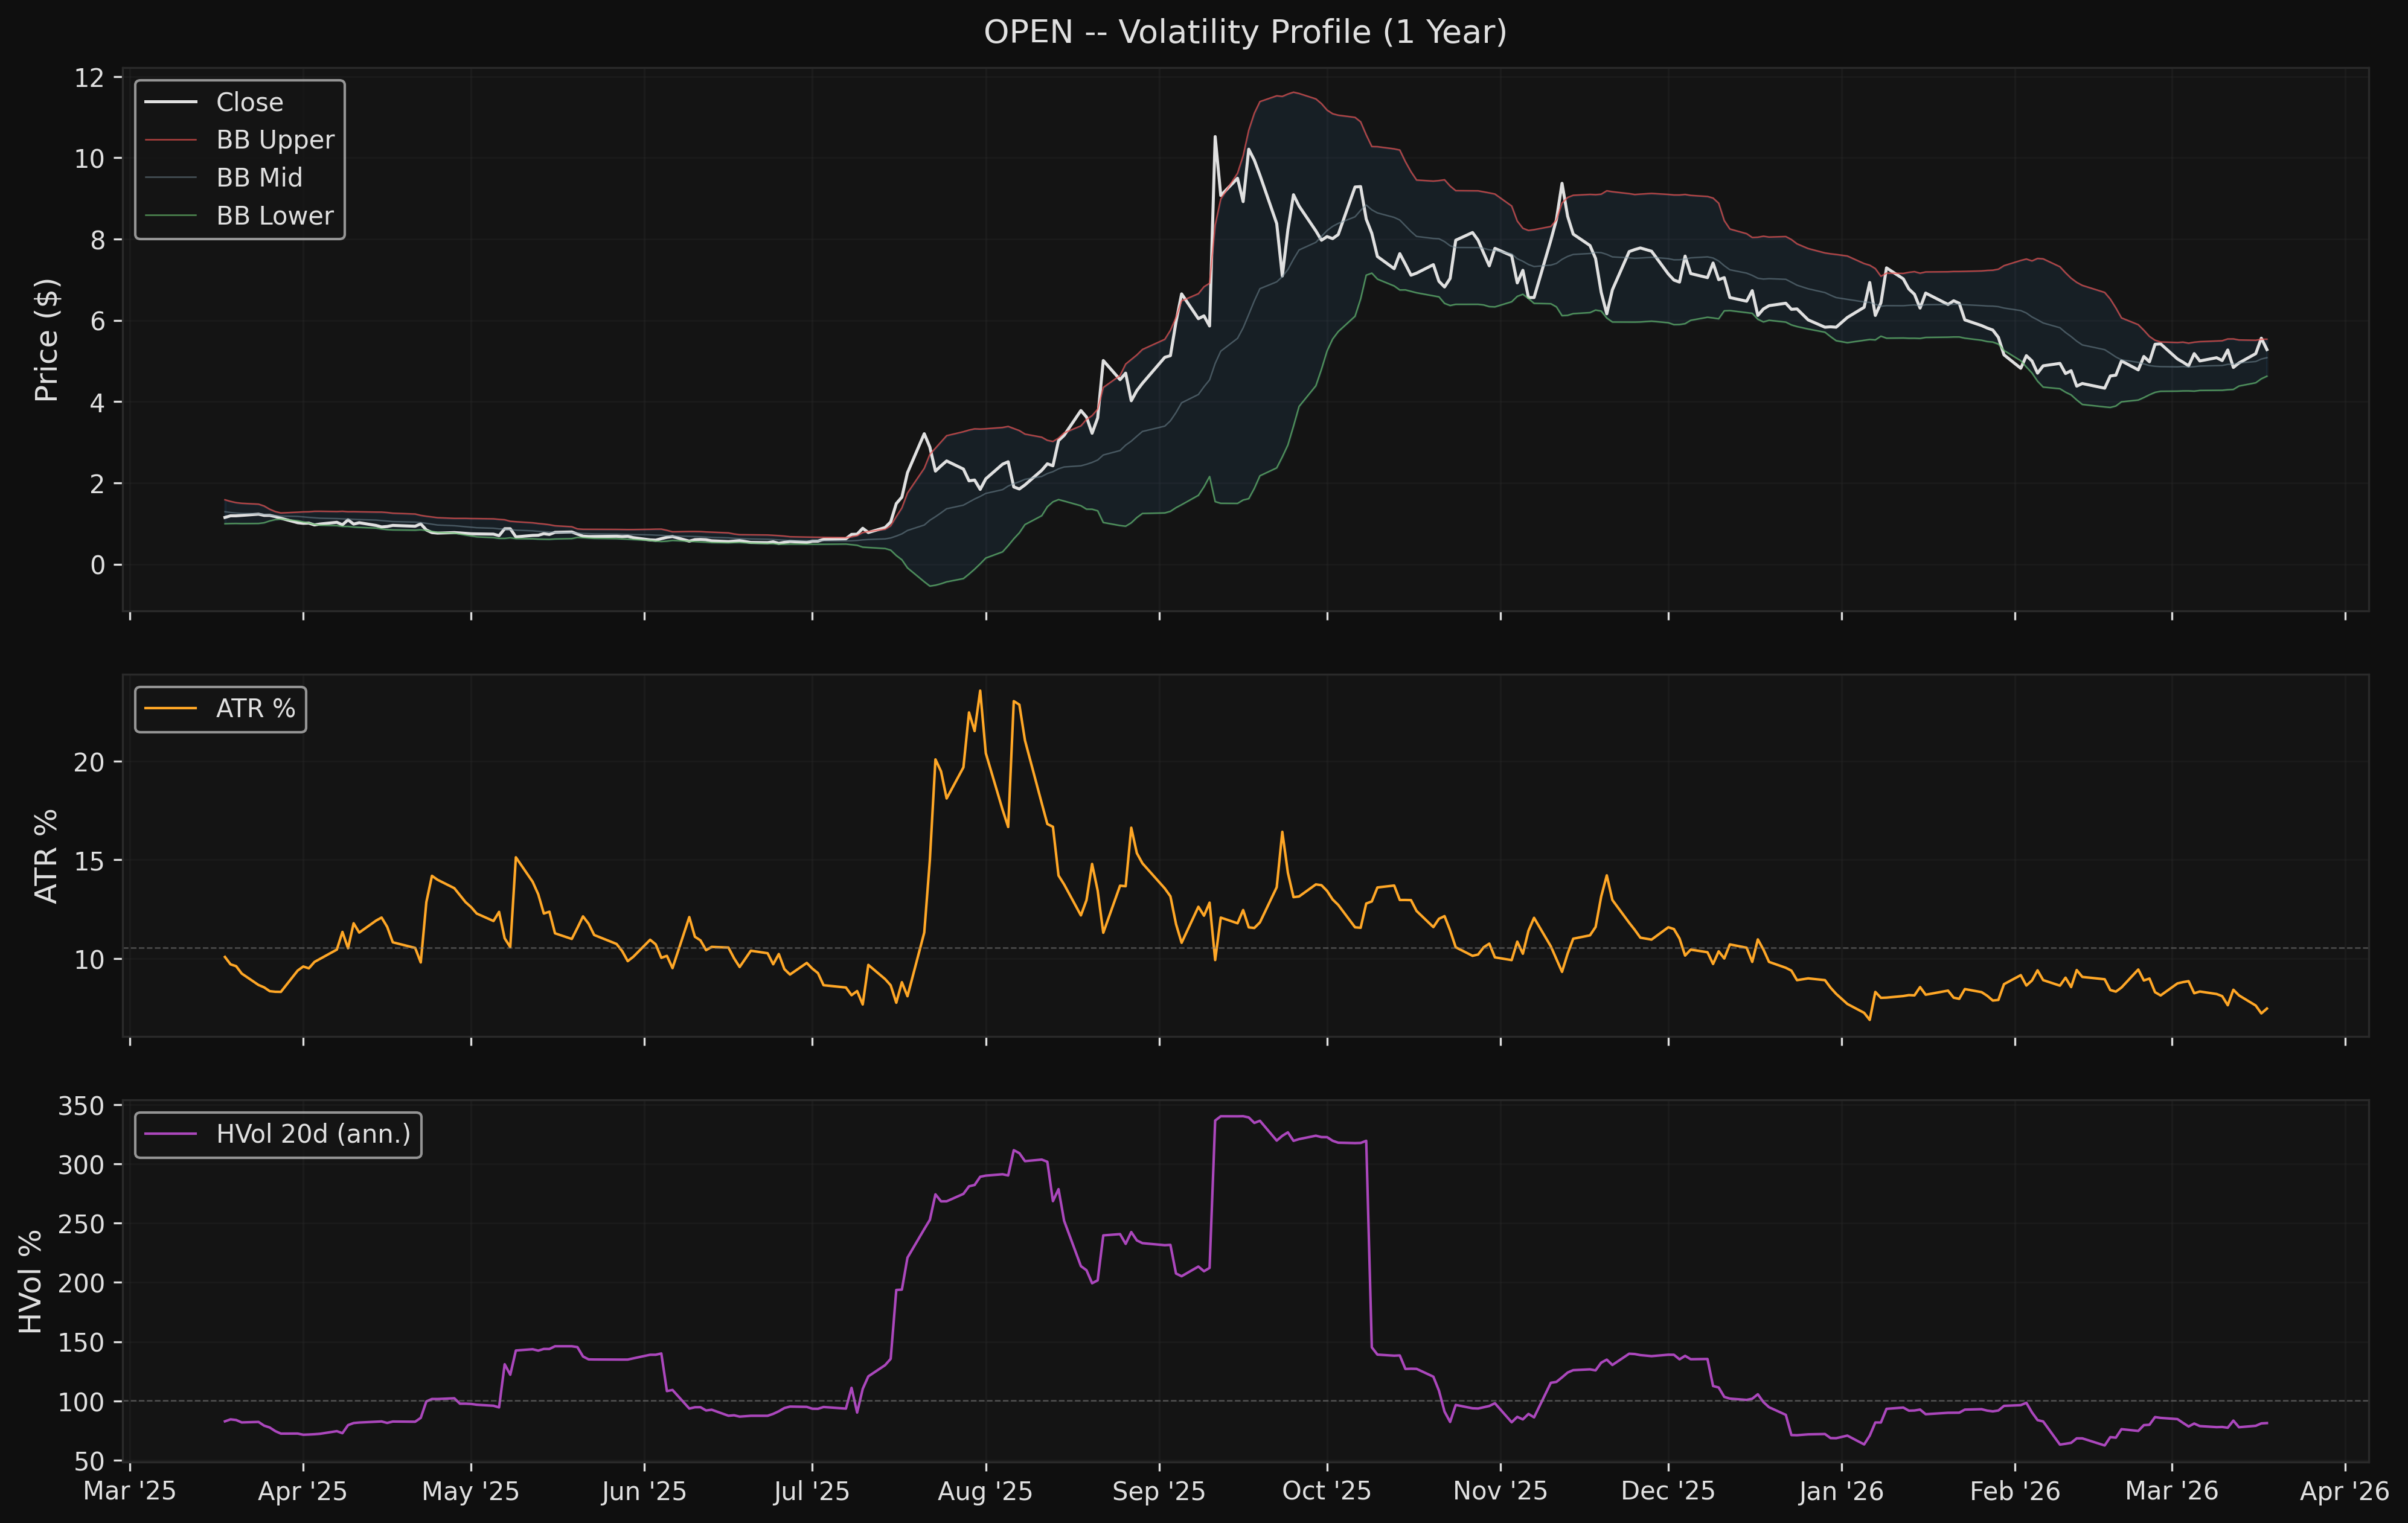
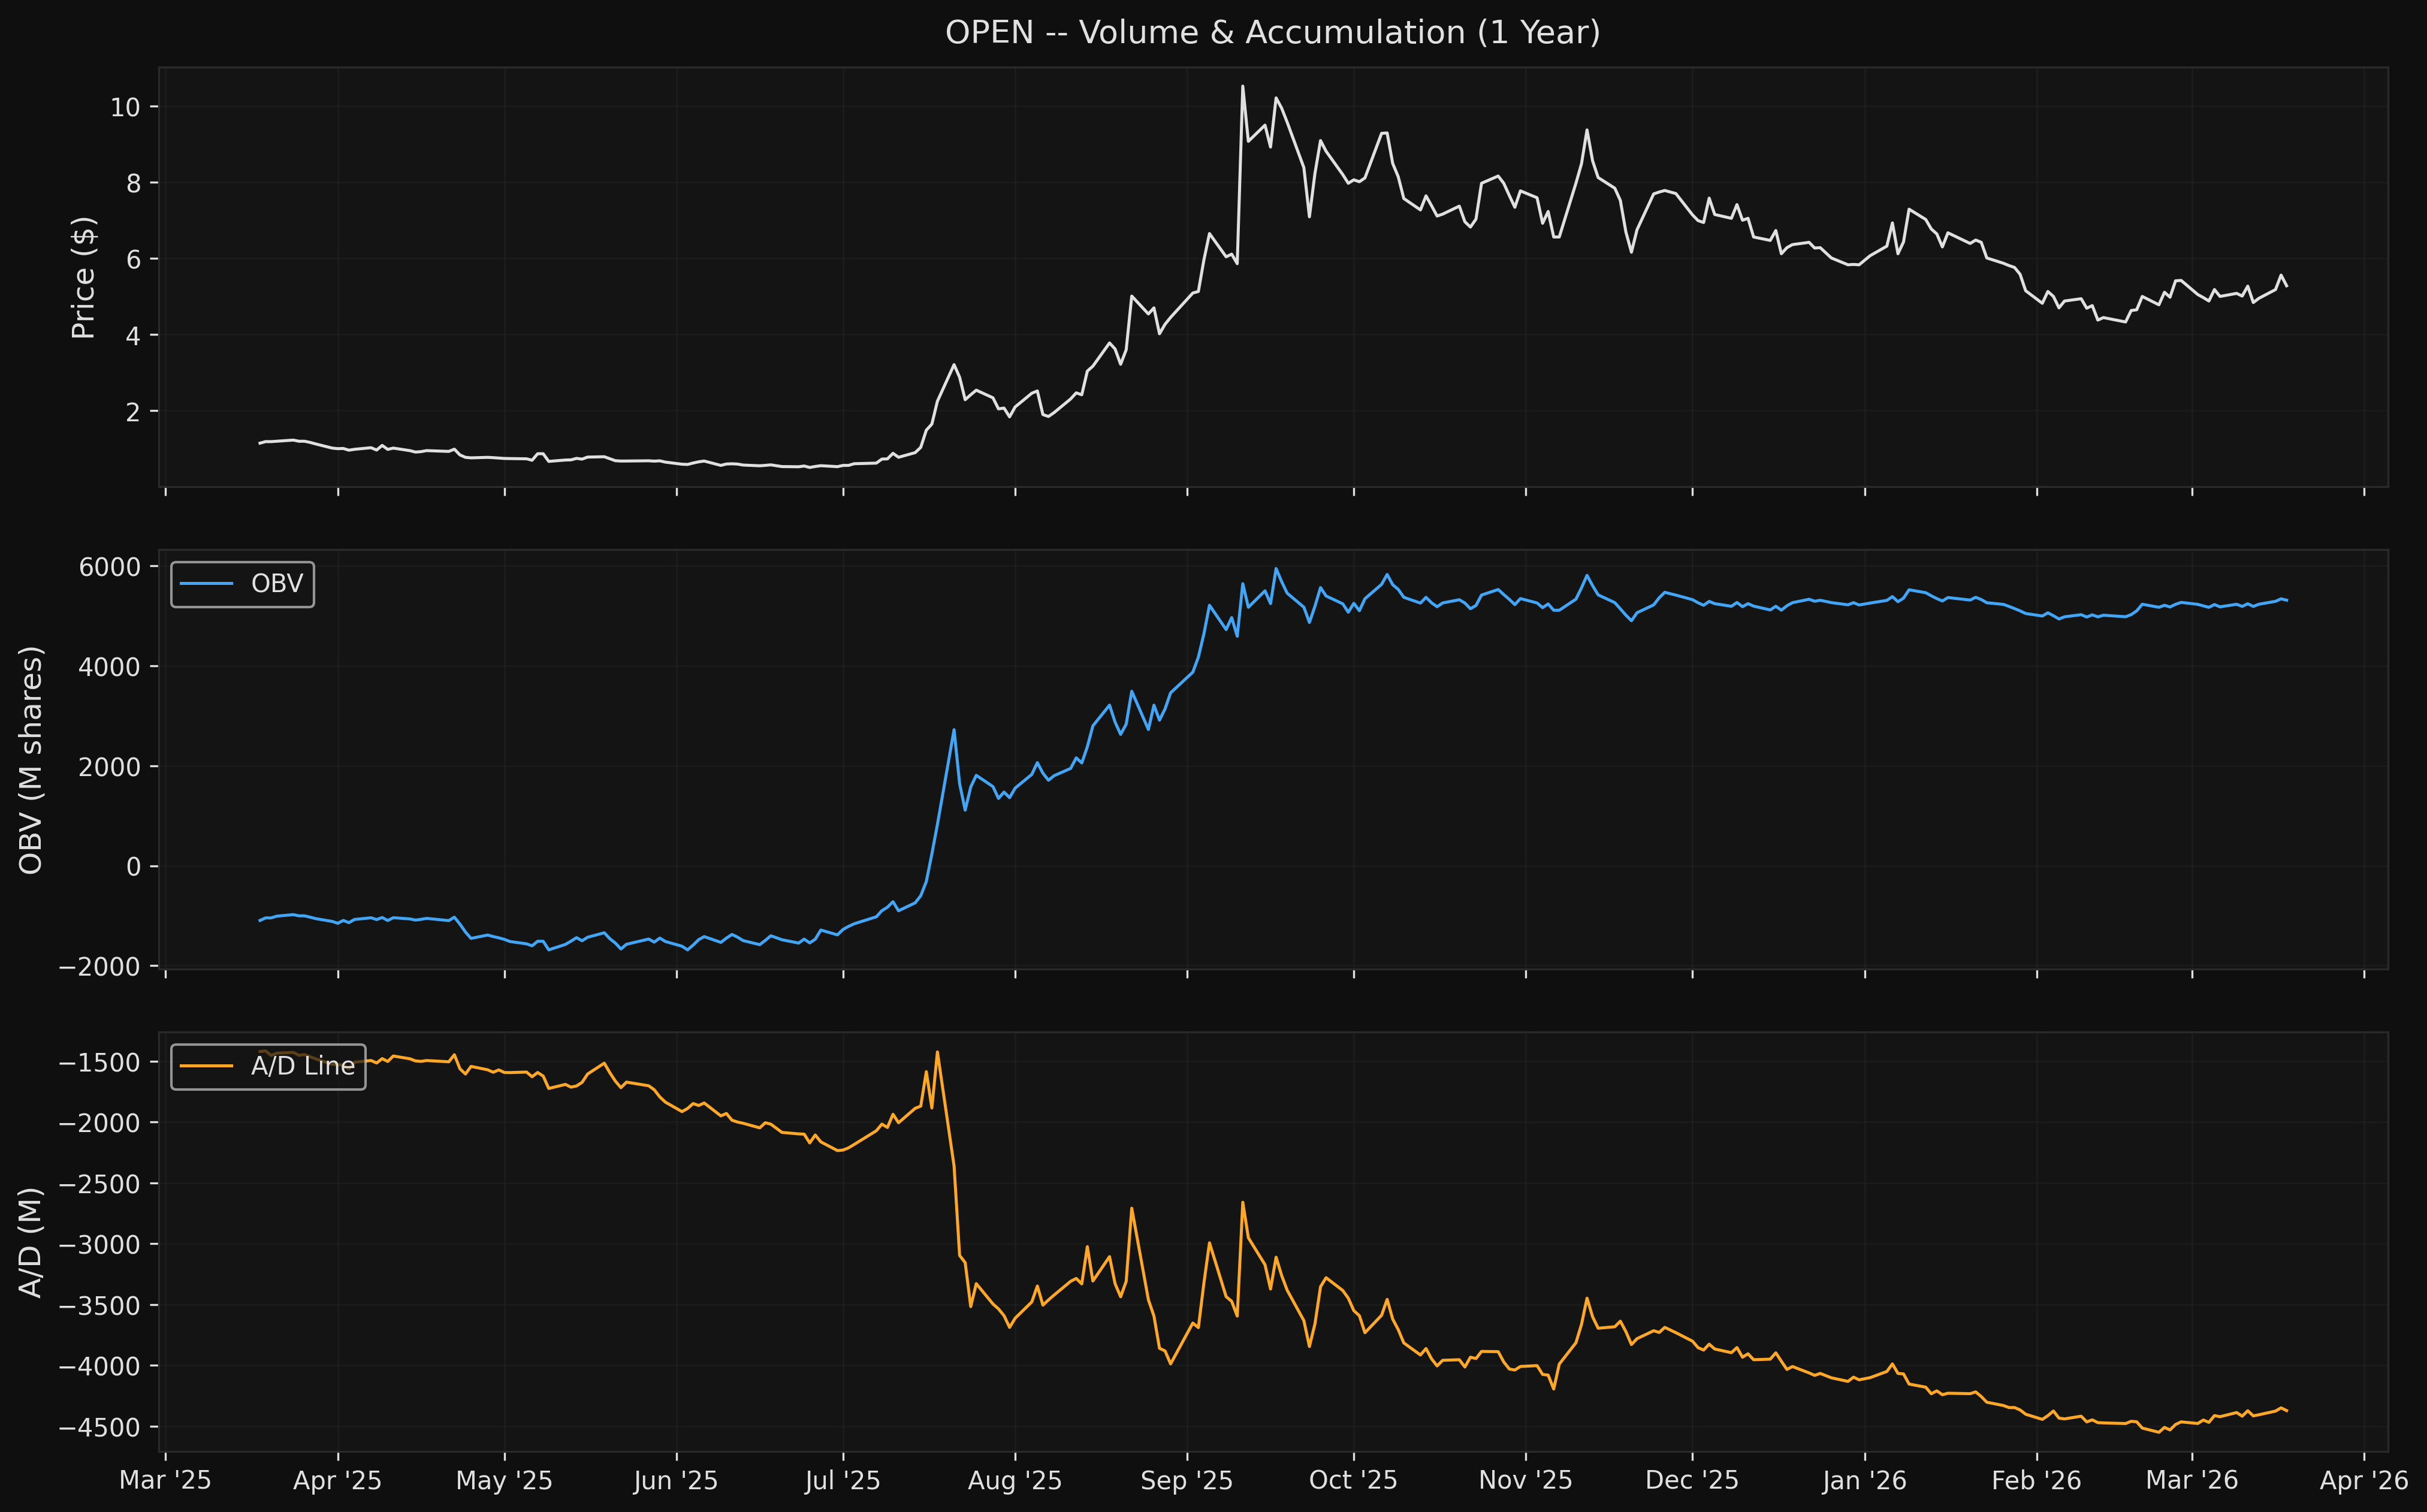
The Quant Researcher scored OPEN at 5.5/10 with a Neutral bias. The stock is at a genuine inflection point — above SMA 200 ($5.16) but below falling SMA 50 ($5.44). Momentum is improving (MACD bullish crossover, RSI 52). Bollinger Band width at 1.6th percentile signals extreme compression — a large directional move is likely. Volume is mixed: OBV confirming but A/D line deeply negative (-4.37B). Two HIGH red flags for extreme volatility (81.3% annualized HVol, 7.46% daily ATR).
DISAGREEMENT Assessment
Fundamental-Technical Alignment: CONFLICTING
The fundamental and technical analyses arrive at meaningfully different conclusions:
-
Fundamentals say AVOID, technicals say neutral-with-upside-potential. The fundamental analysis sees a structurally broken business model (never profitable, declining revenue, massive dilution). The technical analysis sees a stock that has bounced hard off extreme lows, is in a volatility squeeze, and could break out above $5.69 Fib 50%.
-
Risk framing diverges sharply. Fundamentals assign 55% probability to the bear case ($1-2 target) and a probability-weighted expected value of $3.20 vs. current $5.28 — negative expected return. Technicals see a breakout trade with 2.98:1 R:R (entry above $5.69, target $6.91, stop $5.28).
-
The retail momentum factor. Fundamentals flag that retail frenzy is masking fundamental deterioration (0% analyst Buy ratings, 75% Sell). Technicals don't capture this sentiment risk — the OBV confirmation may reflect retail flow, not institutional conviction.
Where they agree: Both flag extreme volatility as the dominant risk factor. Both acknowledge the stock is at a critical inflection point near the SMA 200. Both agree position sizing must be minimal.
The core conflict: The technical setup (squeeze, improving momentum, SMA 200 support) is real, but it's happening in a company the fundamental analyst believes has negative expected value. This is the classic "technically interesting, fundamentally uninvestable" setup.
Key Levels
| Level | Price | Source |
|---|---|---|
| Resistance 2 | $6.91 | Technical: Fibonacci 38.2% retracement |
| Resistance 1 | $5.69 | Technical: Fibonacci 50.0% / breakout trigger |
| Current Price | $5.28 | — |
| Support 1 | $5.16 | Technical: SMA 200 |
| Support 2 | $4.47 | Technical: Fibonacci 61.8% retracement |
Risk/Reward Framework
Scenario 1: Breakout Above Fib 50% (Technical Bull)
- Entry: $5.69 (close above Fib 50% on volume)
- Target: $6.91 (Fib 38.2%)
- Stop: $5.28 (below current price)
- R:R: 2.98:1
- Probability: Low-Moderate (technical setup supports, fundamentals oppose)
Scenario 2: Fundamental Bear Case
- Entry: None (avoid)
- Target: N/A
- Stop: N/A
- Outcome: Stock reverts toward probability-weighted $3.20 expected value
- Probability: Moderate-High per fundamental analysis (55% bear, 30% base = 85% combined below current price)
Scenario 3: SMA 200 Breakdown
- Entry: Short / avoid on close below $5.00
- Target: $4.47 (Fib 61.8%), potentially $3.00 (March lows)
- Stop: $5.50
- R:R: 2.9:1 (short)
- Probability: Moderate — death cross forming (SMA 50 only $0.28 above SMA 200)
Catalyst Timeline
| Date | Event | Expected Impact |
|---|---|---|
| ~April 30 | Q1 2026 Earnings | High — profit path checkpoint |
| March-June | Spring selling season | Moderate positive (seasonal) |
| Ongoing | Mortgage rate trajectory | High — binary for iBuying model |
| Ongoing | Death cross watch | Negative — SMA 50 approaching SMA 200 |
Conviction Assessment
| Component | Value | Rationale |
|---|---|---|
| Fund-Tech Agreement | 0.6 | Conflicting — fundamentals say AVOID, technicals see potential |
| Catalyst Density | 0.6 | Moderate — Q1 earnings in ~6 weeks, housing season |
| Data Quality | 0.6 | Mid-cap with recent financials; model unproven at scale |
| Risk/Reward Asymmetry | 0.65 | Technical breakout offers 2.98:1, but fundamental EV is negative |
| Red Flag Severity | 0.1 | 5 HIGH fundamental flags, 2 Hidden/Undisclosed — severe |
Conviction Score: 3 (Moderate) Weighted Score: 56.0/100 Position Sizing: 50% of target (starter position) — but fundamental AVOID overrides
Actionable Framework
Preferred approach: DO NOT ENTER. The fundamental AVOID verdict with 5 HIGH red flags overrides the technical squeeze setup. The probability-weighted expected value ($3.20) is 39% below current price.
If you must trade it: Wait for a close above $5.69 on above-average volume. Use minimal position size (1-2% max given 81% HVol). Stop at $5.28. This is a technical-only trade against fundamental headwinds — treat it as a lottery ticket, not an investment.
What would change the thesis: - Bullish: Q1 2026 shows path to GAAP breakeven, housing market accelerates, mortgage rates drop below 5.5% - Bearish (more likely): Death cross triggers, Q1 misses, stock breaks SMA 200 at $5.16
Charts