ONDS — Technical Summary
Conviction 3ONDS -- Technical Deep Dive
===========================================================
  ONDS -- Technical Analysis                   2026-03-01
  Asset Class: Equity
  Price: $10.08  |  52wk: $0.57 - $15.28
===========================================================

  OVERALL SCORE: 6.0/10       BIAS: Neutral

  COMPONENT SCORES
  -----------------------------------------------------------
  Trend Alignment         5.8/10  wt 25%  Golden Cross, above SMA200
  Momentum                5.0/10  wt 20%  RSI neutral at 47.5, MACD recovering
  Volume Confirmation     6.5/10  wt 20%  OBV rising, up/down ratio positive
  Volatility Profile      5.8/10  wt 15%  Extreme ATR 9.5%, BB mid-band
  Market Structure        7.0/10  wt 20%  Markup phase, Fib 0.618+ zone

  KEY LEVELS
  -----------------------------------------------------------
  Resistance 2:  $15.28   52-week high
  Resistance 1:  $11.70   Clustered pivot resistance
  Current Price: $10.08
  Support 1:     $8.32    Nearest clustered support
  Support 2:     $7.28    Secondary support cluster

  RED FLAGS                                    (2 found)
  -----------------------------------------------------------
  MEDIUM  Elevated ATR of 9.5% indicates high daily swings [Volatility]
  HIGH    ATR/Price ratio of 9.5% may indicate wide spreads [Volatility]

===========================================================
2. Executive Summary
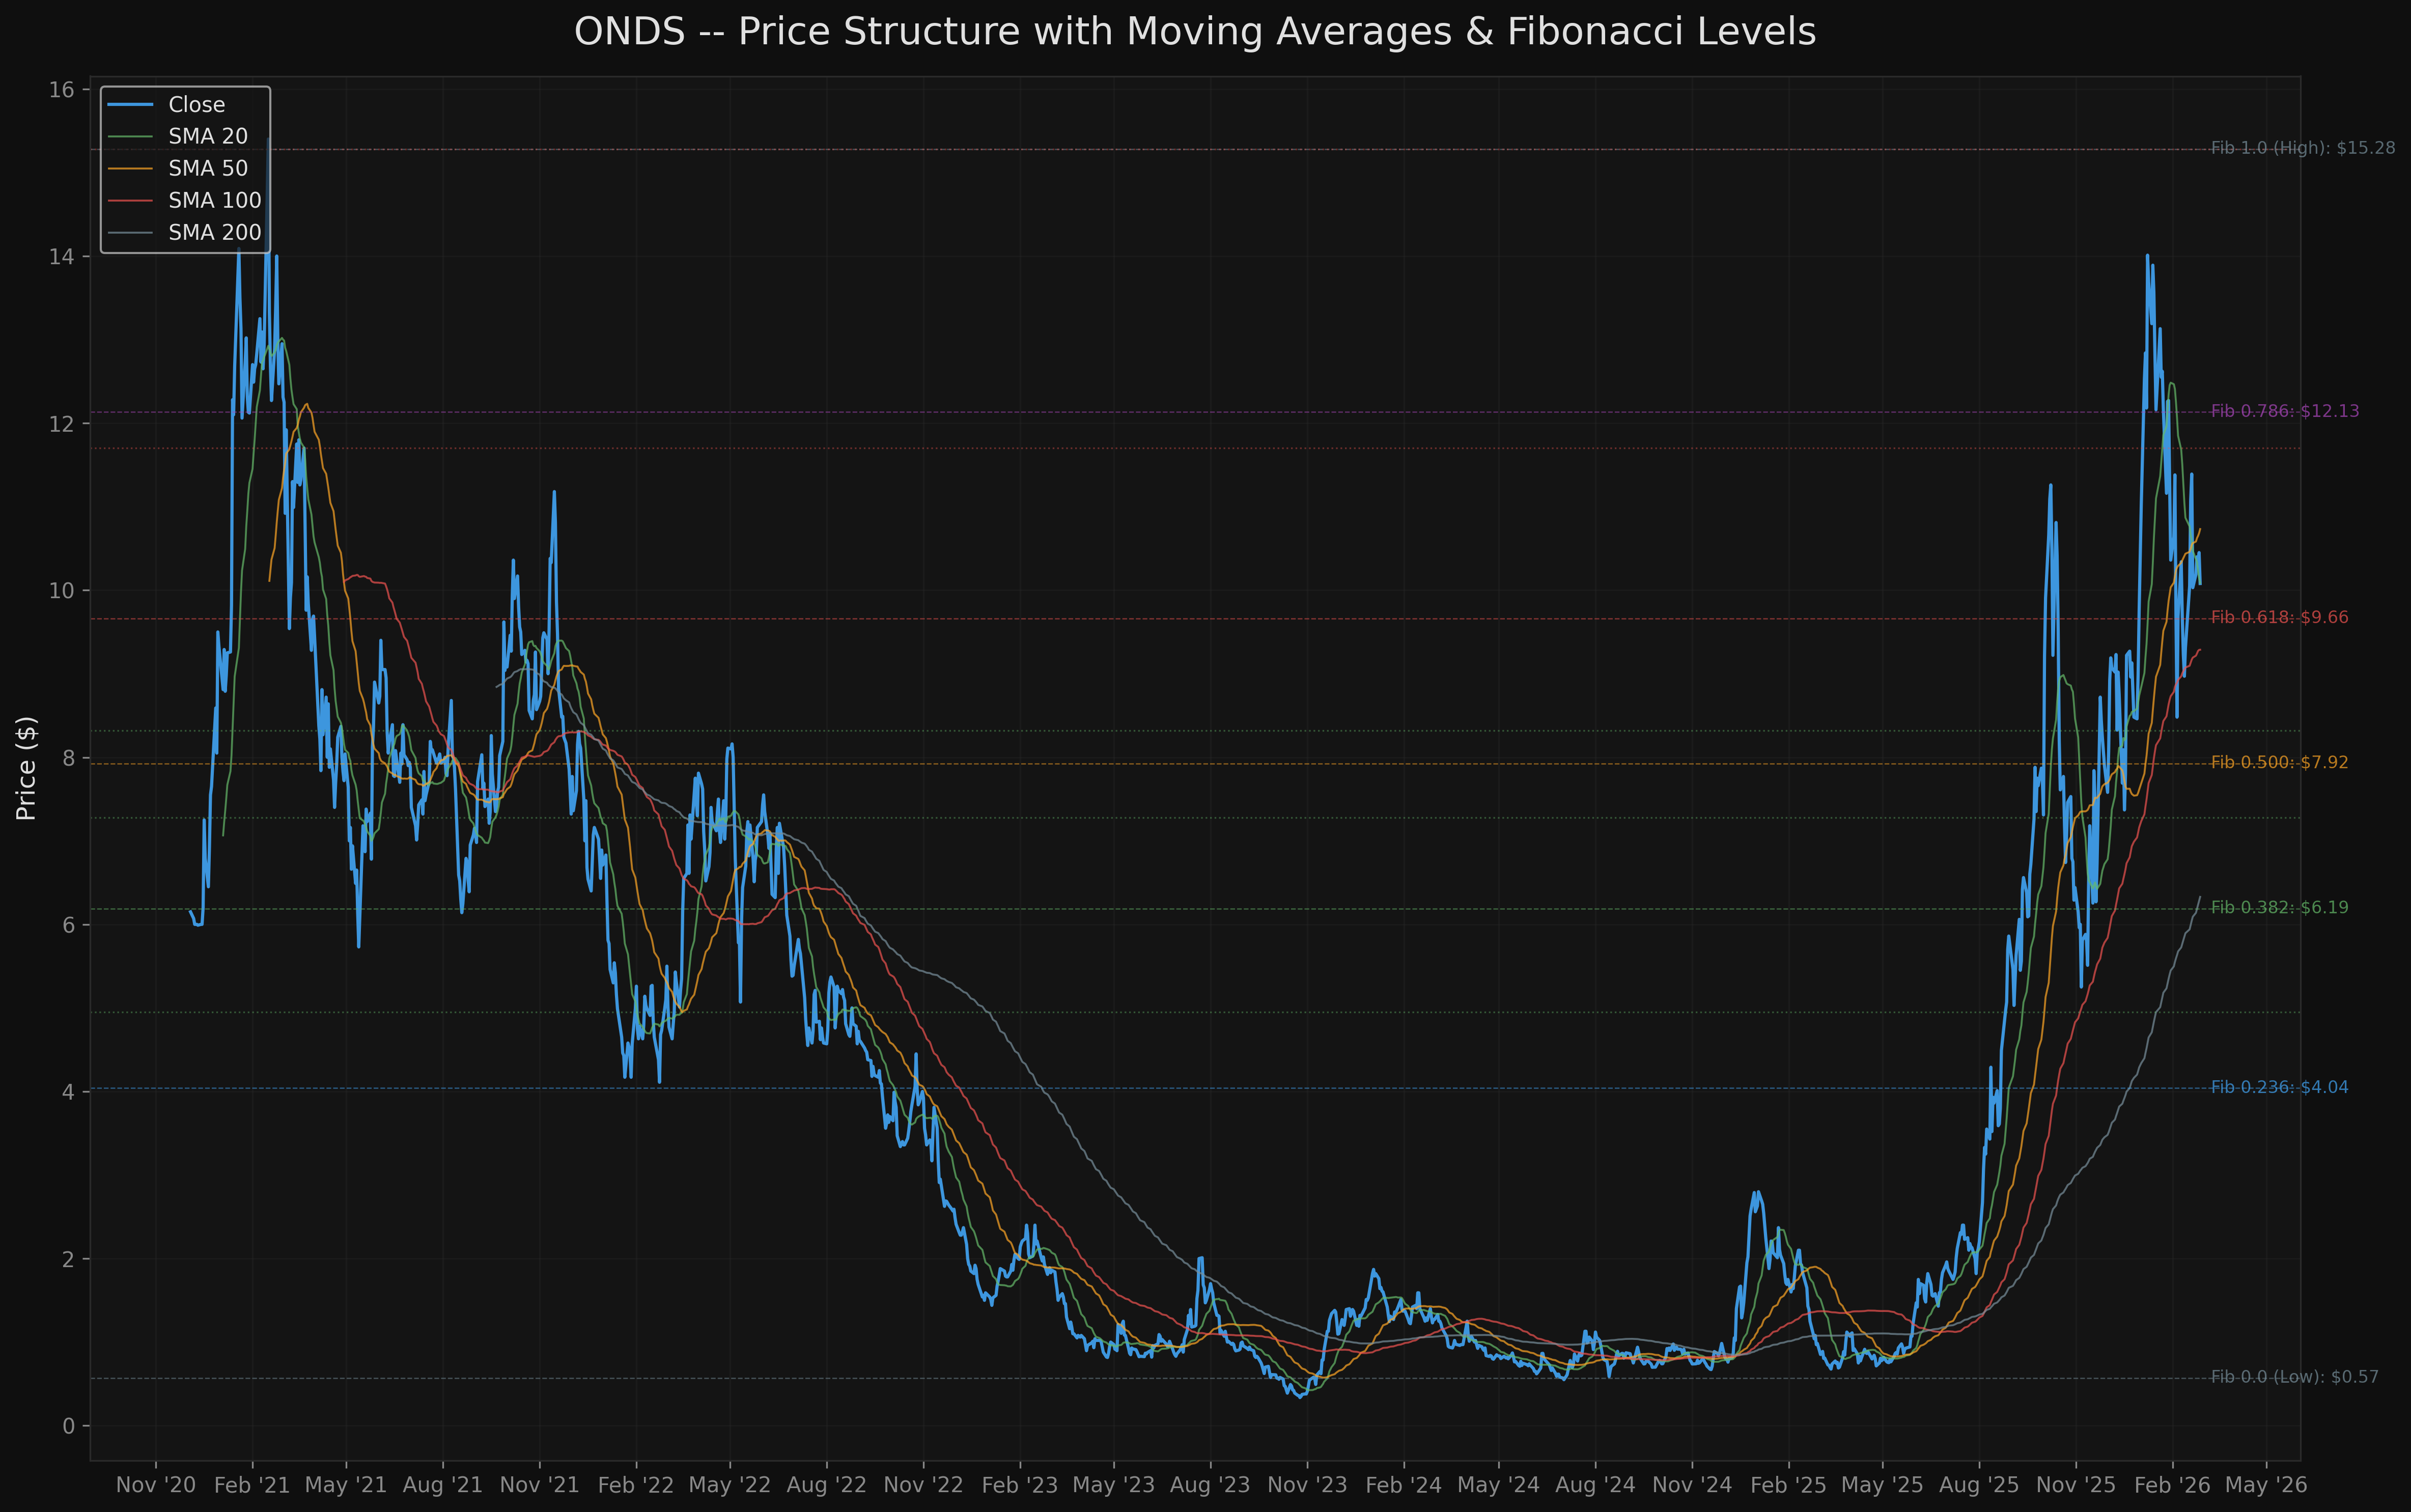
ONDS has experienced an extraordinary price move over the past year, rising approximately 833% from around $1.08 to $10.08. The stock is now in a period of consolidation following a parabolic advance that peaked near $15.28 in late January 2026. The current price sits at the 64.6% level of its 52-week range, above the Fibonacci 0.618 retracement level ($9.66), suggesting the broader trend structure remains intact despite the recent pullback.
The technical picture is mixed at the intermediate timeframe. On the positive side, the Golden Cross (SMA 50 above SMA 200) remains active, OBV is trending higher, and the Wyckoff analysis identifies a Markup phase over the last 120 days. On the negative side, the stock has corrected sharply from its highs (-34.0%), the SMA 20 slope is steep (-19.2% over 20 days), and the stock sits below its 50-day SMA. Momentum indicators (RSI 47.5, Stochastic 47.8) are neutral, consistent with a consolidation rather than a clear directional signal.
The dominant risk factor is extreme volatility: an ATR of 9.5% of price and annualized historical volatility of 126.5% place ONDS well outside normal equity parameters. This is characteristic of highly speculative small-cap equities and demands rigorous position sizing. Dollar volume is substantial (~$835M daily average) so liquidity is not a constraint, but the wide daily ranges mean slippage can be material.
The overall score of 6.0/10 reflects a stock with an intact longer-term uptrend but near-term uncertainty and extreme volatility that limits conviction.
3. Price Structure
52-Week Range
| Metric | Value |
|---|---|
| 52-Week High | $15.28 |
| 52-Week Low | $0.57 |
| Current Price | $10.08 |
| Range Position | 64.6% |
| Distance from High | -34.0% |
| Distance from Low | +1,668.4% |
Recent Performance
| Period | Return |
|---|---|
| 1 Week | +0.5% |
| 2 Weeks | +12.4% |
| 1 Month | -17.8% |
| 3 Months | +19.4% |
| 6 Months | +98.8% |
| 1 Year | +833.3% |
The 1-month return of -17.8% reflects the correction from the January high, while the 2-week return of +12.4% suggests early stabilization or a relief bounce within that correction.
Fibonacci Retracement Levels (52-Week)
| Level | Price | Status |
|---|---|---|
| 1.000 (High) | $15.28 | Resistance |
| 0.786 | $12.13 | Resistance |
| 0.618 | $9.66 | Nearby support (price just above) |
| 0.500 | $7.92 | Mid-range support |
| 0.382 | $6.19 | Deep support (near SMA 200) |
| 0.236 | $4.04 | Major structural support |
| 0.000 (Low) | $0.57 | 52-week low |
The current price of $10.08 sits just above the 0.618 Fibonacci level ($9.66), which is a classic retracement zone for continuation. A hold above $9.66 would be structurally constructive; a break below would target the 0.500 level at $7.92.
4. Market Structure
Wyckoff Phase Identification
The 120-day Wyckoff analysis identifies ONDS as being in a Markup phase based on the following quantitative evidence:
| Metric | First Half (60d) | Second Half (60d) | Interpretation |
|---|---|---|---|
| Price Range | 90.7% | 76.9% | Narrowing range |
| Price Return | +25.1% | +24.9% | Sustained positive returns |
| Average Volume | Lower | +20.6% higher | Increasing participation |
The combination of rising prices with increasing volume is the hallmark of a Markup phase. However, within the most recent 60 days, the structure shows consolidation (neither higher highs/higher lows nor lower highs/lower lows in the 30/30 split), suggesting the Markup phase may be transitioning to a re-accumulation or distribution zone.
Structural Pattern
The recent 60-day price action shows consolidation -- the second 30-day half did not produce definitively higher highs or higher lows compared to the first 30-day half. This is consistent with a market absorbing the massive gains from the prior rally. The question is whether this consolidation resolves upward (re-accumulation) or downward (distribution).
Evidence favoring re-accumulation: - Price remains above SMA 100 ($9.29) and SMA 200 ($6.33) - OBV is trending higher (+18.6% over 20 days) - Golden Cross intact - Fibonacci 0.618 holding as support
Evidence favoring distribution: - Price below SMA 50 ($10.73) - SMA 20 slope is steeply negative (-19.2%) - Volume declining in recent 20 days (-28.2% vs prior 20 days) - 34% drawdown from the high
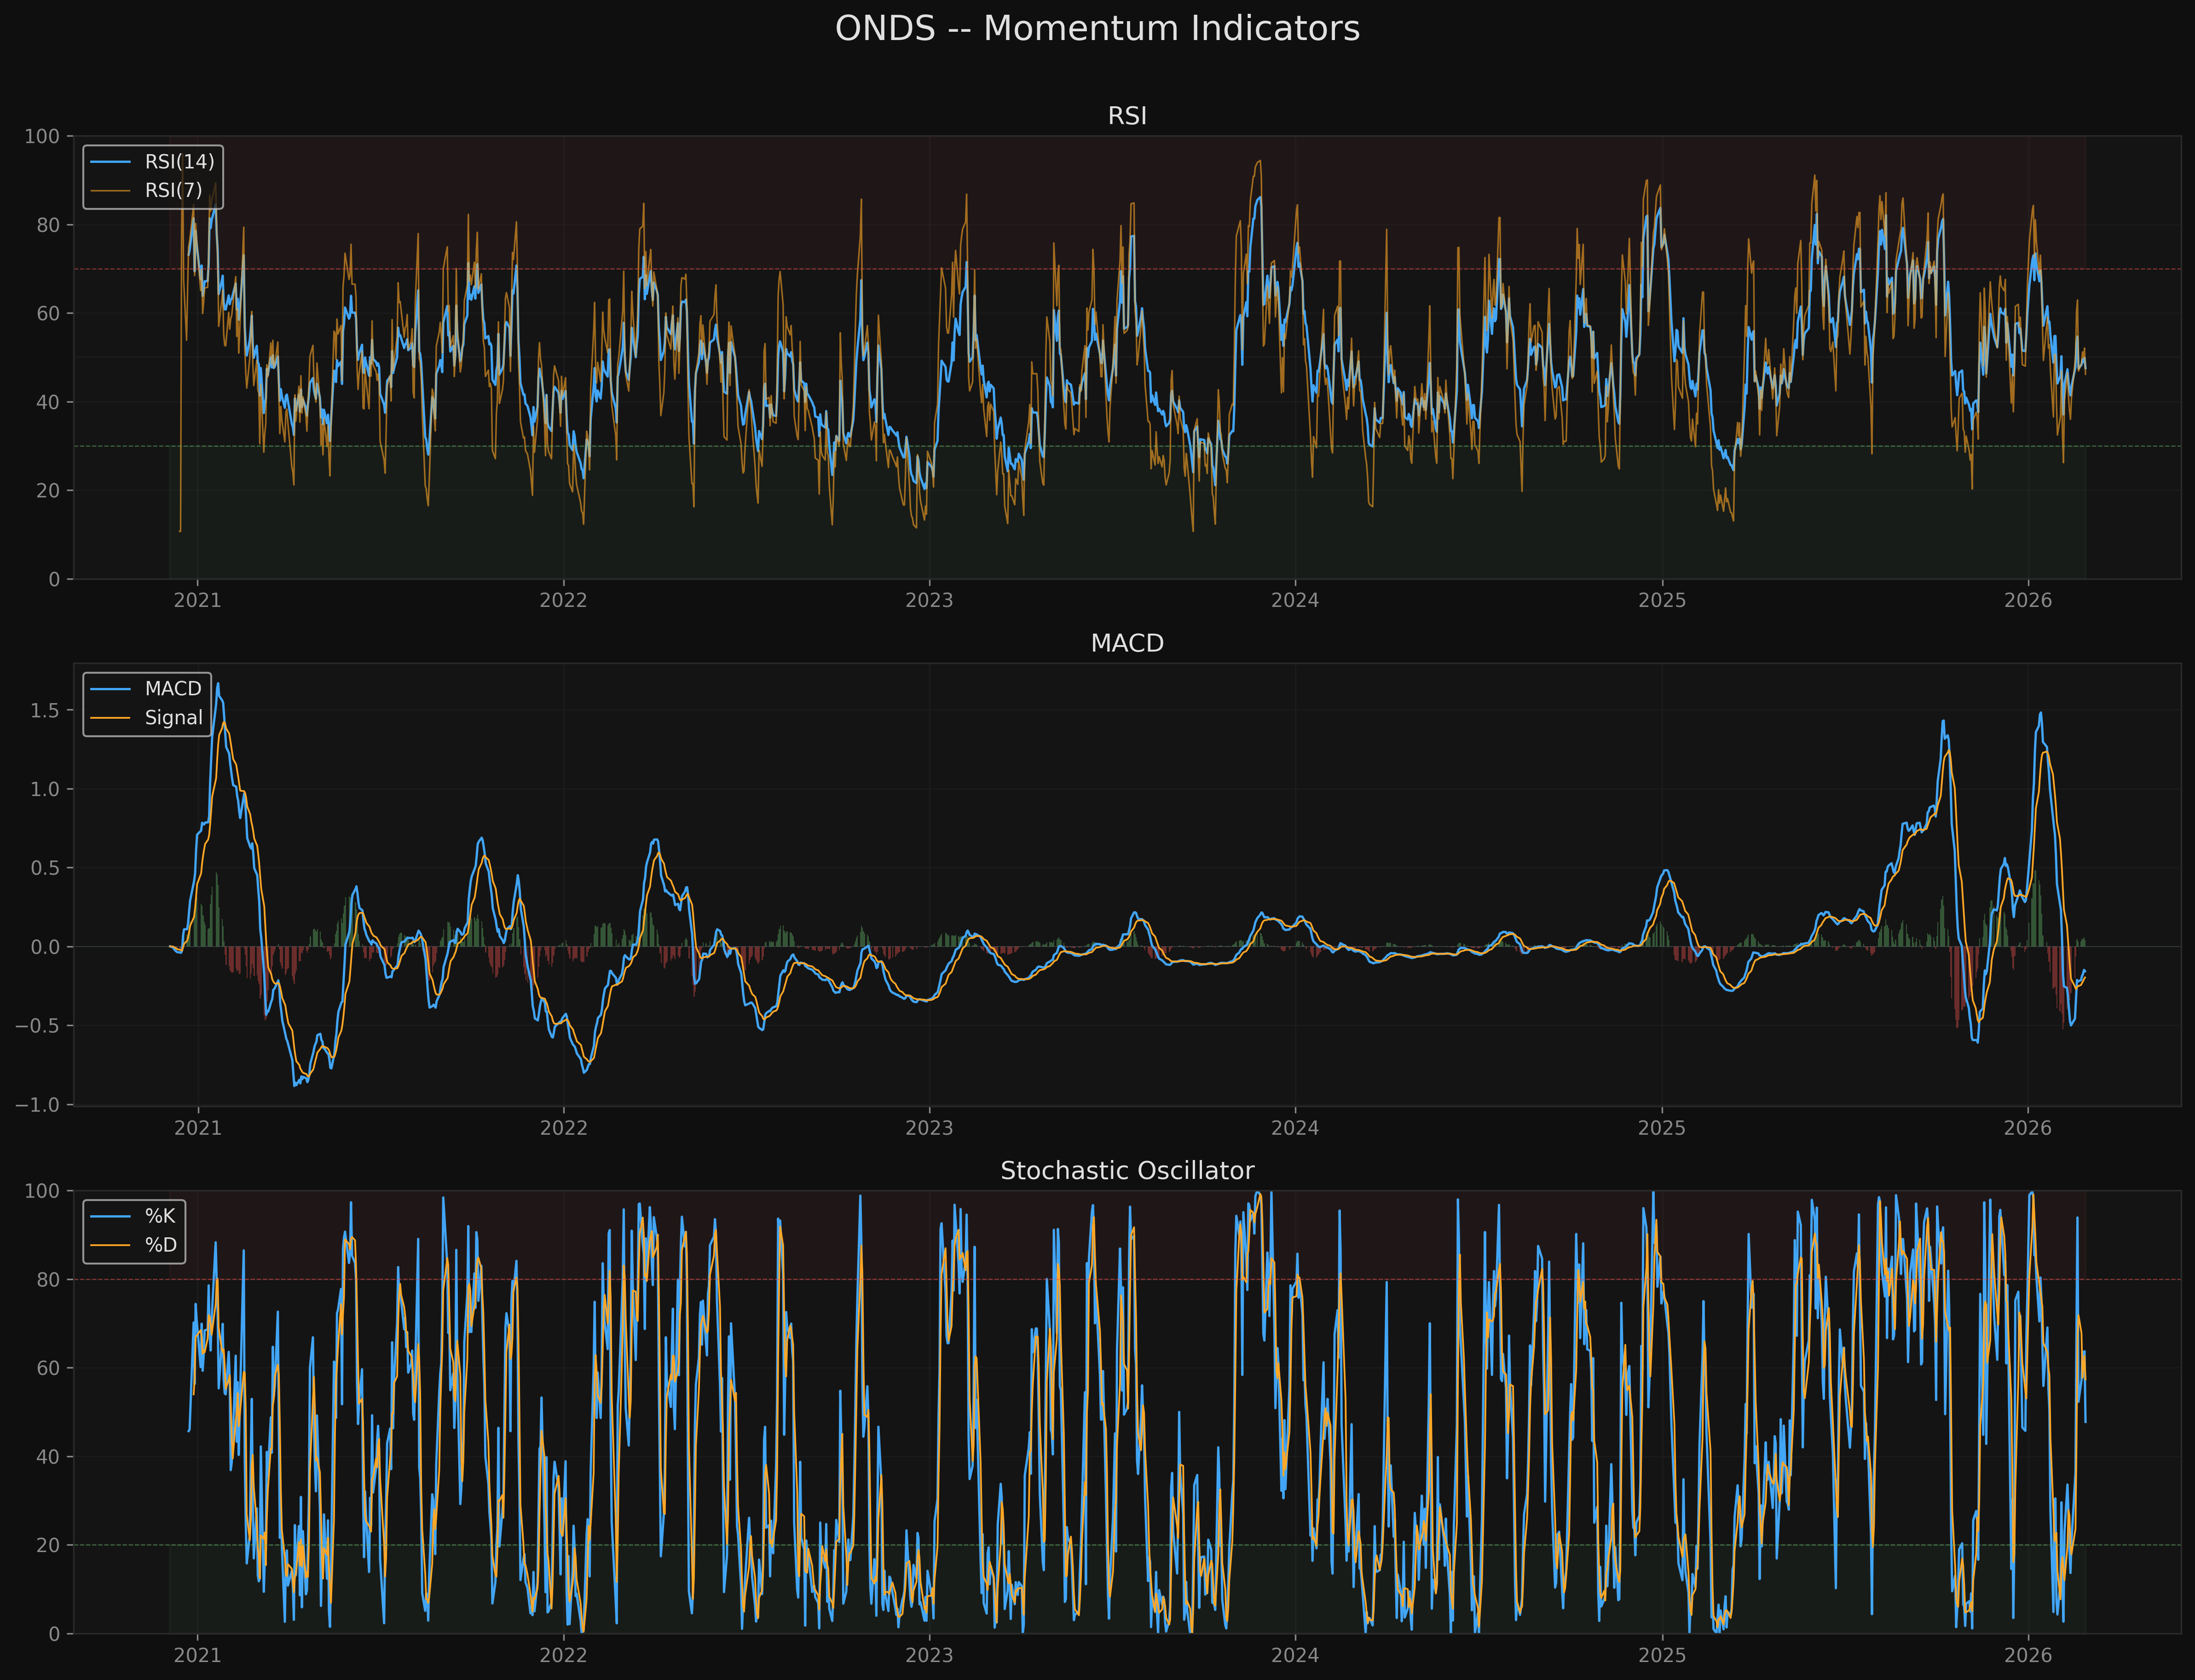
5. Momentum Analysis
RSI (Relative Strength Index)
| Indicator | Value | Interpretation |
|---|---|---|
| RSI(14) | 47.5 | Neutral -- neither overbought nor oversold |
| RSI(7) | 46.2 | Neutral, slightly below 50 |
| RSI(14) 1Y Average | 55.4 | Current reading below average suggests weakening momentum |
RSI at 47.5 is in the dead center of the neutral zone. It has come down from overbought territory during the January rally and is now stabilizing. There is no RSI divergence signal at present -- both price and RSI are consolidating.
MACD
| Indicator | Value | Interpretation |
|---|---|---|
| MACD Line | -0.1573 | Below zero line |
| Signal Line | -0.1971 | Below MACD (bullish cross) |
| Histogram | +0.0399 | Positive and expanding |
| Last Bullish Cross | 2026-02-19 | 6 bars ago |
The MACD is notable for having recently made a bullish crossover (6 bars ago on Feb 19). The histogram is positive and expanding, which is an early sign of recovering momentum. However, both the MACD line and signal remain below zero, meaning the intermediate-term momentum is still negative overall. A cross above zero would confirm a momentum recovery.
Stochastic Oscillator (14,3)
| Indicator | Value | Interpretation |
|---|---|---|
| %K | 47.8 | Mid-range |
| %D | 57.3 | Slightly above %K |
The Stochastic is mid-range, consistent with the neutral RSI reading. The %K being below %D is mildly bearish on a very short-term basis, but neither line is in an extreme zone.
Momentum Score: 5.0/10
Momentum is decisively neutral. The recent bullish MACD crossover and positive histogram are offset by the below-zero MACD, neutral RSI, and middling Stochastic. There is no strong directional momentum signal.
6. Moving Average Analysis
Current Positioning
| Moving Average | Value | Price vs MA | Slope (20d) |
|---|---|---|---|
| SMA 20 | $10.09 | -0.1% (at MA) | -19.21% |
| SMA 50 | $10.73 | -6.1% (below) | +6.95% |
| SMA 100 | $9.29 | +8.5% (above) | N/A |
| SMA 200 | $6.33 | +59.3% (above) | +16.17% |
Key Observations
-
Price at SMA 20: The stock is essentially sitting right on its 20-day SMA ($10.09 vs $10.08). This is a pivot point -- a sustained move above suggests short-term trend recovery; a breakdown below is bearish.
-
Below SMA 50: The stock is 6.1% below its 50-day SMA, which has been pulled higher by the January rally. The SMA 50 slope remains positive (+6.95%), so the 50-day is still rising, but price needs to reclaim it for intermediate-term bullishness.
-
Well above SMA 100 and SMA 200: The longer-term trend is firmly bullish. The 59.3% premium to the SMA 200 is extreme and suggests the stock is far extended from its mean on a longer timeframe.
-
Golden Cross active: SMA 50 ($10.73) > SMA 200 ($6.33). This confirms the longer-term uptrend.
-
SMA 20 slope warning: The -19.2% 20-day slope on the SMA 20 is very steep, reflecting the sharp correction. This is normalizing as the correction base-builds.
MA Alignment
The MAs are not fully stacked in either direction. The SMA 20 < SMA 50 (short-term weakness) but SMA 50 > SMA 100 > SMA 200 (long-term strength). This mixed alignment is typical of a pullback within an uptrend.
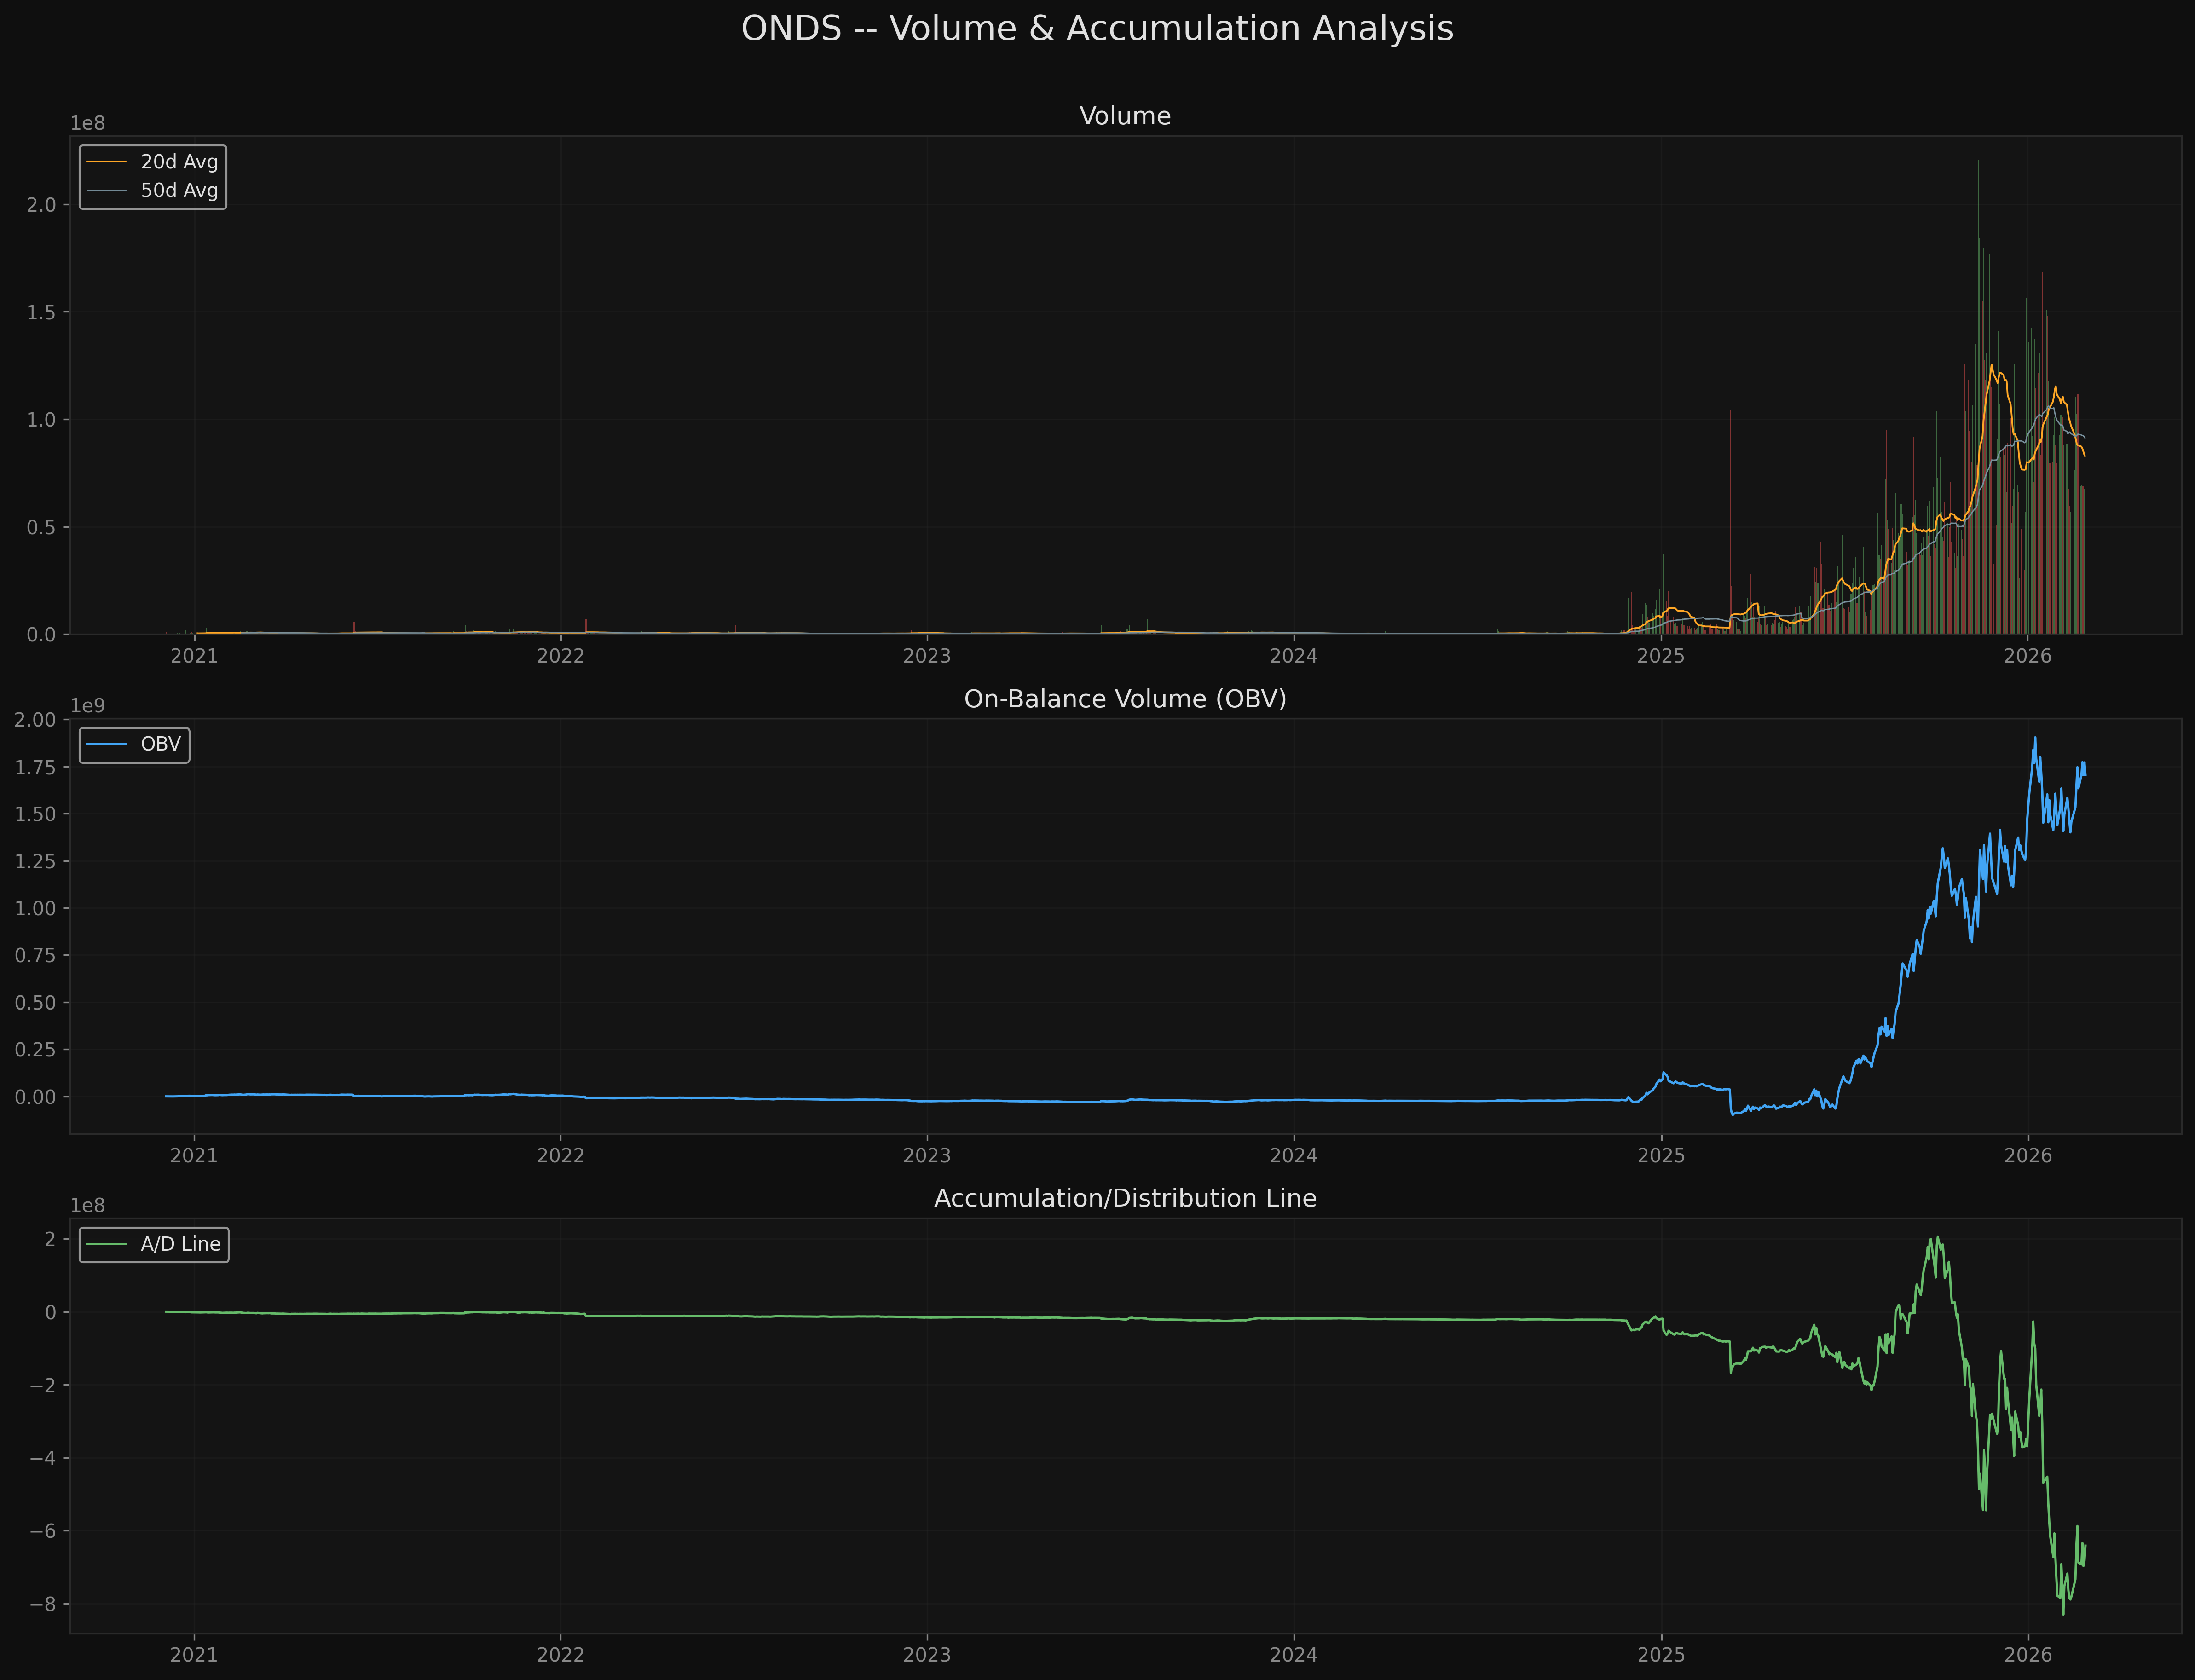
7. Volume Analysis
Volume Statistics
| Metric | Value |
|---|---|
| Last Day Volume | 65,250,000 |
| 20-Day Average Volume | 82,874,900 |
| Volume Ratio (Last / 20d Avg) | 0.79x |
| Volume Trend (20d vs Prior 20d) | -28.2% |
| Average Dollar Volume | ~$835M |
| Up/Down Volume Ratio (20d) | 1.12 |
On-Balance Volume (OBV)
OBV has increased by +18.6% over the last 20 days. This is constructive -- it suggests that net buying pressure has been accumulating even as price has been consolidating. When OBV rises during a price consolidation, it can indicate underlying demand that has not yet been reflected in price.
Accumulation/Distribution Line
The A/D line shows a 20-day change of +17.6%, confirming the OBV signal. The close-location value (CLV) calculation weights volume by where the close falls within the day's range, and the positive slope suggests closes are occurring in the upper portion of daily ranges more often than the lower.
Volume Interpretation
The declining volume trend (-28.2%) is notable. Volume is contracting from the elevated levels seen during the January rally and February correction. This can be interpreted two ways:
- Bullish: Selling pressure is exhausting; fewer shares are available at lower prices.
- Bearish: Interest is waning; the stock could drift lower on low participation.
The positive up/down volume ratio (1.12) and rising OBV tilt the interpretation slightly bullish. The volume contraction is likely a natural normalization from the extreme activity during the parabolic advance.
Volume Score: 6.5/10
Above average due to positive OBV and A/D trends, tempered by the declining volume and near-unity up/down ratio.
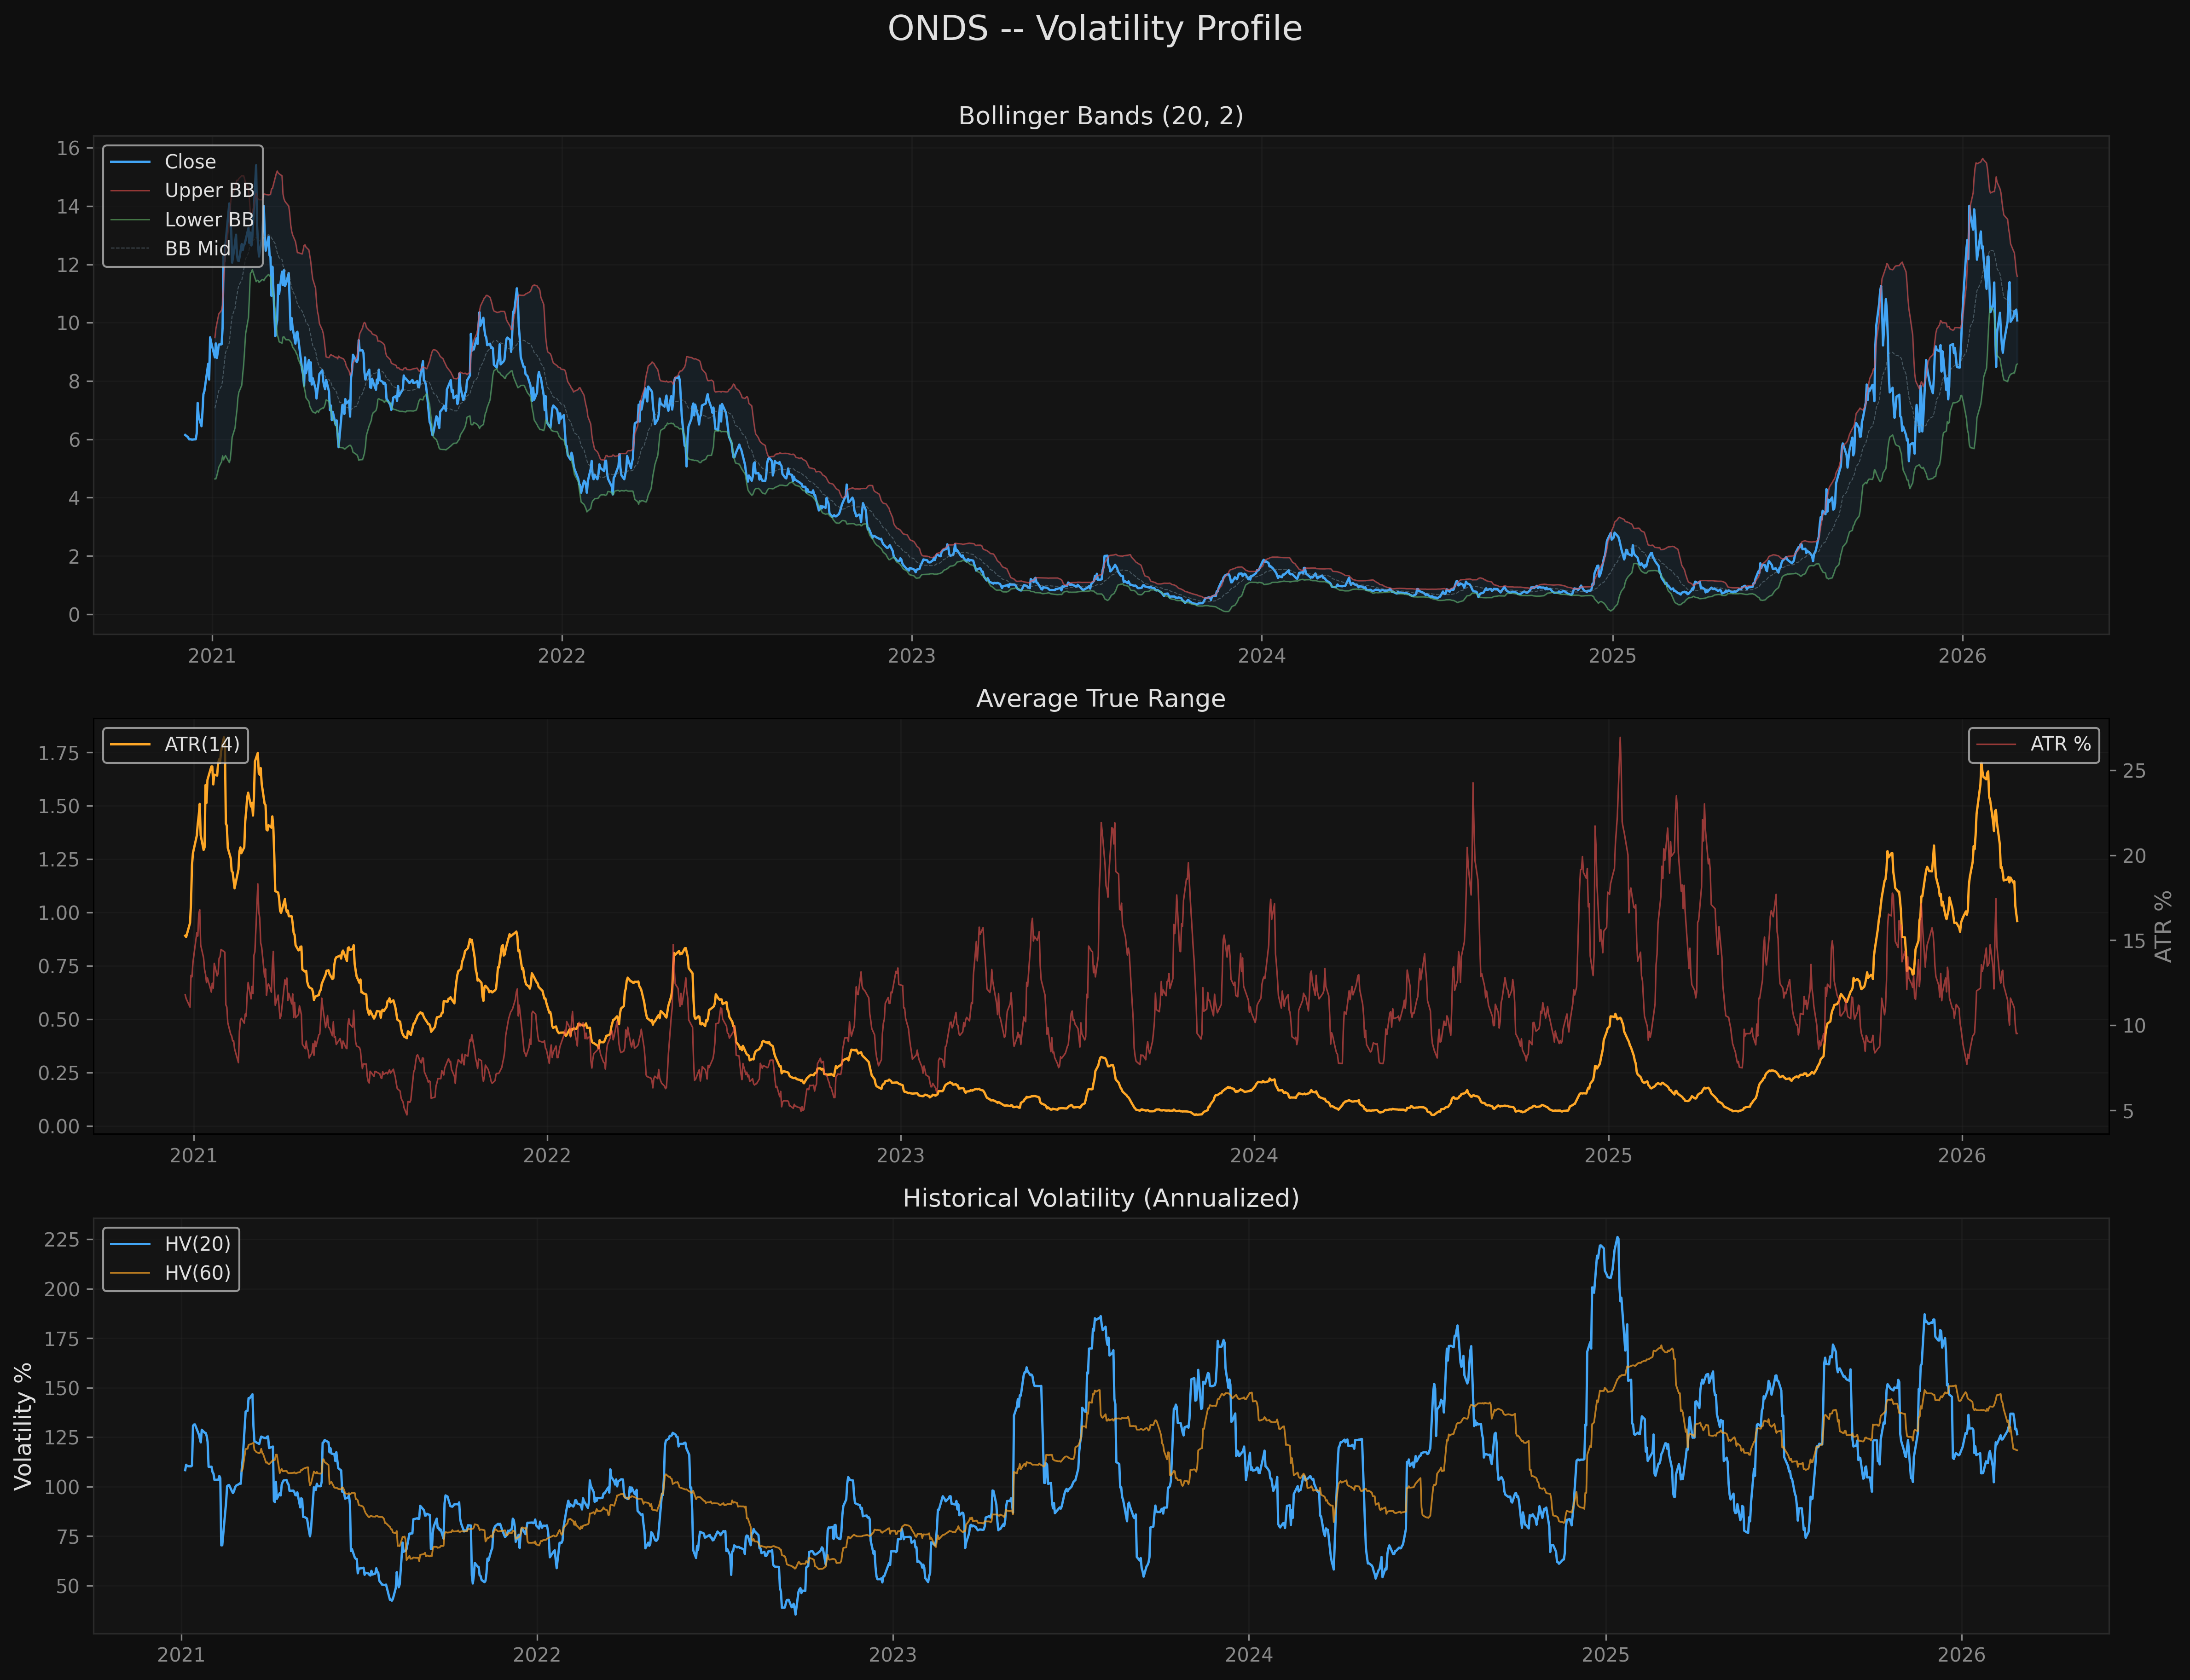
8. Volatility Profile
Current Volatility Metrics
| Metric | Value | Context |
|---|---|---|
| ATR(14) | $0.96 | Absolute daily range |
| ATR/Price | 9.5% | Extreme for equity |
| BB Width | 29.8% | Wide (60d avg: 51.1%) |
| BB %B | 0.50 | Dead center of bands |
| HV(20) | 126.5% | Annualized 20-day vol |
| HV(60) | 118.4% | Annualized 60-day vol |
Return Distribution
| Statistic | Value |
|---|---|
| Mean Daily Return | +0.285% |
| Std Dev Daily Return | 7.170% |
| Skewness | +1.007 |
| Kurtosis | +2.827 |
| Max Daily Gain | +37.3% |
| Max Daily Loss | -22.8% |
Analysis
ONDS displays extreme volatility by any measure. An annualized historical volatility of 126.5% places it in the top decile of equity volatility. The ATR of 9.5% of price means that on an average day, the stock's true range covers nearly 10% of its value. For context, the S&P 500 typically has an ATR/price ratio under 1.5%.
Bollinger Band observations: - BB Width at 29.8% is actually below its 60-day average of 51.1%, indicating that volatility has been compressing relative to recent extremes. This is marginally constructive, as volatility compression often precedes directional moves. - BB %B at 0.50 means the price is exactly at the midpoint of the Bollinger Bands -- a neutral position.
Distribution characteristics: - Positive skewness (+1.007) is a favorable risk property for long positions. It means the distribution has a longer right tail (larger positive outliers than negative ones). - Elevated kurtosis (+2.827) indicates fat tails relative to a normal distribution, meaning extreme daily moves (both positive and negative) are more common than expected.
Volatility Score: 5.8/10
The extreme ATR is a negative factor (requires wide stops and limits position size), but the volatility compression, neutral BB position, and positive skewness provide partial offsets.
9. Entry Point Assessment
Entry zones are ranked by confluence of technical support factors and risk/reward characteristics. Given the extreme volatility, entries at current levels carry significant risk without a clear short-term catalyst.
Zone 1: Current Consolidation Zone ($9.66 - $10.08)
- Confluence factors: Fibonacci 0.618 ($9.66), SMA 20 ($10.09), current price
- Risk/Reward from $10.08: R:R to Target 1 ($11.70) = 0.54:1 with stop at $7.06
- Assessment: The R:R is unfavorable at current levels because the stop must be wide to accommodate the extreme volatility. Entry here is only justified if a tighter invalidation level can be identified (e.g., a daily close below $9.60).
Zone 2: Primary Accumulation Zone ($7.28 - $8.32)
- Confluence factors: Clustered historical support ($8.32), Fibonacci 0.500 ($7.92), secondary support cluster ($7.28)
- Risk/Reward from $8.00: R:R to Target 1 ($11.70) = 3.94:1 with stop at $7.06 (excellent)
- Assessment: This is the high-conviction entry zone. A pullback to the $7.28-$8.32 range would test the Fibonacci 0.382-0.500 zone and major clustered support. The R:R is highly favorable.
Zone 3: Deep Value Zone ($6.19 - $6.33)
- Confluence factors: SMA 200 ($6.33), Fibonacci 0.382 ($6.19)
- Risk/Reward from $6.25: R:R to Target 1 ($11.70) = 1.76:1 with stop at $5.50
- Assessment: This would represent a 38% drawdown from current levels and would test the long-term trend. Entry here would require confirmation that the SMA 200 is holding. The risk is that a breakdown below SMA 200 signals a trend reversal.
10. Risk/Reward Framework
Scenario 1: Bullish Re-accumulation (60-90 day horizon)
| Parameter | Value |
|---|---|
| Entry | $10.08 (current) or $9.66 (Fib 0.618 test) |
| Stop Loss | $8.30 (below primary support) |
| Target 1 | $11.70 (pivot resistance, +16.1%) |
| Target 2 | $15.28 (52-week high retest, +51.6%) |
| R:R (entry at $10.08, stop $8.30) | T1: 0.91:1 / T2: 2.92:1 |
| Probability Assessment | Moderate -- Golden Cross, OBV rising, Markup phase |
Thesis: The consolidation resolves upward as the stock finds support at the Fibonacci 0.618 level and the SMA 20. Rising OBV and a bullish MACD crossover confirm accumulation. The stock reclaims SMA 50 and rallies toward prior resistance.
Scenario 2: Deeper Correction to Fibonacci 0.500 (30-60 day horizon)
| Parameter | Value |
|---|---|
| Entry | $7.92 (Fibonacci 0.500) |
| Stop Loss | $7.06 (below secondary support) |
| Target 1 | $10.08 (current price level, +27.3%) |
| Target 2 | $12.13 (Fibonacci 0.786, +53.2%) |
| R:R (entry at $7.92, stop $7.06) | T1: 2.51:1 / T2: 4.90:1 |
| Probability Assessment | Lower probability but superior R:R |
Thesis: The correction extends as profit-taking and declining volume push the stock to the 50% retracement. Buyers step in at this level as it converges with the SMA 100 support zone. The stock builds a new base before resuming the uptrend.
Scenario 3: Bearish Breakdown (if support fails)
| Parameter | Value |
|---|---|
| Trigger | Daily close below $7.28 (secondary support) |
| Downside Target 1 | $6.19 (Fibonacci 0.382 / SMA 200 zone) |
| Downside Target 2 | $4.04 (Fibonacci 0.236) |
| Risk | A breakdown below the SMA 200 would negate the bullish trend thesis |
11. Key Levels Summary
| Level | Price | Type | Description |
|---|---|---|---|
| $15.28 | Resistance 2 | Major | 52-week high |
| $12.13 | Resistance | Fibonacci | 0.786 retracement |
| $11.70 | Resistance 1 | Pivot | Clustered pivot resistance |
| $10.73 | Resistance | MA | SMA 50 |
| $10.09 | Pivot | MA | SMA 20 (price at this level) |
| $10.08 | Current | Price | Last close |
| $9.66 | Support | Fibonacci | 0.618 retracement |
| $9.29 | Support | MA | SMA 100 |
| $8.32 | Support 1 | Cluster | Primary clustered support |
| $7.92 | Support | Fibonacci | 0.500 retracement |
| $7.28 | Support 2 | Cluster | Secondary clustered support |
| $6.33 | Support | MA | SMA 200 |
| $6.19 | Support | Fibonacci | 0.382 retracement |
| $4.04 | Support | Fibonacci | 0.236 retracement |
12. Overall Technical Score
Weighted Composite Breakdown
| Component | Score | Weight | Weighted |
|---|---|---|---|
| Trend Alignment | 5.8/10 | 25% | 1.45 |
| Momentum | 5.0/10 | 20% | 1.00 |
| Volume Confirmation | 6.5/10 | 20% | 1.30 |
| Volatility Profile | 5.8/10 | 15% | 0.87 |
| Market Structure | 7.0/10 | 20% | 1.40 |
| TOTAL | 100% | 6.0/10 |
Score Interpretation
A score of 6.0/10 places ONDS in the Neutral category. The long-term trend structure (Golden Cross, above SMA 200, Markup Wyckoff phase) is clearly bullish, earning the highest component score in Market Structure (7.0). However, the near-term correction, neutral momentum readings, and extreme volatility drag the overall score down.
What would improve the score: - RSI climbing above 55 and MACD crossing above zero (would lift Momentum from 5.0 to ~6.5-7.0) - Price reclaiming SMA 50 ($10.73) (would lift Trend from 5.8 to ~7.0) - Volume expanding on up days (would lift Volume from 6.5 to ~7.5)
What would worsen the score: - A break below $9.66 (Fibonacci 0.618) -- would damage Structure - Death Cross (SMA 50 crossing below SMA 200) -- would damage Trend significantly - RSI falling below 30 -- would push Momentum into bearish territory
13. Limitations
-
Extreme volatility distorts traditional technical signals. With daily returns regularly exceeding 5-10%, standard RSI/MACD/Stochastic parameters calibrated for typical equities (1-2% daily moves) may generate more false signals. The noise-to-signal ratio is inherently higher.
-
Parabolic advance history. A stock that has risen 833% in one year does not have a typical technical profile. Mean-reversion expectations are unreliable because the asset may be undergoing a fundamental re-rating that invalidates historical levels.
-
Support levels are sparsely tested. The identified support levels are derived from a limited number of touches during a rapid advance. They have not been repeatedly tested in a way that would increase confidence in their holding power.
-
Data period: 5.2 years (Dec 2020 to Feb 2027) provides adequate data for most technical indicators, but the stock's character has clearly changed over this period. The pre-2025 low-volatility, low-price regime is fundamentally different from the current high-volatility regime. Computing statistics over the full period conflates two different market microstructures.
-
No fundamental context. This analysis is purely technical. The 833% move likely reflects fundamental catalysts that could override any technical signal. Technical analysis alone cannot assess whether the current valuation is sustainable.
-
Slippage risk. Despite adequate dollar volume (~$835M daily), the extreme ATR (9.5%) means limit orders may fill at significantly different prices than intended. Market orders are particularly risky. Any entry/exit strategy must account for 1-2% slippage.
-
Fibonacci levels are mechanical. The Fibonacci retracement levels are computed from the 52-week high and low, which span a 1,668% range. This makes the absolute dollar distances between Fibonacci levels very large, reducing their practical utility as precision support/resistance levels.
Analysis Script
The complete analysis script is saved at:
analysis/quant-research/scripts/ONDS-technical-2026-03-01.py
Charts
| Chart | File |
|---|---|
| Price Structure | analysis/quant-research/charts/onds_price_structure.png |
| Momentum | analysis/quant-research/charts/onds_momentum.png |
| Volume & Accumulation | analysis/quant-research/charts/onds_volume_accumulation.png |
| Volatility | analysis/quant-research/charts/onds_volatility.png |
Charts