ONDS
Conviction 3ONDS -- Combined Deep Dive Assessment
Date: 2026-03-01 Asset Class: Equity Ticker: ONDS (Ondas Holdings)
Fundamental Summary
| Metric | Value |
|---|---|
| Overall Score | 41.5/100 |
| Verdict | AVOID |
Key Strengths: - Balance sheet fortress: $1.5B+ pro-forma cash, minimal debt, 15.3x current ratio - Dense near-term catalyst calendar: March 18 earnings, FY2026 guidance, $49.9B C-UAS TAM
Key Risks: - Valuation extreme: TTM P/S ~181x; forward P/S ~26x on unproven FY2026 guidance requiring 3.5x growth - Short interest 33.2% of float, accelerating (+6.1pp in 5 days) - Revenue growth entirely acquisition-driven (6 acquisitions in ~12 months); organic growth undemonstrable
(Full report: analysis/fundamentals/ONDS-synthesis.md)
Technical Summary
| Metric | Value |
|---|---|
| Overall Score | 6.0/10 |
| Bias | Neutral |
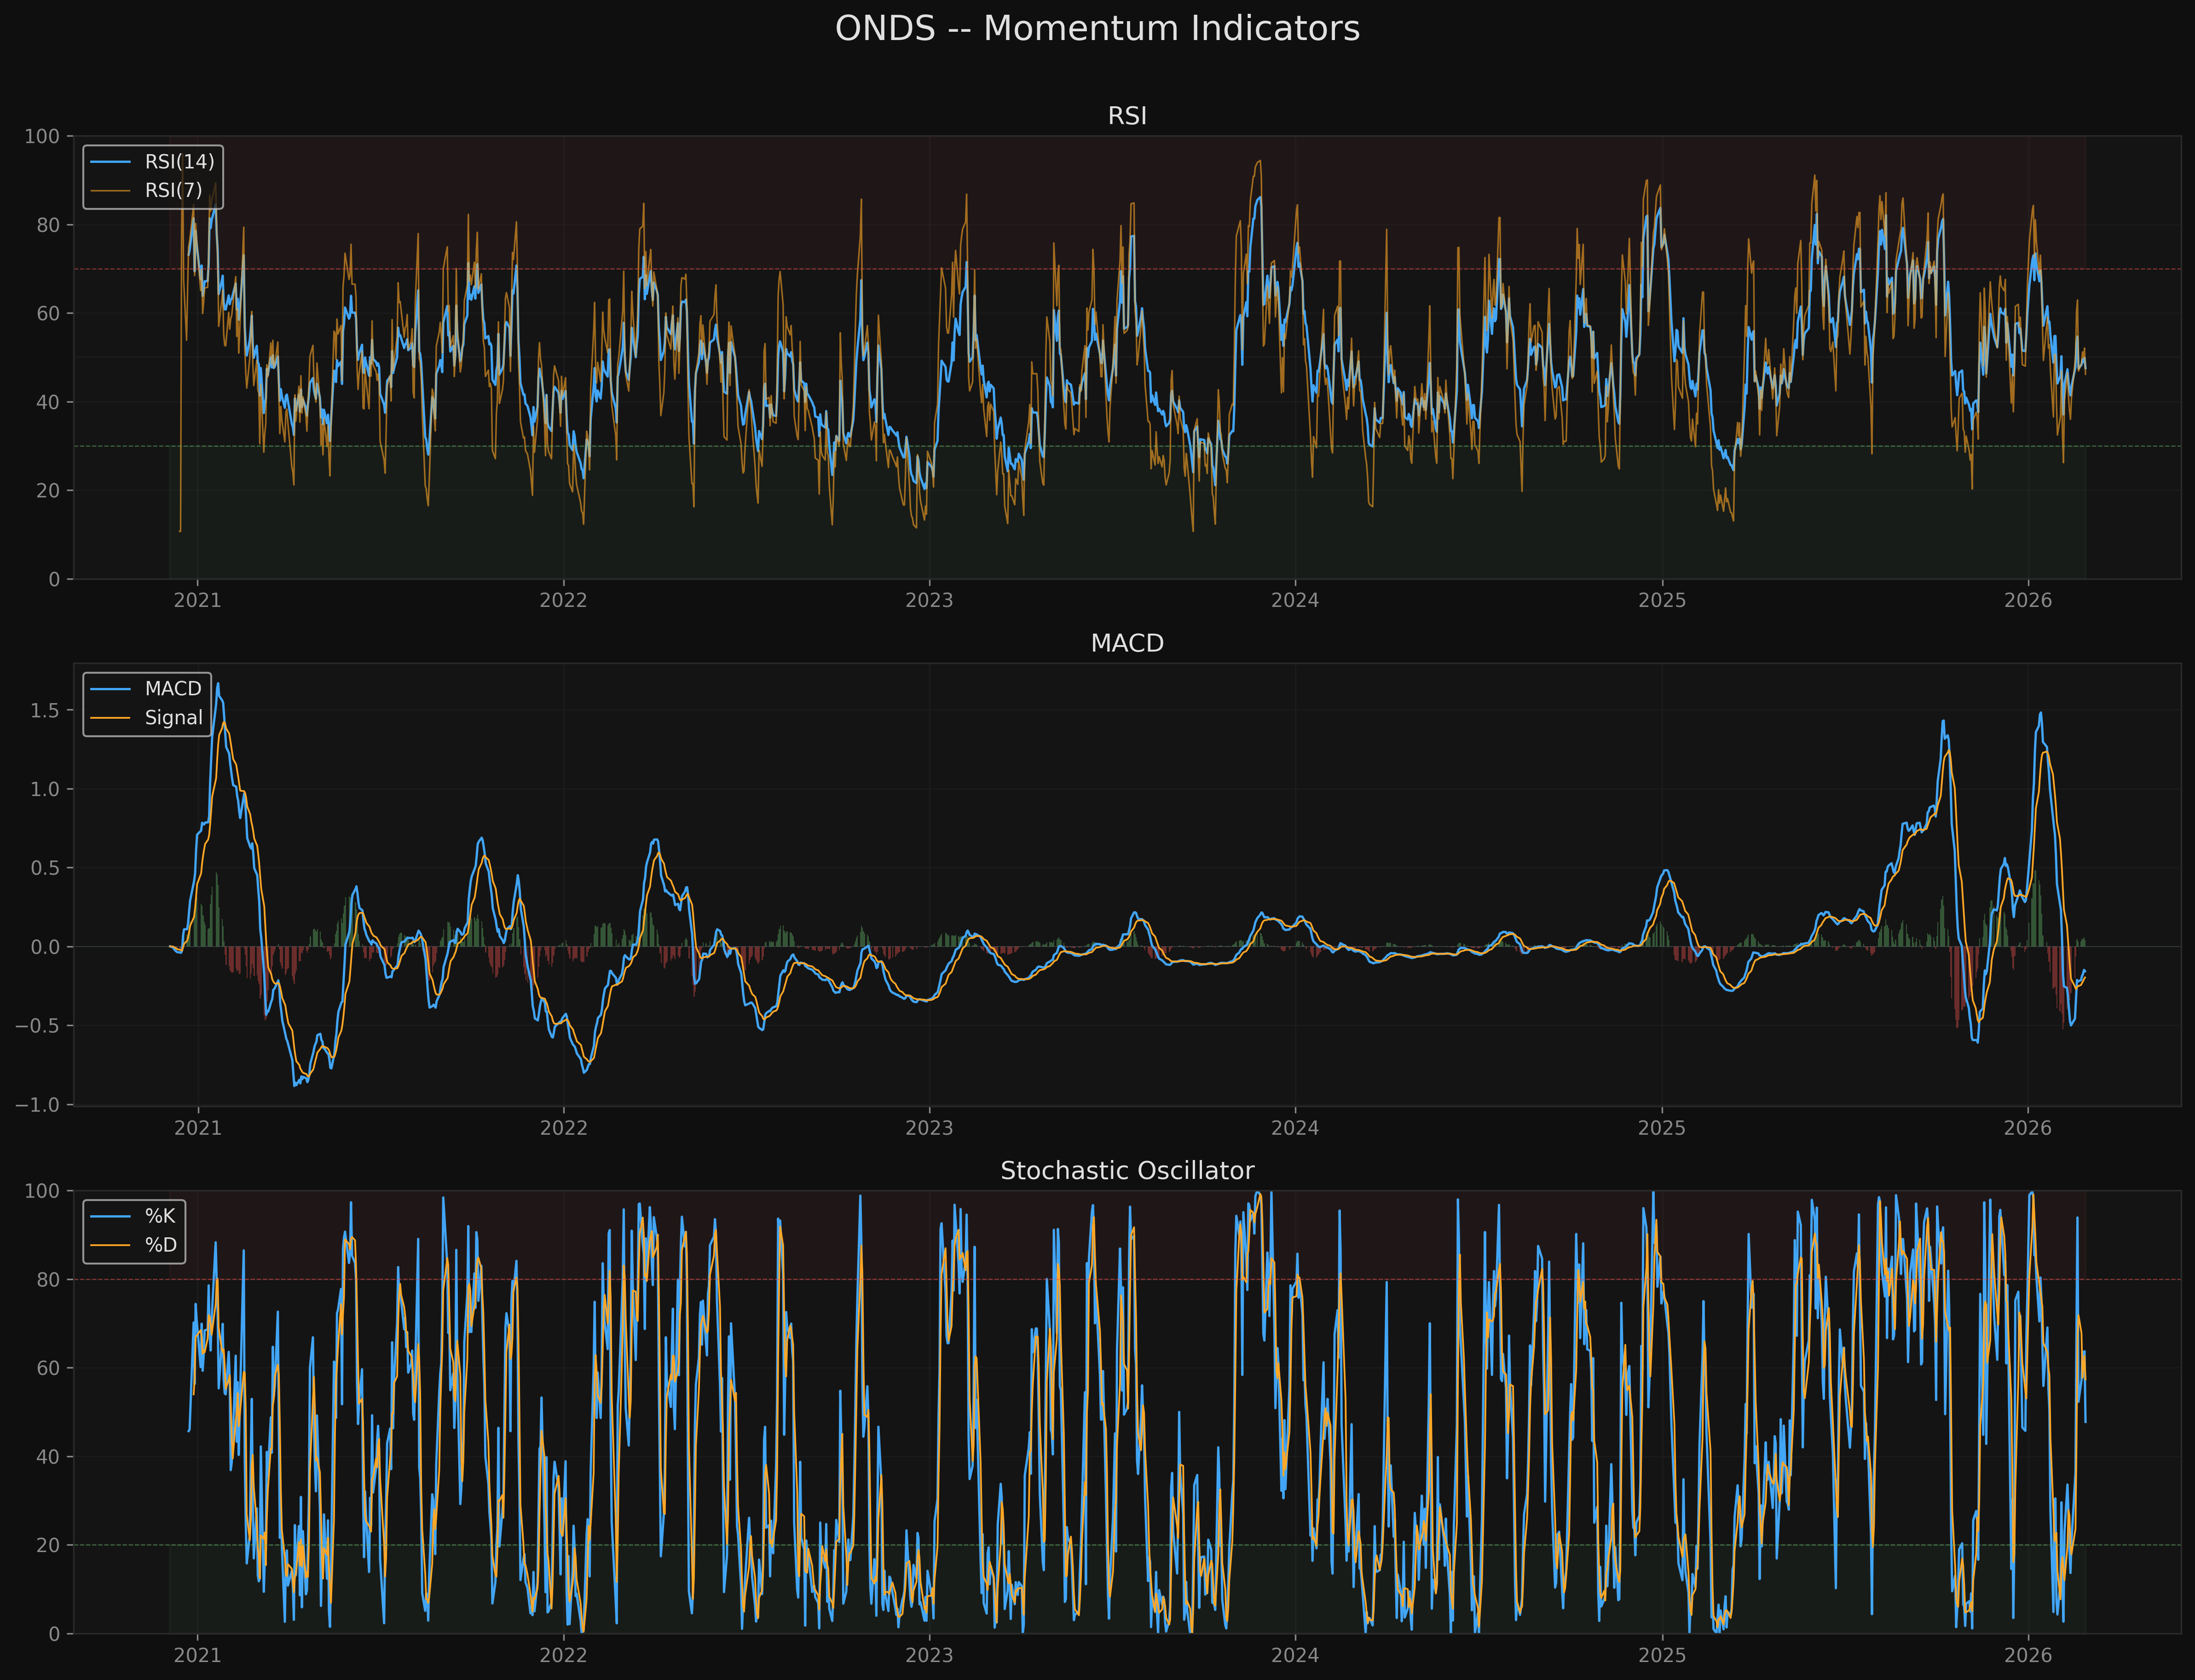
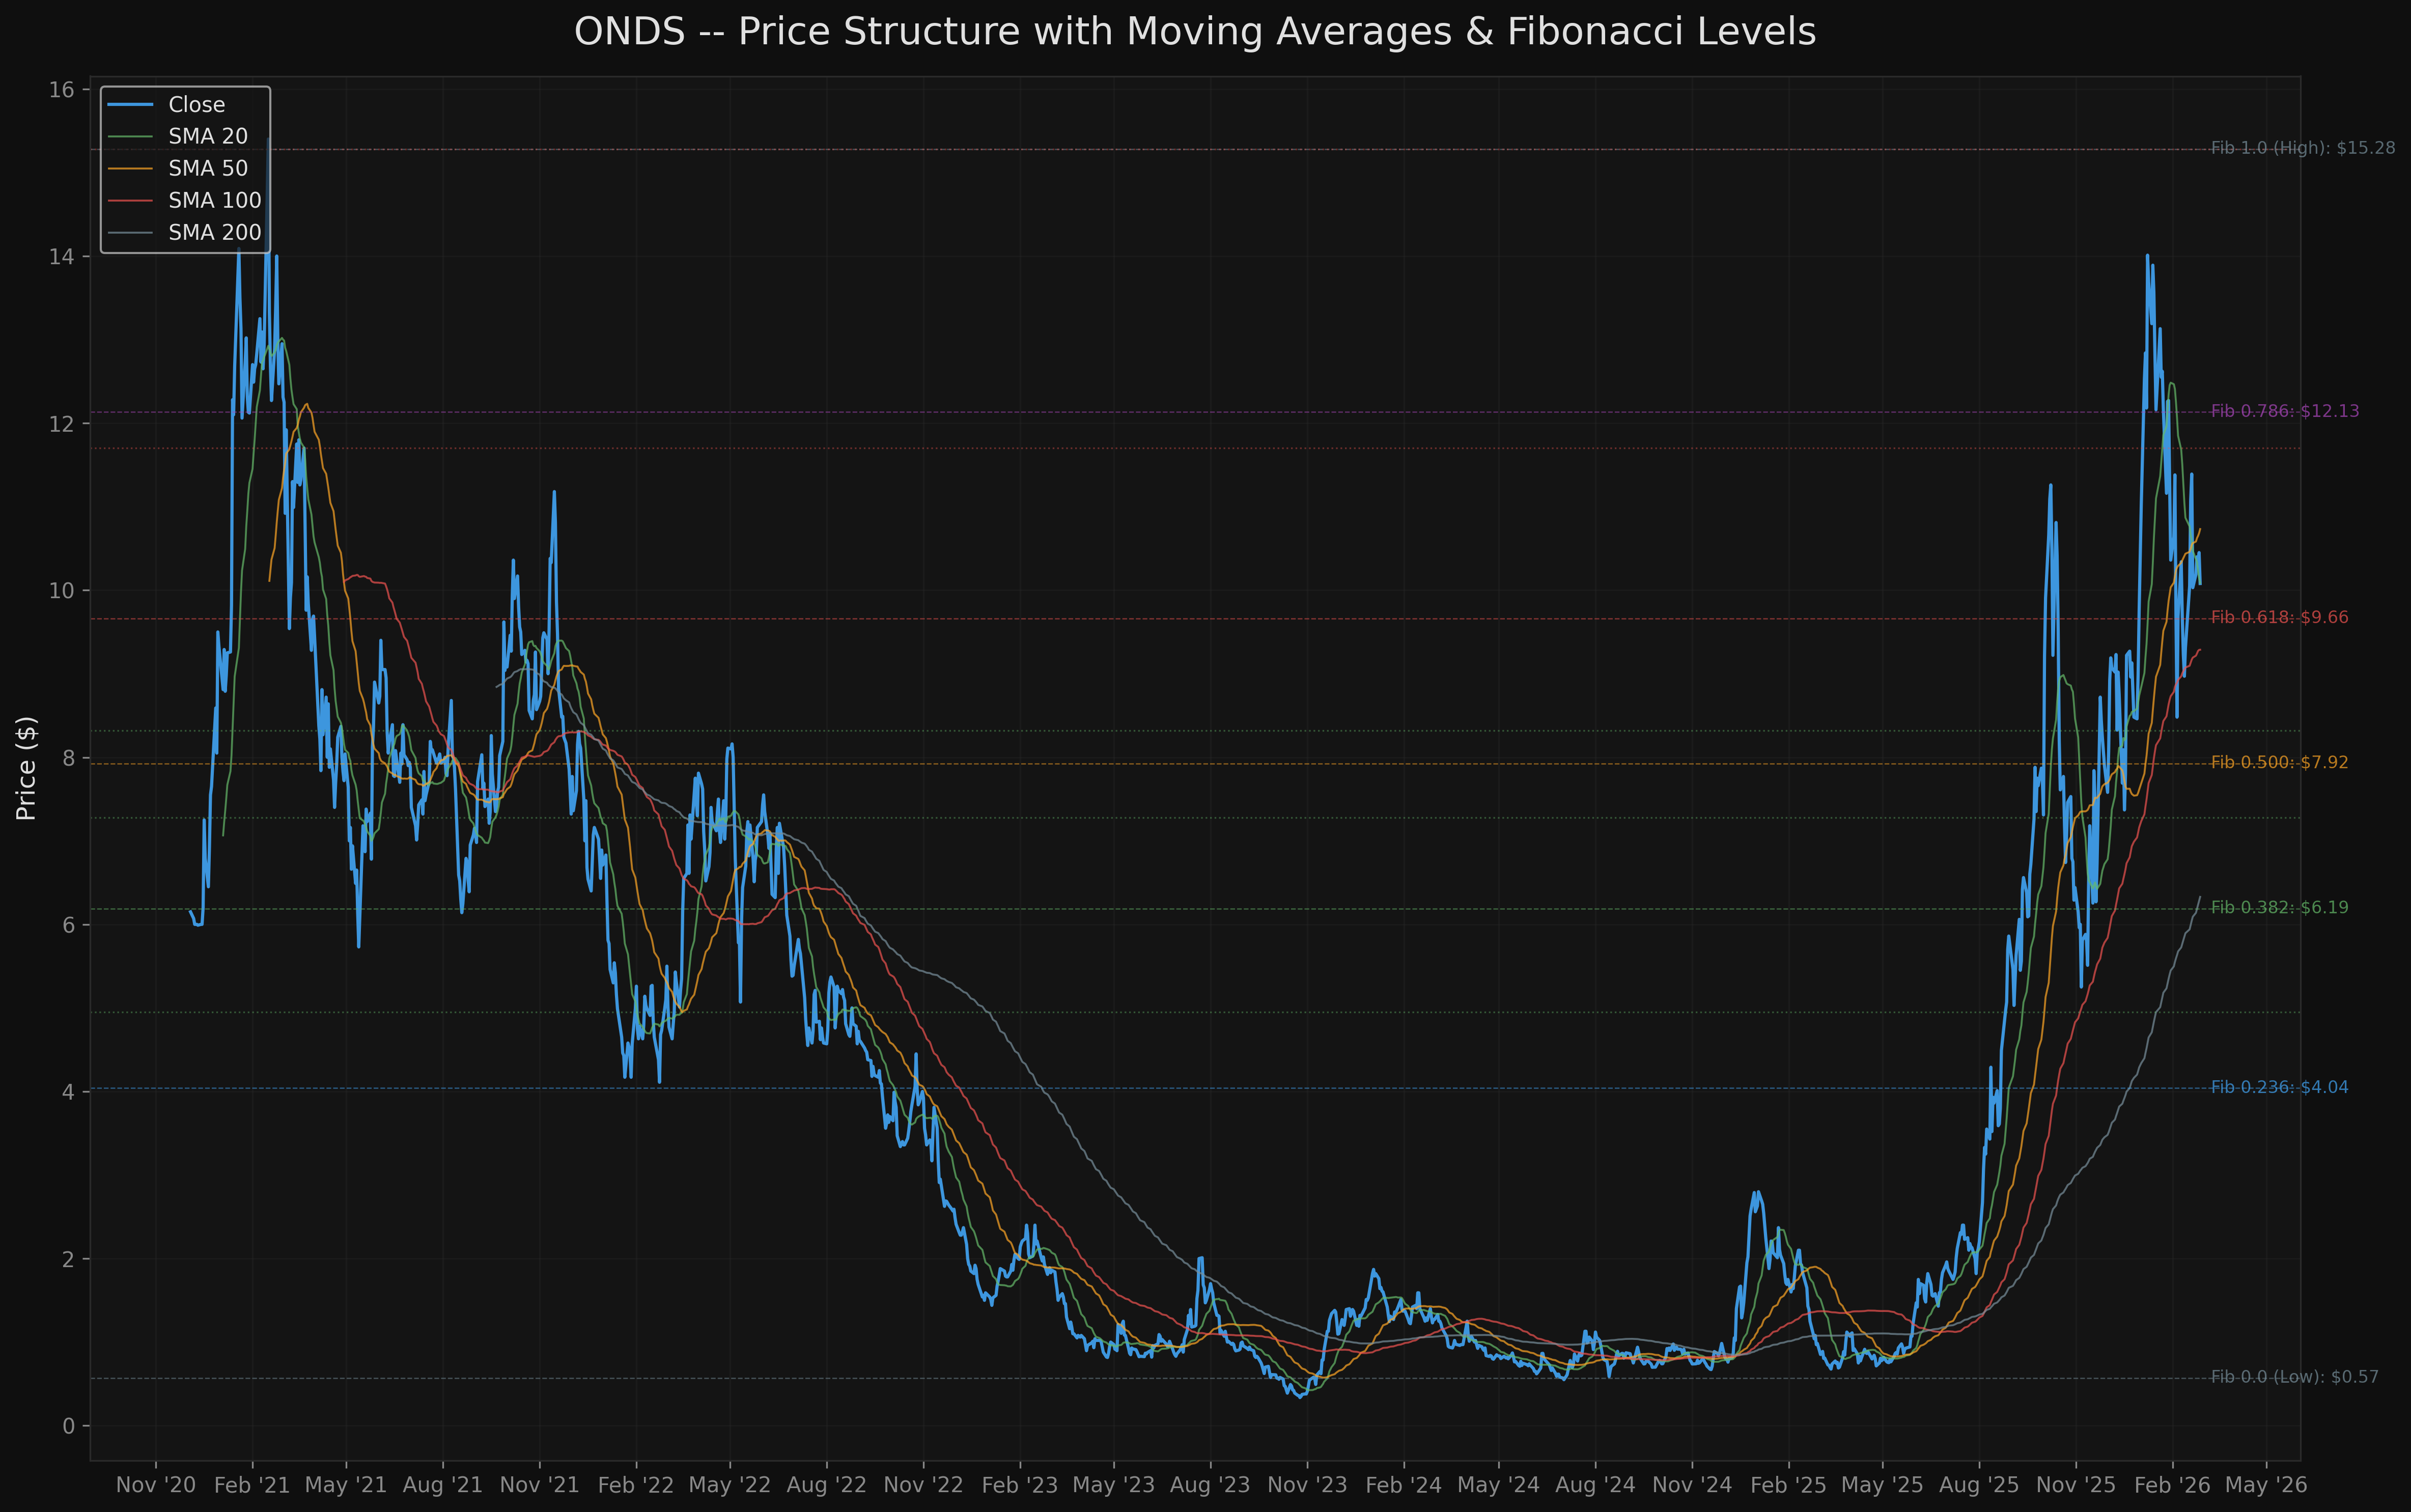
Trend: Golden Cross intact, +59.3% above SMA 200, but -34% correction from $15.28 high. Momentum: RSI 47.5 (neutral), MACD bullish crossover 6 bars ago, recovering. Key Levels: Support $8.32 / $7.28, Resistance $11.70 / $15.28.
(Full report: analysis/quant-research/ONDS-technical-2026-03-01.md)
AGREEMENT Assessment
Fundamental-Technical Alignment: CONFLICTING
The fundamental and technical views are materially opposed:
Fundamentals issue AVOID (41.5/100) driven by an extreme valuation floor (P/S 181x triggers the hard <20 component rule on valuation score of 15). Five HIGH-severity red flags -- all structural/disclosed -- paint a picture of a pre-profit company with inorganic revenue growth, massive dilution ($1.85B raised, share count +400%), and 33.2% short interest.
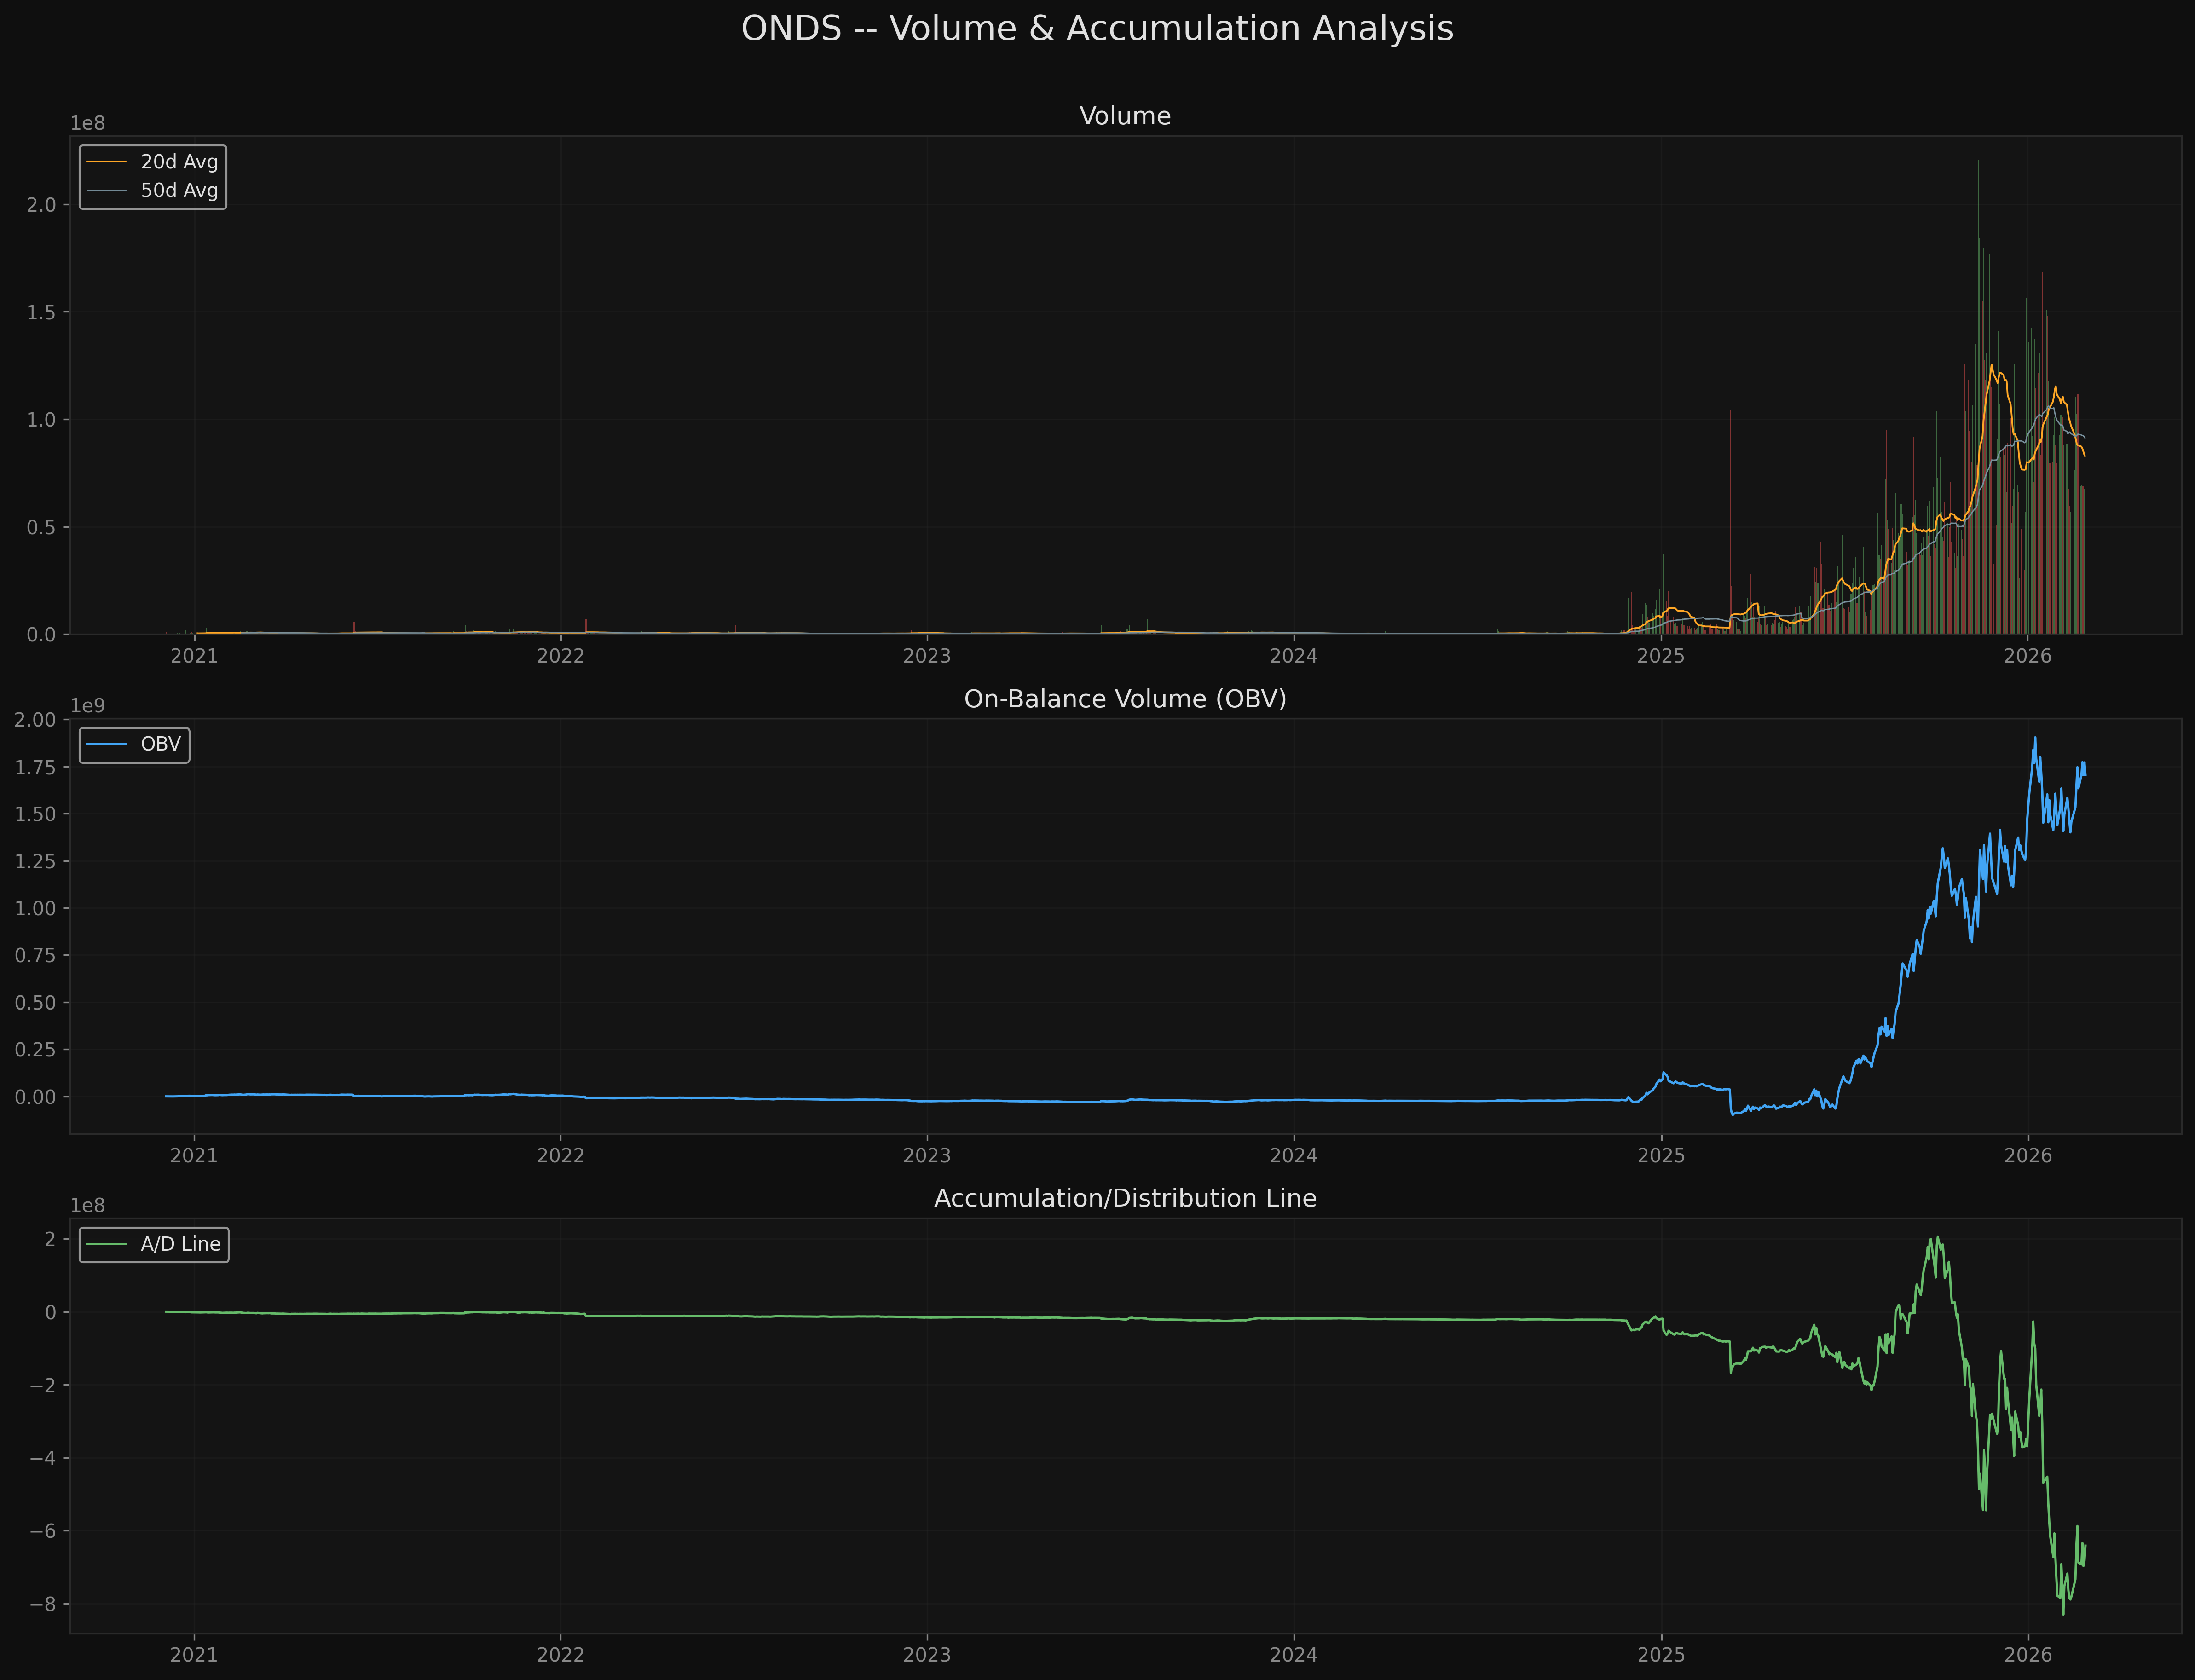
Technicals score 6.0/10 Neutral with constructive structure: the stock is in a Wyckoff Markup phase, above the SMA 200 (golden cross), with rising OBV and a recent MACD bullish crossover. The Fibonacci 0.618 retracement at $9.66 is holding as support.
The conflict: The fundamental case says the price has no earnings foundation and is a dilution-funded narrative trade. The technical case says the longer-term trend structure is intact and the -34% correction may be a normal pullback within a markup phase. This is a NARRATIVE vs. VALUATION tension -- the market is pricing execution that fundamentals say is not yet demonstrated (FY2024 revenue declined 54% under the same management).
The March 18, 2026 earnings report is the resolution event. A guidance confirmation or raise validates the technical structure. A guidance cut breaks it.
Key Levels
| Level | Price | Source |
|---|---|---|
| Resistance 2 | $15.28 | 52-week high retest |
| Resistance 1 | $11.70 | Clustered pivot resistance |
| Current Price | ~$10.09 | -- |
| Support 1 | $8.32 | Clustered support / Fib 0.382-0.500 |
| Support 2 | $7.28 | Lower support cluster |
Risk/Reward Framework
Scenario 1: Zone 1 Entry (Support Cluster Pullback)
- Entry: $7.28-$8.32 (pullback to clustered support / Fib 0.382-0.500)
- Target: $11.70 (clustered pivot resistance)
- Stop: $7.06 (below all clustered support; ~30% below current price)
- R:R: 2.7:1 (to T1 from Zone 1 midpoint) / 5.5:1 (to T2 from Zone 1 midpoint)
- Probability: Moderate (requires meaningful pullback from current consolidation)
Scenario 2: Zone 2 Entry (Current Consolidation Hold)
- Entry: $9.66-$10.09 (current consolidation at Fib 0.618 holds)
- Target: $11.70 (clustered pivot resistance)
- Stop: $7.06 (below all clustered support)
- R:R: ~0.6:1 (to T1, unfavorable at current levels)
- Probability: Higher probability of reaching entry, but poor R:R
Conviction Assessment
| Component | Value | Rationale |
|---|---|---|
| Fund-Tech Agreement | 0.30 | Conflicting -- AVOID (41.5/100) vs Neutral (6.0/10) with constructive structure |
| Catalyst Density | 0.60 | Moderate -- binary March 18 earnings is the key catalyst |
| Data Quality | 0.30 | Micro-cap, sparse institutional data, limited analyst coverage |
| Risk/Reward Asymmetry | 0.65 | R:R 2.7:1 from Zone 1 to T1; favorable from lower entry zones |
| Red Flag Severity | 0.70 | All disclosed/structural -- extreme valuation, short interest, dilution |
Conviction Score: 3 (Moderate) Weighted Score: 47.0/100 Position Sizing: 50% of target (starter position)
Actionable Framework
Position Type: Avoid (fundamentals override -- AVOID verdict) Position Size: 0% recommended. If speculating against the AVOID verdict (i.e., betting on the narrative trade), limit to 1-2% max (lottery ticket sizing).
Entry Zones: - Zone 1: $7.28-$8.32 | Trigger: pullback to clustered support / Fib 0.382-0.500 - Zone 2: $9.66-$10.09 | Trigger: current consolidation at Fib 0.618 holds
Stop Loss: $7.06 | Below all clustered support; ~30% below current price
Targets: - Target 1: $11.70 | Clustered pivot resistance - Target 2: $15.28 | 52-week high retest
Key Monitoring Triggers:
Upgrade thesis if: - March 18 earnings confirm or raise FY2026 guidance to $170M+ revenue with credible organic growth detail; AND short interest declines below 25%
Downgrade thesis if: - FY2026 guidance cut below $150M; OR management announces additional equity offering; OR short interest exceeds 40%
Exit immediately if: - Breaks below $7.06 on volume (below all support clusters); OR goodwill impairment announced on acquired entities
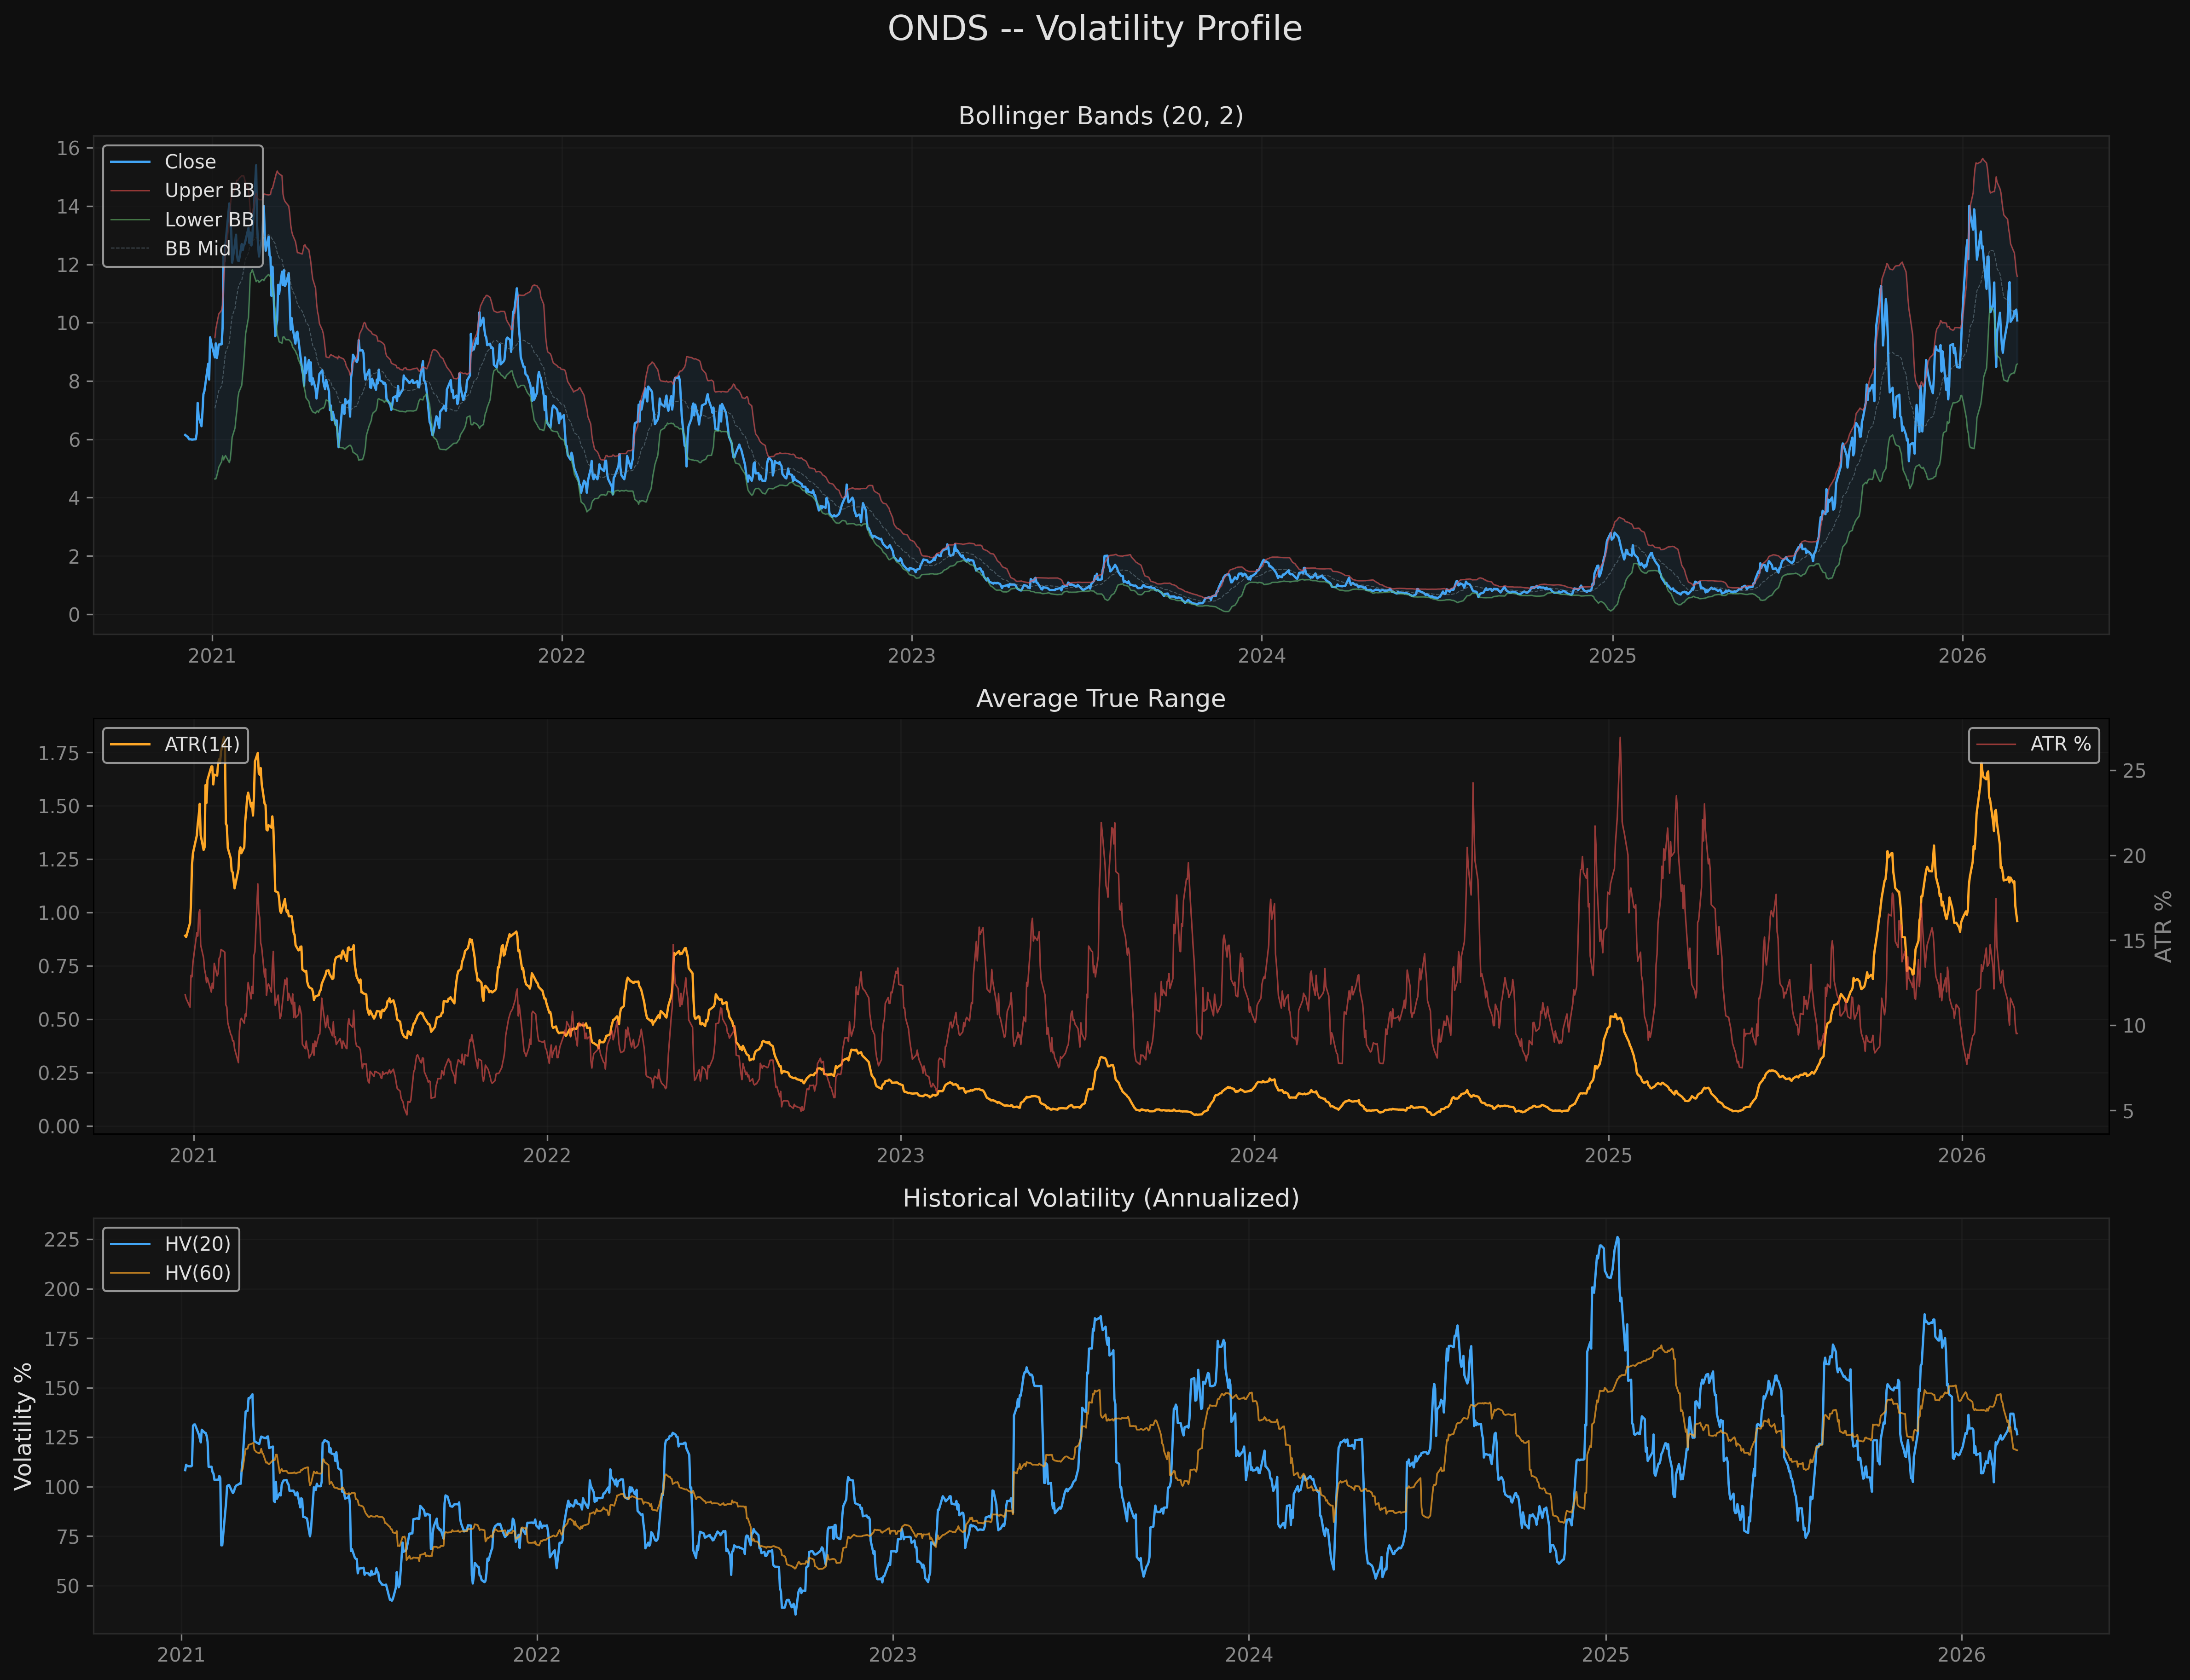
Limitations: - Micro-cap with extremely limited institutional coverage and sparse analyst estimates - Revenue history includes a -54% FY2024 decline, making trend analysis unreliable - All 2025 revenue growth is inorganic (acquisitions); organic growth cannot be isolated - Extreme volatility (ATR 9.5% of price, HV 126.5% annualized) means stop losses may be triggered by normal daily noise rather than trend changes - Short interest data is reported with a lag; the 33.2% figure may already be stale - FY2025 preliminary revenue ($48.6M) is unaudited; official figures on March 18
Charts