IREN — Technical Summary
Conviction 3IREN -- Technical Deep Dive
- Date: 2026-03-28
- Researcher: Quant Researcher (Signals)
- Status: Complete
- Script:
analysis/quant-research/scripts/IREN-technical-2026-03-28.py - Charts:
analysis/quant-research/charts/iren_*.png
Plain language summary: IREN has been in a steep downtrend since peaking near $77 in November 2025. The stock is currently 54% below that high, trading below every major moving average, and making lower highs and lower lows. Momentum indicators are deeply oversold, which could set up a short-term bounce, but there is no evidence yet that the trend has reversed. This is a falling-knife situation until price reclaims at least its 20-day moving average around $41.
1. Score Box
===========================================================
  IREN -- Technical Analysis                   2026-03-28
  Asset Class: Equity
  Price: $35.09  |  52wk: $5.12 - $76.87
===========================================================

  OVERALL SCORE: 2.9/10      BIAS: Bearish

  COMPONENT SCORES
  -----------------------------------------------------------
  Trend Alignment         2.5/10  wt 25%  Below all MAs, slopes negative
  Momentum                3.0/10  wt 20%  Stochastic oversold, MACD bearish
  Volume Confirmation     3.5/10  wt 20%  OBV/A-D falling, distribution
  Volatility Profile      4.0/10  wt 15%  ATR 10% of price, BB breach
  Market Structure        2.0/10  wt 20%  Lower highs + lower lows

  KEY LEVELS
  -----------------------------------------------------------
  Resistance 2:  $45.19   SMA 50 / prior distribution zone
  Resistance 1:  $38.45   SMA 200 / nearest overhead supply
  Current Price: $35.09
  Support 1:     $33.34   Dec 2025 swing low
  Support 2:     $29.00   Round number / no recent test

  RED FLAGS                                    (3 found)
  -----------------------------------------------------------
  HIGH   Price below all major MAs             [Trend]
  HIGH   Lower highs AND lower lows            [Structure]
  MEDIUM BB %B below zero (outside bands)      [Volatility]

===========================================================
2. Executive Summary
IREN is in a confirmed downtrend following a parabolic run from $5 to $77 between August and November 2025. The stock has now retraced 54.4% of that entire move and sits below every major moving average -- the 20-day ($40.66), 50-day ($45.19), and 200-day ($38.45). The most recent price action carved a lower high at $47.25 (Feb 25) and a lower low at $35.63 (Mar 9), with Thursday's close at $35.09 breaking that swing low.
Momentum is deeply negative: RSI(14) reads 37.2 (heading toward oversold), MACD crossed bearishly on March 26, and the Stochastic oscillator is at 4.9 -- deeply oversold territory. Bollinger Band %B is -0.067, meaning price has breached the lower band, which statistically tends to mark short-term exhaustion but does not guarantee a reversal.
Volume patterns confirm distribution. OBV has dropped from 679M to 559M over the last 20 sessions, and the A/D line is also falling. The one marginally positive data point is the up/down volume ratio of 1.11, suggesting selling pressure is not yet at capitulation-level extremes.
The ATR ratio of 0.754 indicates a squeeze is active (below the 0.90 threshold), which means volatility is compressed relative to recent history. When this squeeze breaks, the move should be directional -- but given the trend context, the path of least resistance is down.
Bottom line: This is a falling knife with no reversal evidence. Oversold conditions may produce a dead-cat bounce toward the $38-41 zone (SMA 200 to SMA 20), but traders should not confuse an oversold bounce with a trend change. The December 2025 swing low at $33.34 is the last support before a potential air pocket to $29.
3. Price Structure
| Metric | Value |
|---|---|
| Current Price | $35.09 |
| 52-Week High | $76.87 (Nov 5, 2025) |
| 52-Week Low | $5.12 |
| All-Time High | $76.87 (Nov 5, 2025) |
| All-Time Low | $1.02 (Dec 28, 2022) |
| % from 52wk High | -54.4% |
| % from 52wk Low | +584.7% |
Recent Performance:
| Period | Return |
|---|---|
| 1 Week | -16.8% |
| 1 Month | -14.3% |
| 3 Months | -12.9% |
| 6 Months | -16.2% |
| 1 Year | +443.2% |
The short-term destruction is dramatic: a 16.8% drop in a single week. Despite this, the 1-year return remains extraordinarily positive at +443%, which reflects the scale of the 2025 rally from $5 to $77. The stock is now giving back a significant portion of those gains.
Fibonacci Retracement (52-week high to low):
| Level | Price | Status |
|---|---|---|
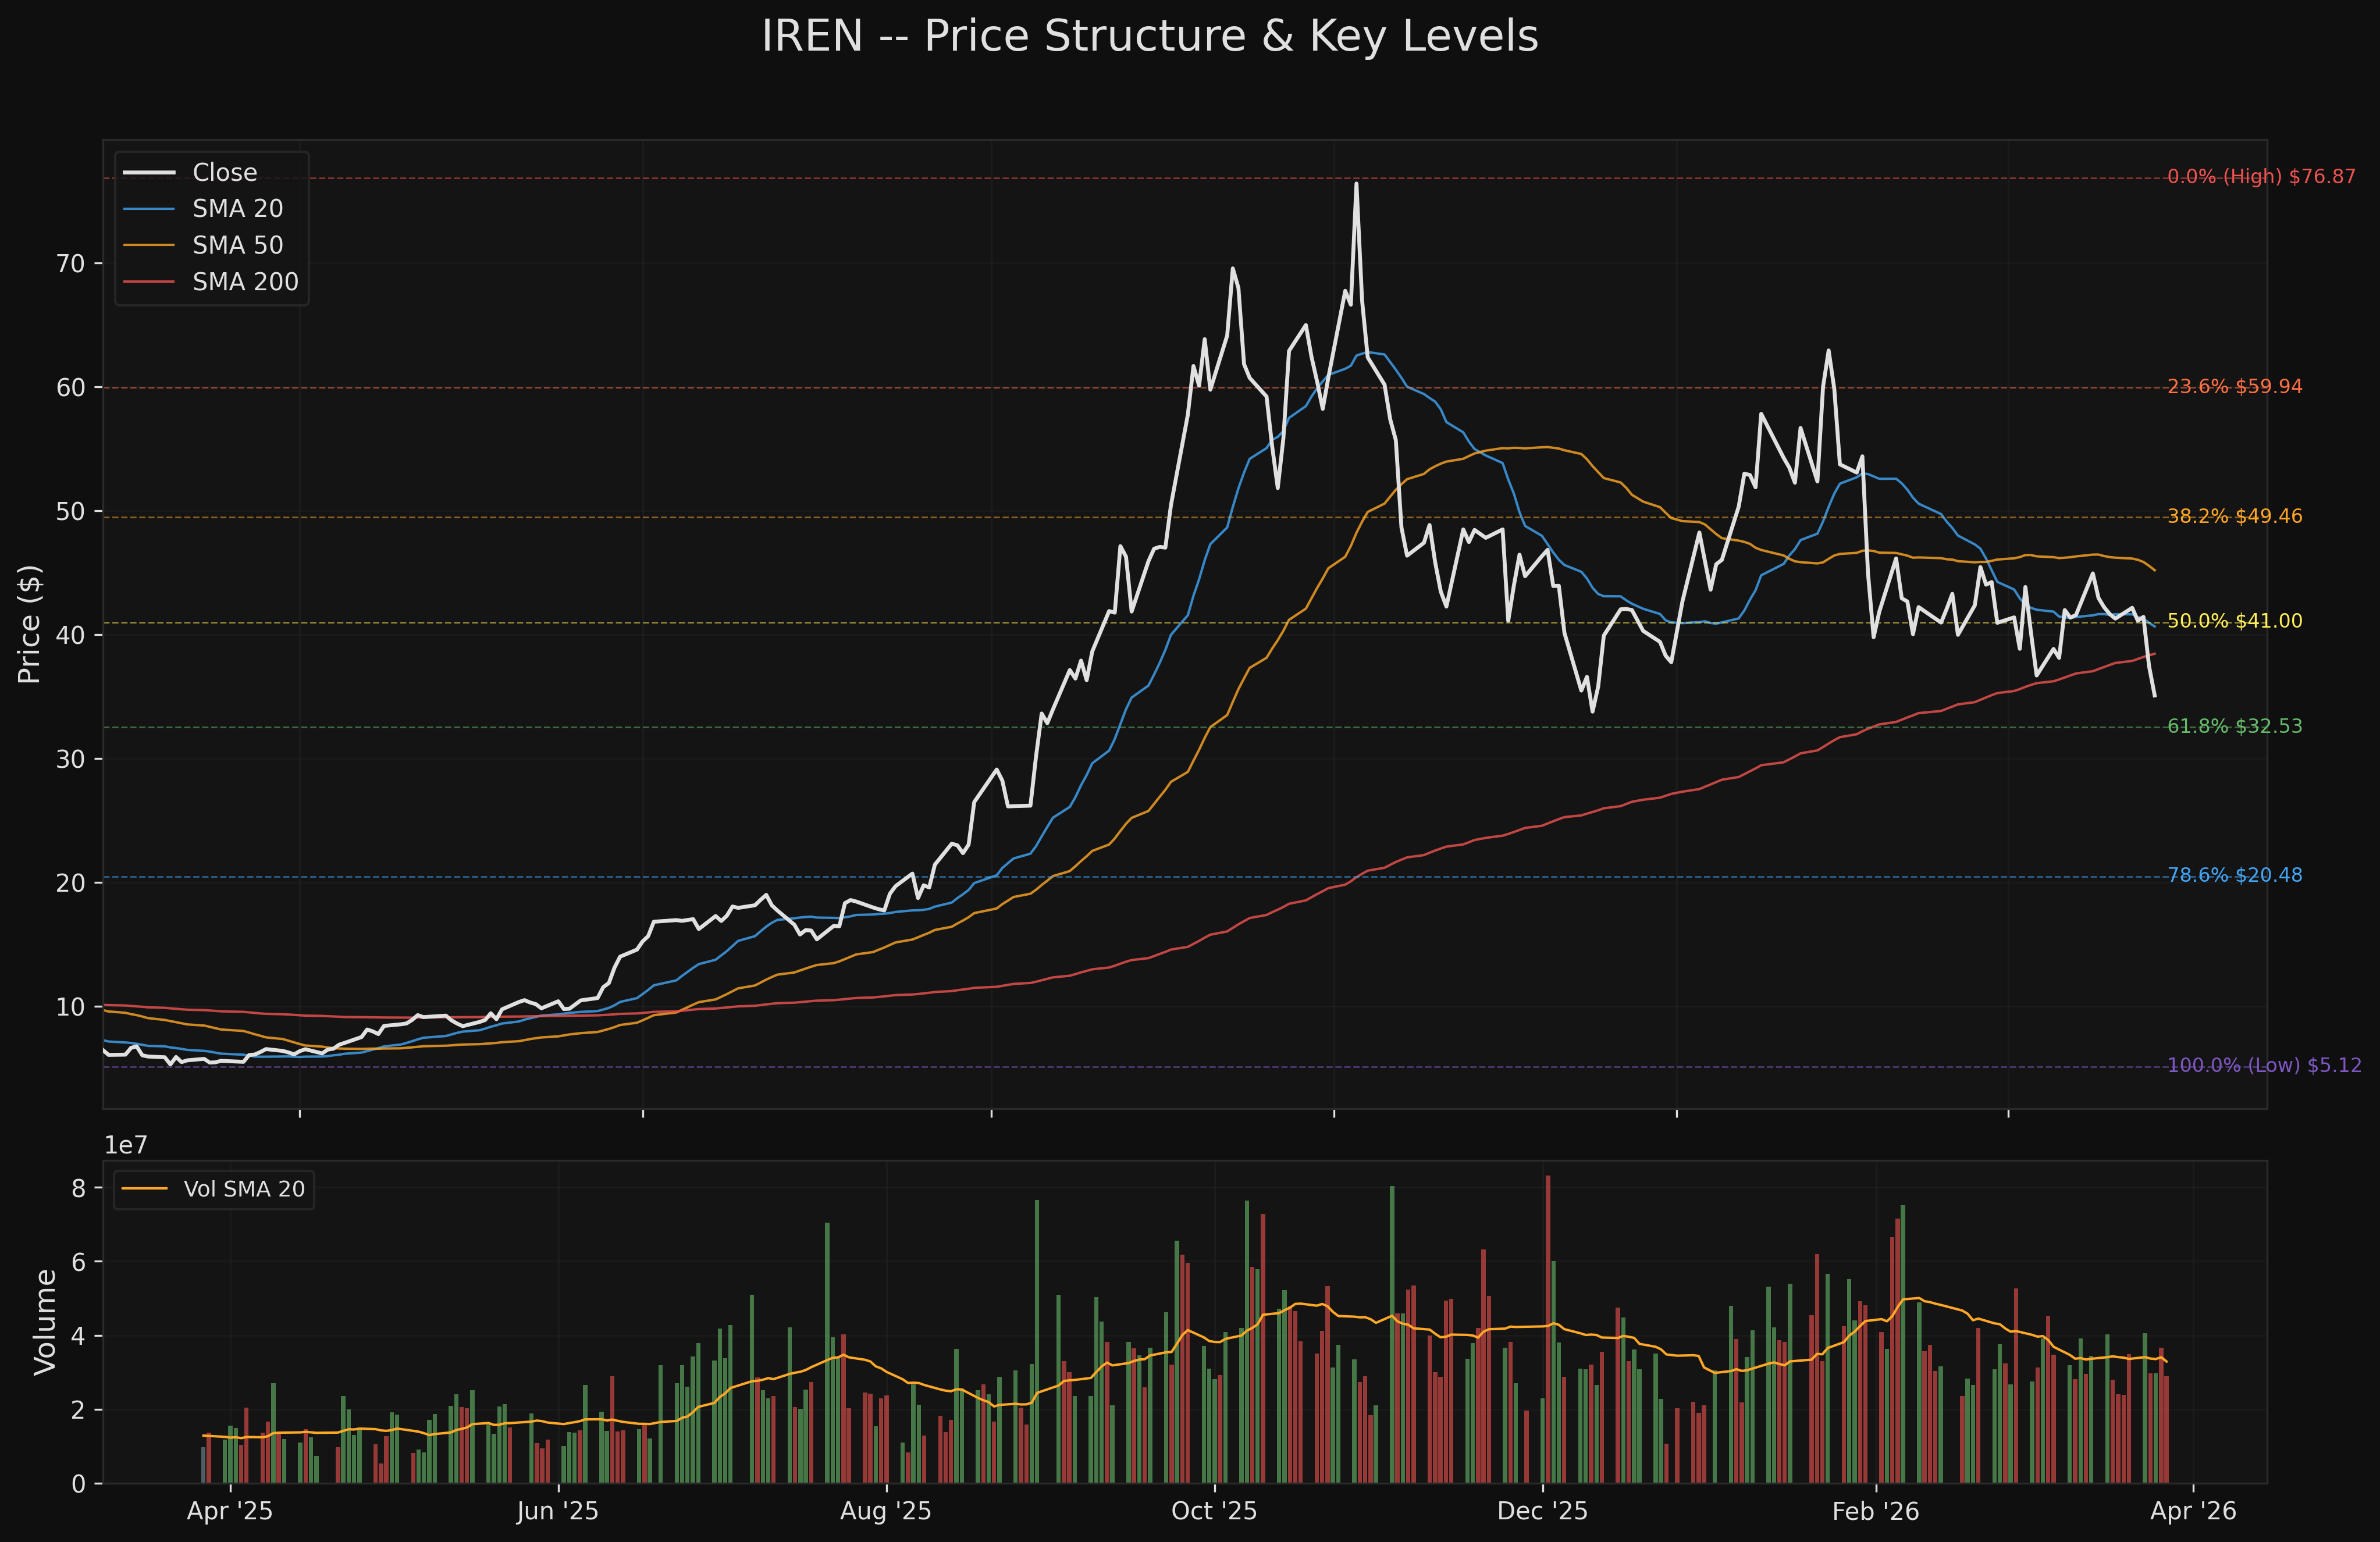
| 0.0% (High) | $76.87 | -- |
| 23.6% | $59.94 | -- |
| 38.2% | $49.46 | Lost on Feb 28 |
| 50.0% | $41.00 | Lost on Mar 26 |
| 61.8% | $32.53 | Next support below |
| 78.6% | $20.48 | Deep retracement |
| 100.0% (Low) | $5.12 | -- |
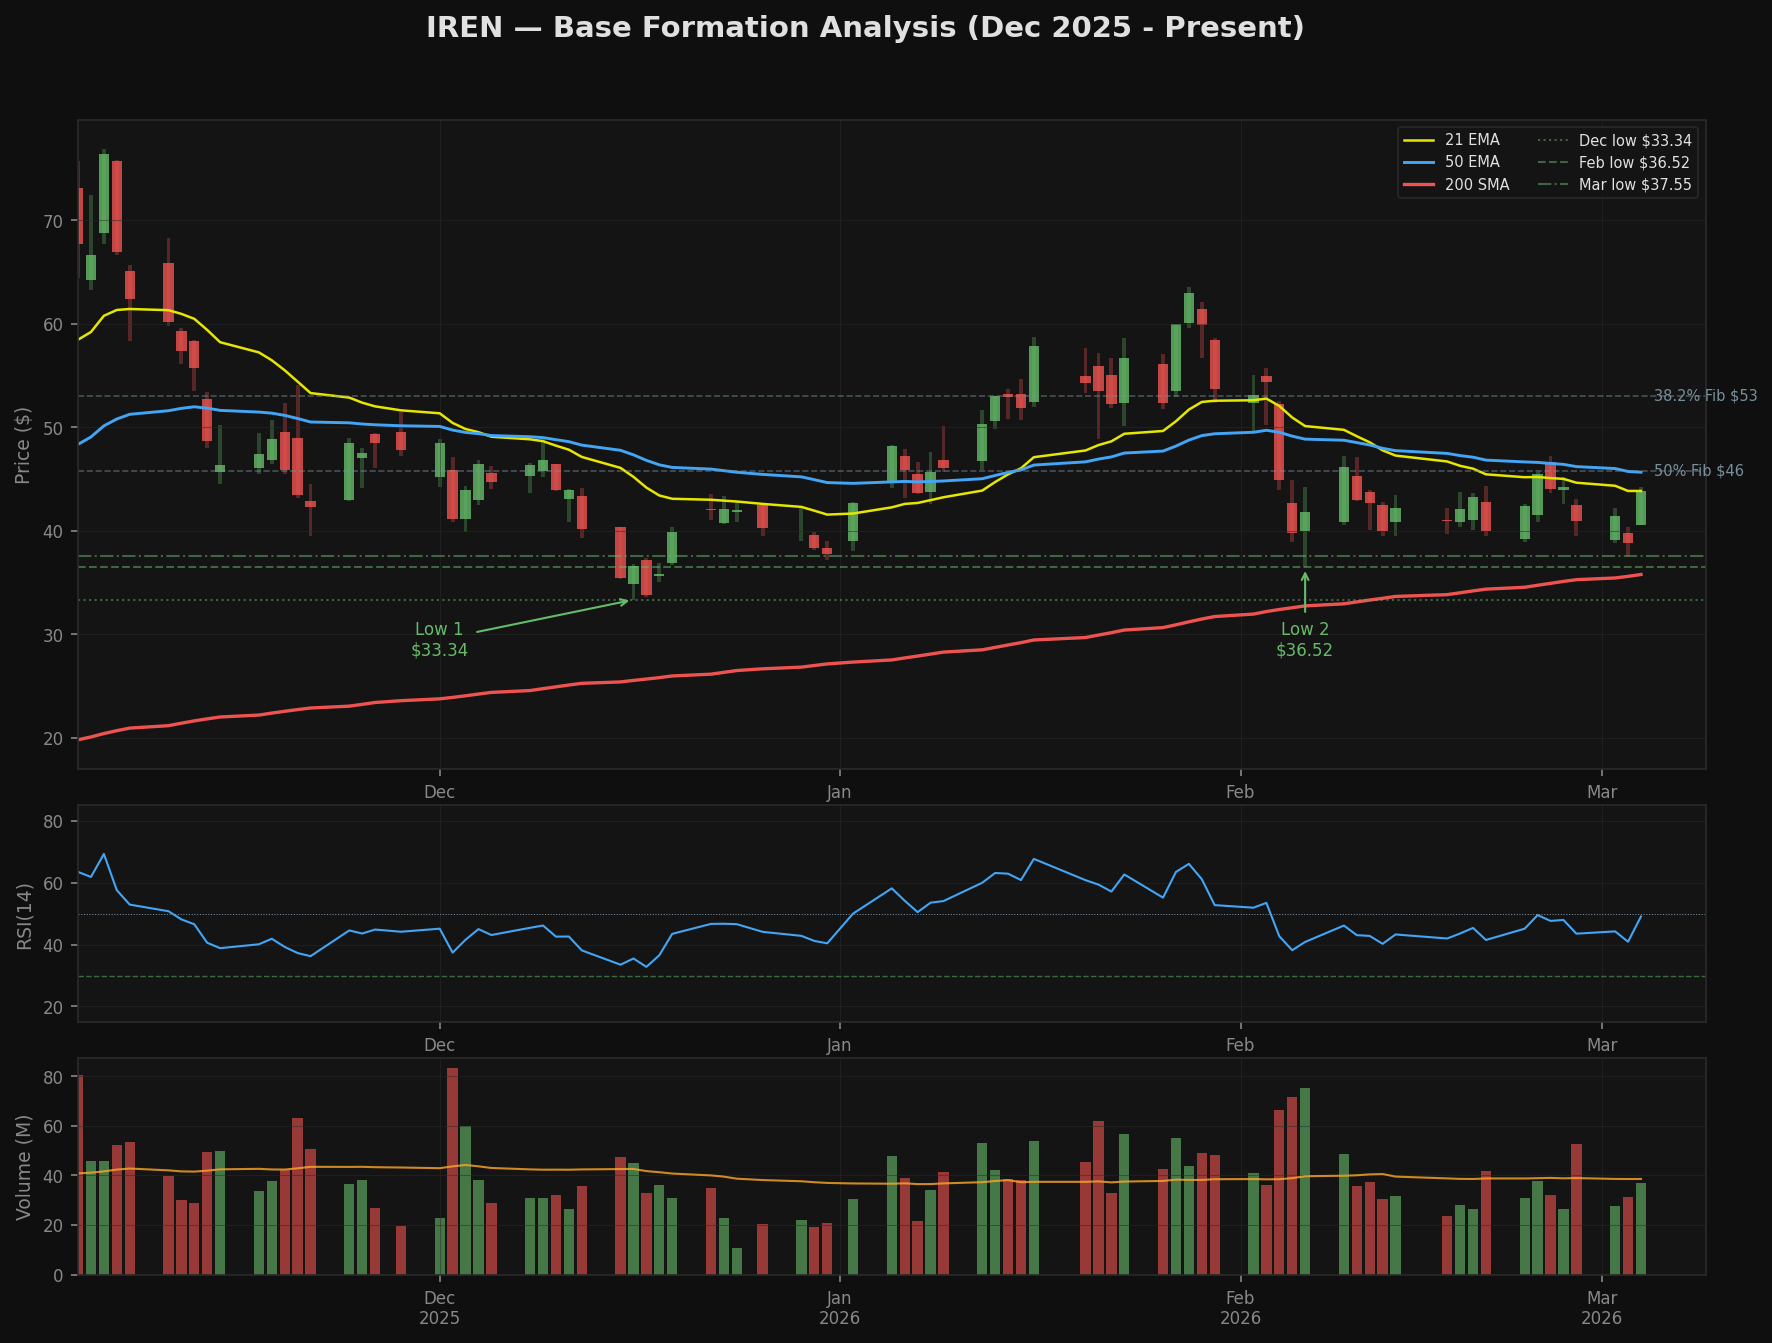
Price just lost the 50% Fibonacci retracement level ($41.00) this week. The 61.8% retracement at $32.53 is the next Fibonacci support, which sits just below the December 2025 swing low of $33.34. Confluence of those two levels ($32.53-$33.34) creates the most important support zone on the chart.
4. Market Structure
Wyckoff Phase Assessment: Distribution / Markdown
The price action since the November 2025 high exhibits textbook distribution characteristics transitioning to markdown:
| Evidence | Detail | Phase Indication |
|---|---|---|
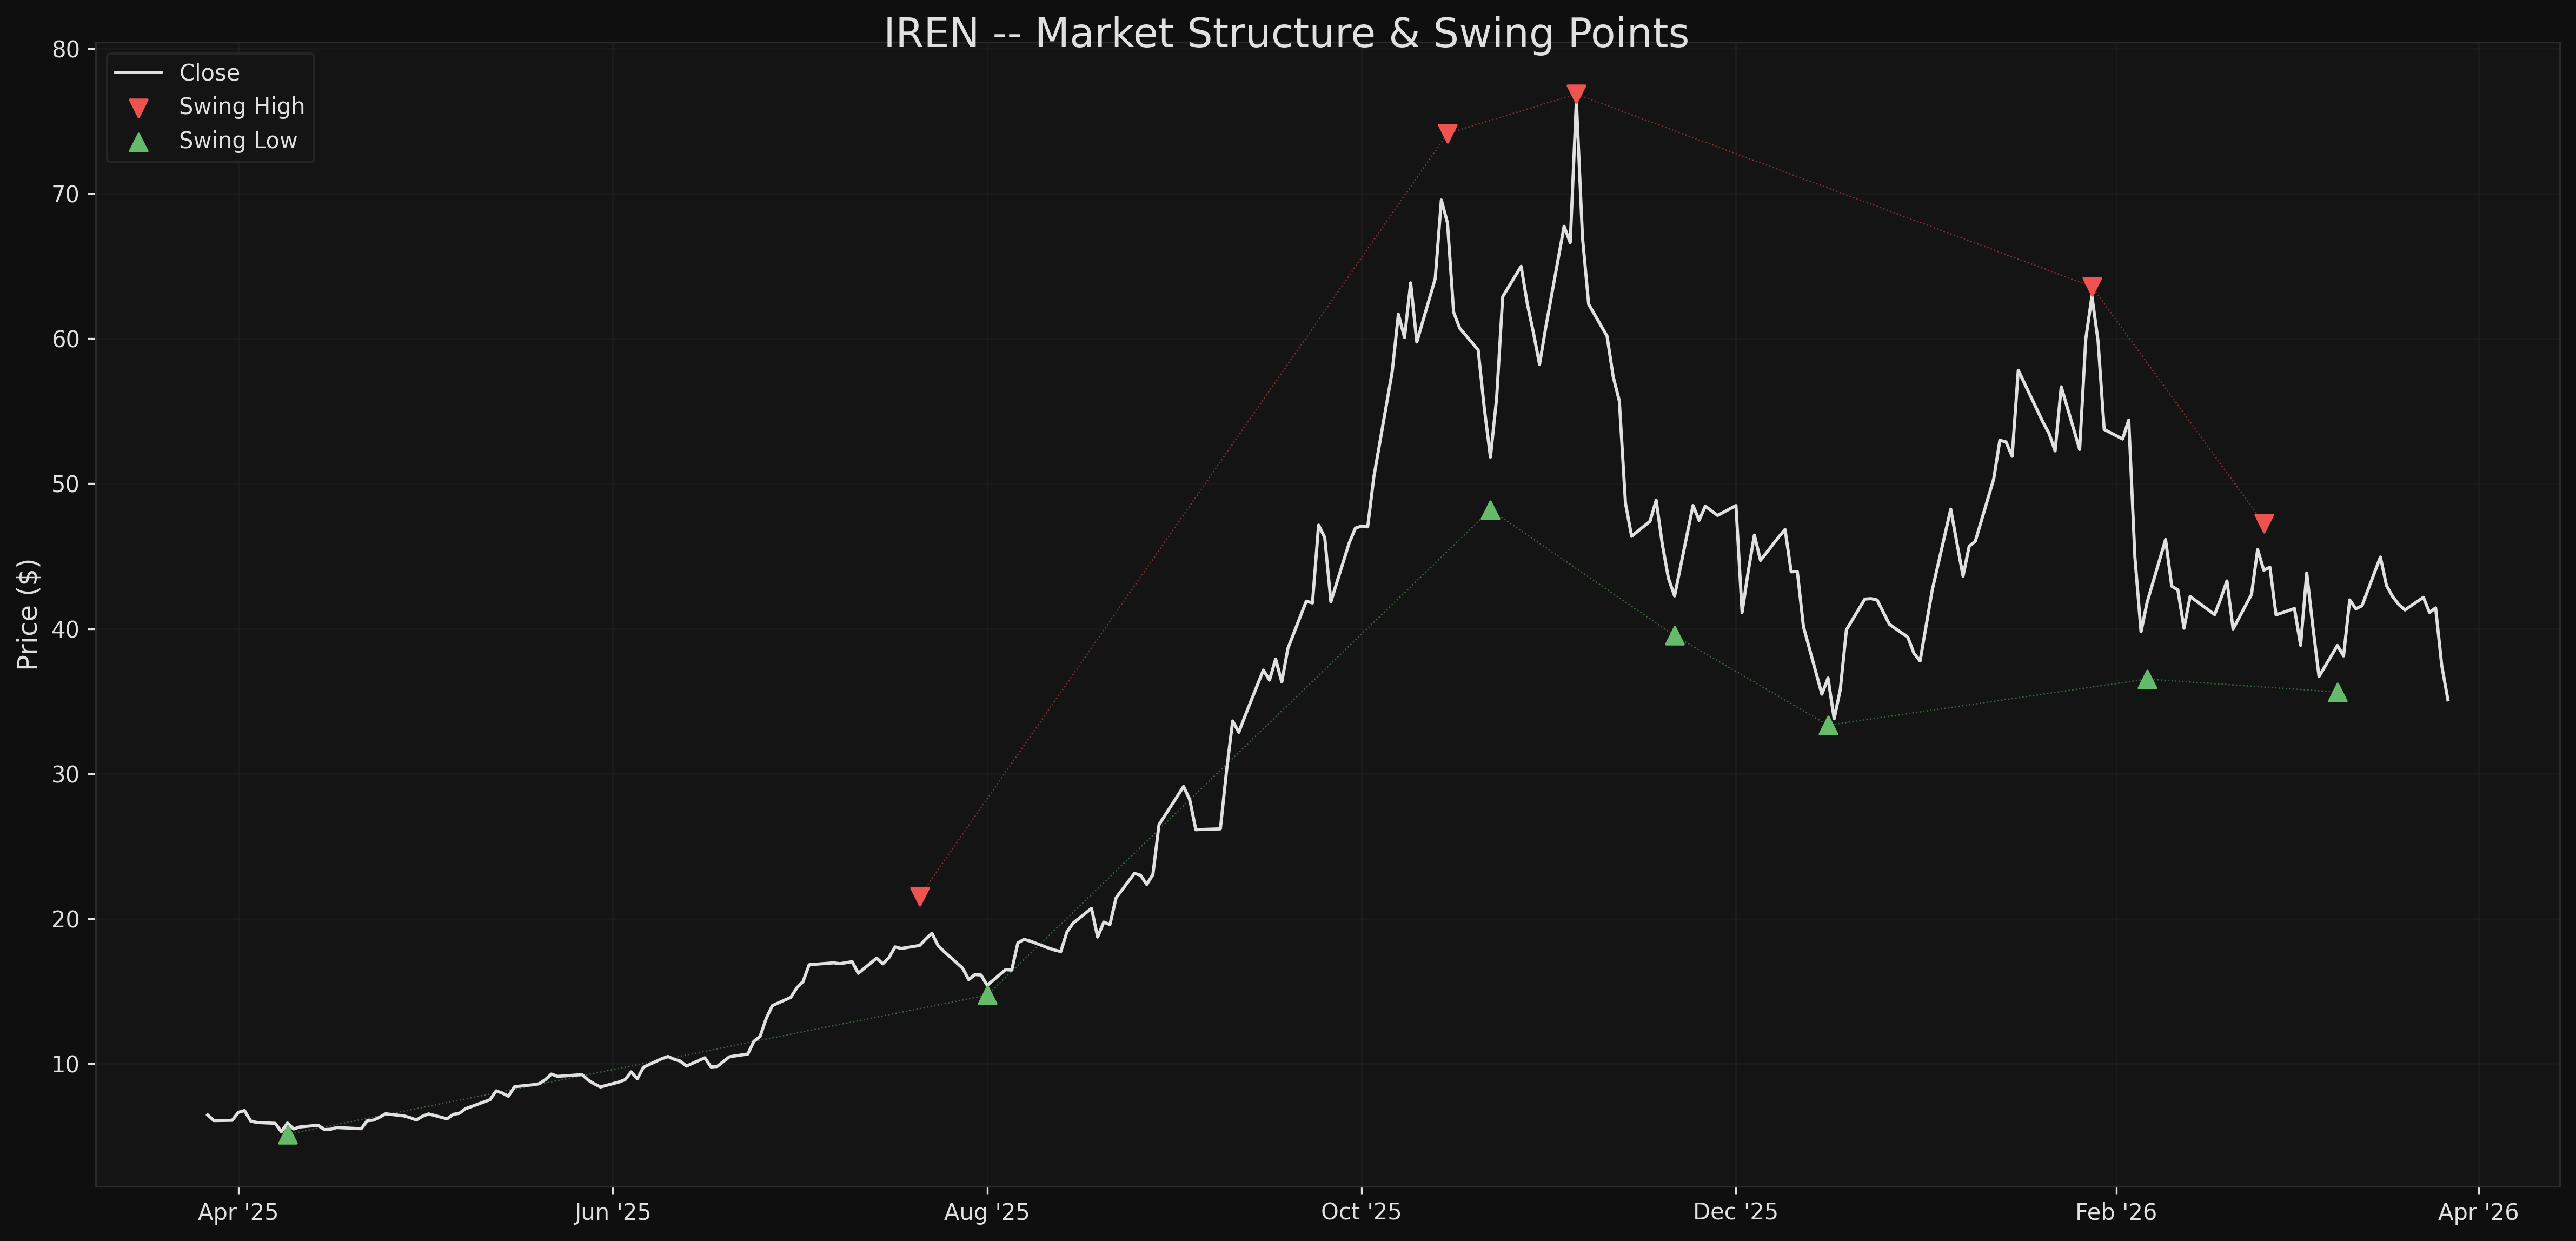
| Swing High Sequence | $74.15 -> $76.87 -> $63.59 -> $47.25 | Lower highs since Dec (Markdown) |
| Swing Low Sequence | $48.20 -> $39.52 -> $33.34 -> $36.52 -> $35.63 | Lower lows (Markdown) |
| Volume Trend | -6.9% (90d vs prior 90d) | Declining volume on rallies |
| Range Contraction | 0.307 vs 0.455 avg | Narrowing (possible selling exhaustion OR continuation setup) |
The sequence of lower highs ($76.87 -> $63.59 -> $47.25) and lower lows ($39.52 -> $33.34 -> $35.63) confirms a markdown phase. The only brief respite was the $36.52 -> $35.63 low sequence in February-March, which initially looked like it might hold as a higher low -- but Thursday's close at $35.09 broke below $35.63, invalidating that potential floor.
The 20-day price range has contracted to 0.307 (vs 0.455 average), meaning the selloff is occurring in a narrower band. This can precede either a volatility expansion to the downside (breakdown) or a capitulation-and-reversal event. Without a volume climax (selling exhaustion on massive volume), the former is more likely.
5. Momentum Analysis
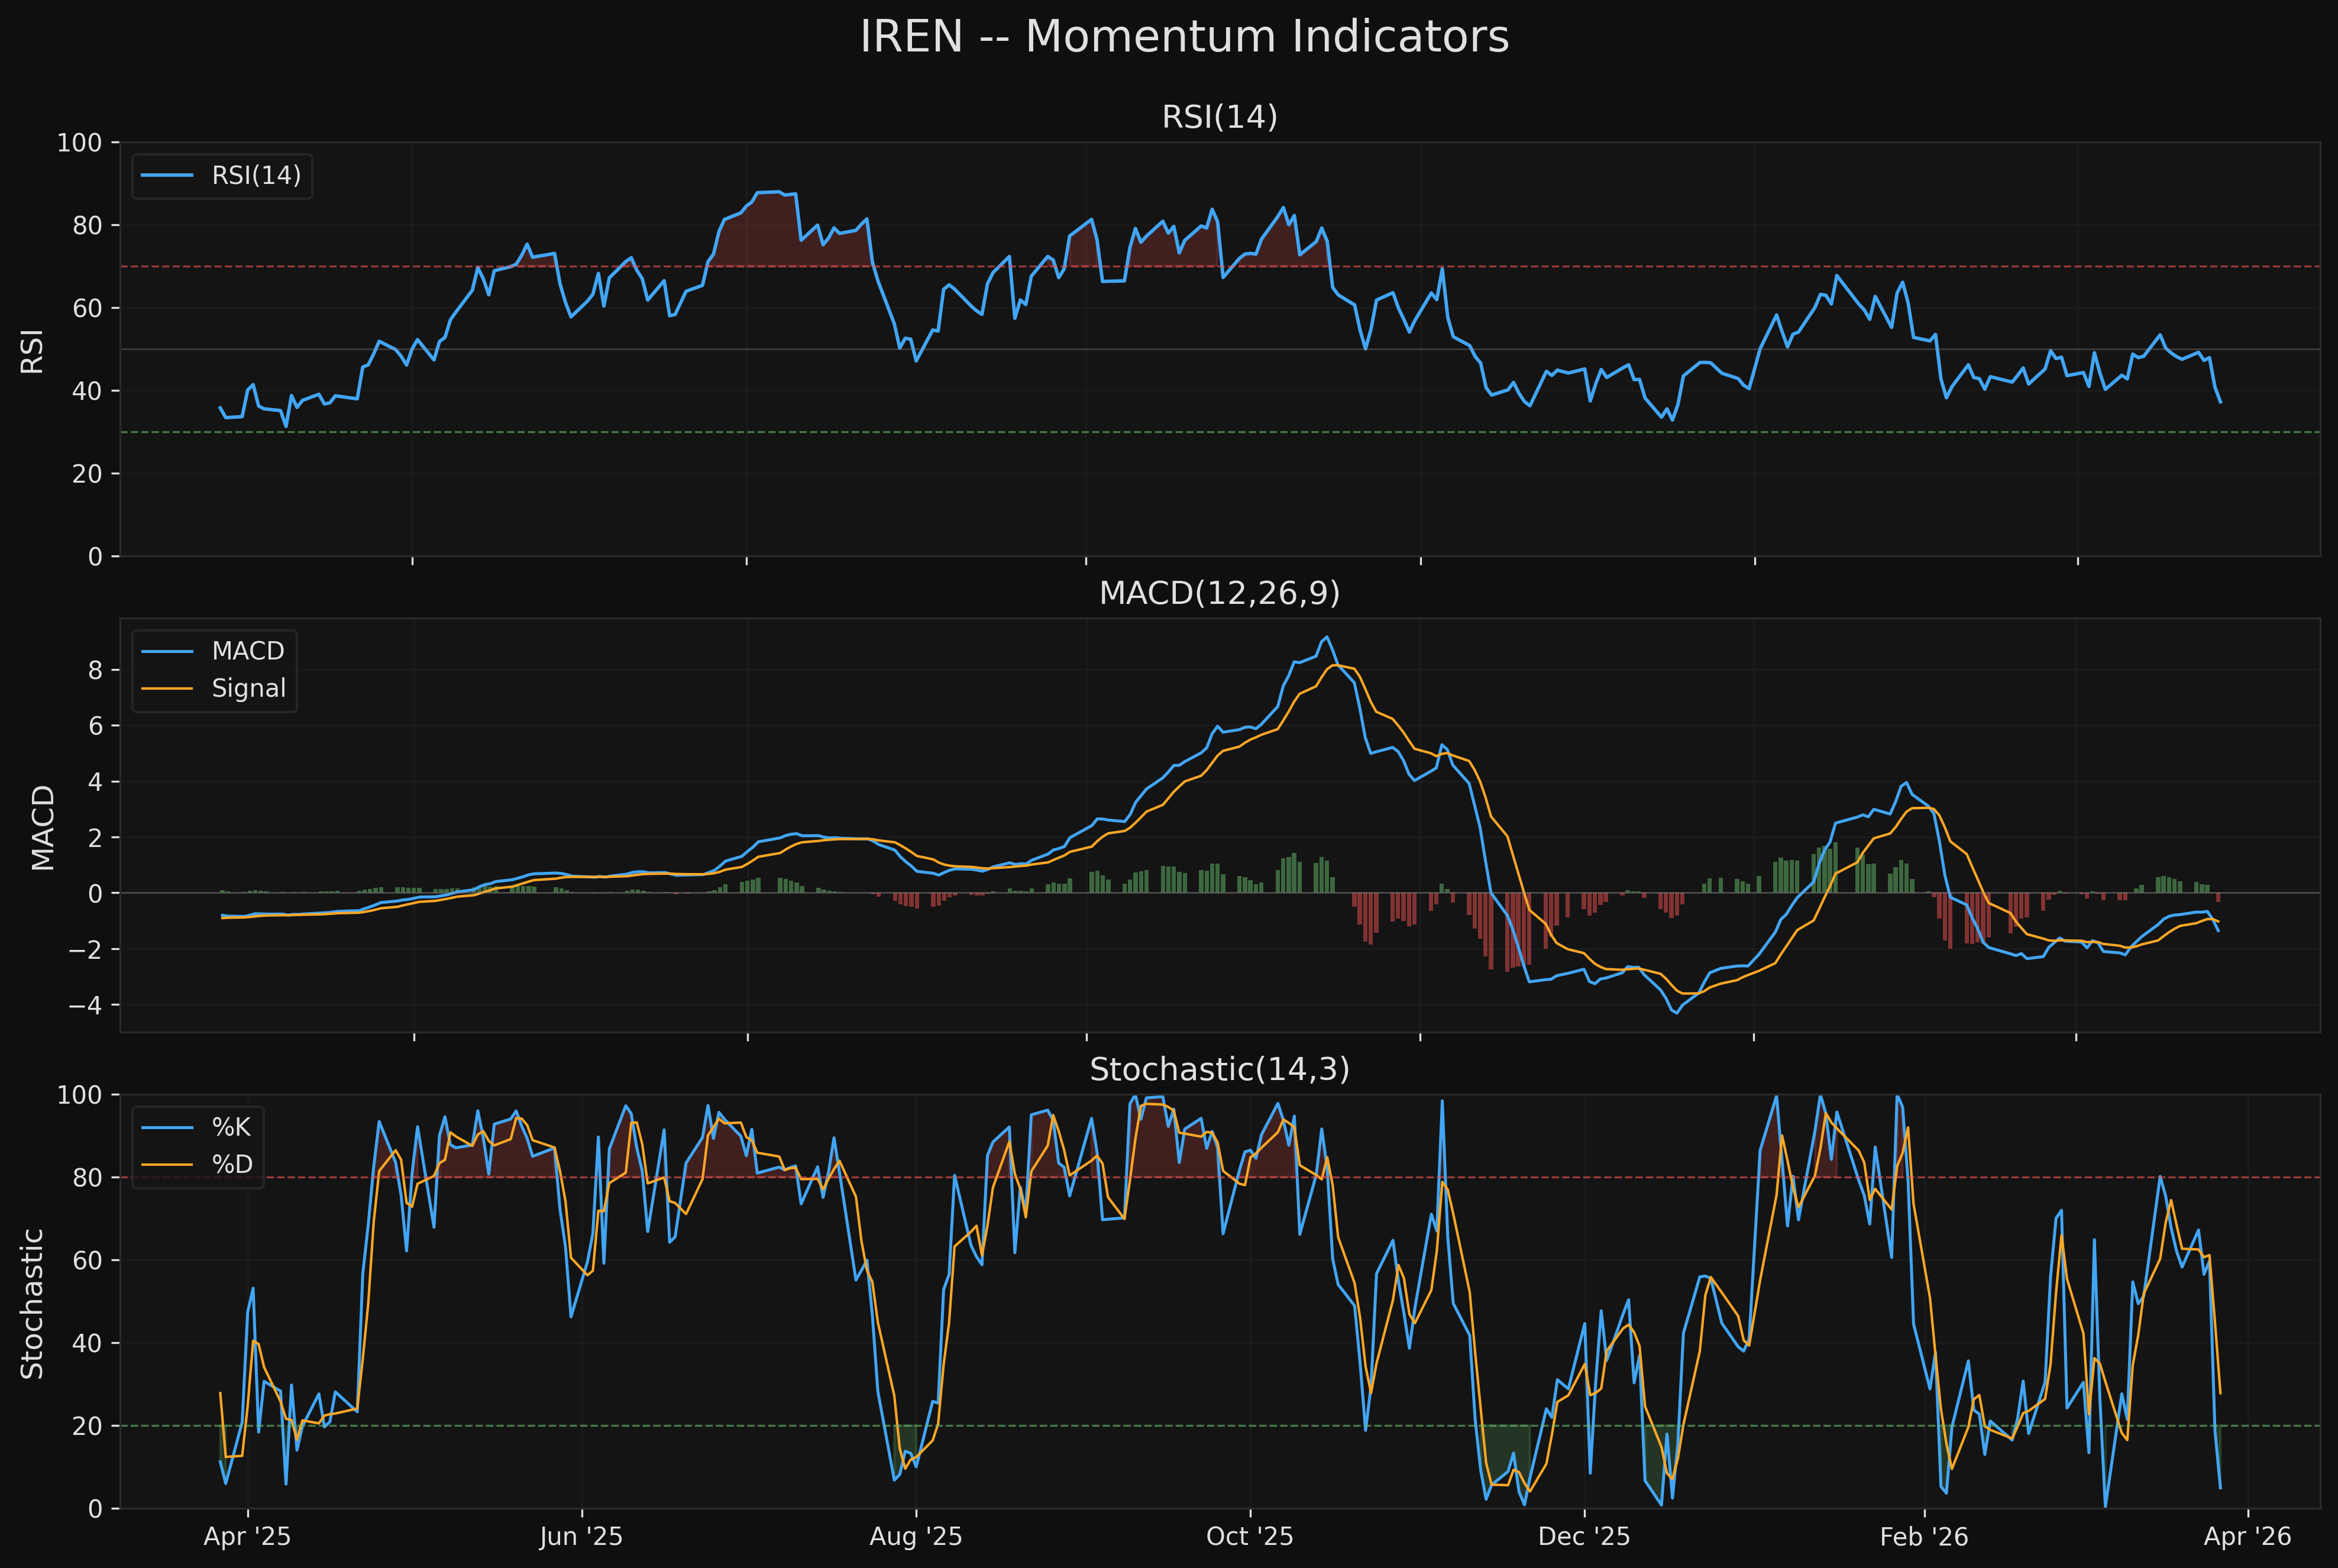
RSI(14): 37.2 -- Approaching oversold but not there yet. RSI was 49.2 just five sessions ago, reflecting the speed of the recent selloff. There is no bullish divergence: both price and RSI are trending lower over the last 60 days.
MACD(12,26,9):
| Component | Value | Interpretation |
|---|---|---|
| MACD Line | -1.354 | Well below zero |
| Signal Line | -1.024 | Below zero |
| Histogram | -0.330 | Bearish crossover on Mar 26 |
The MACD line crossed below its signal line on March 26, just two days ago. This is a fresh bearish signal. The histogram is expanding negatively, suggesting the selling momentum is still accelerating. MACD has been below the zero line since roughly early March, confirming the medium-term bearish bias.
Stochastic(14,3): %K = 4.9, %D = 27.8 -- The %K reading of 4.9 is extremely oversold. This is a level that typically produces at least a short-term bounce within 1-5 sessions. However, in strong downtrends, Stochastic can remain oversold for extended periods as price continues to fall. The %K/%D spread is wide (22.9 points), confirming rapid downside momentum.
Momentum Divergences: No bullish divergences are present. Price, RSI, and MACD are all trending lower together. This means any bounce from oversold conditions is more likely a mean-reversion trade than a trend reversal.
6. Moving Average Analysis
| Moving Average | Value | Price Distance | 10-day Slope | Signal |
|---|---|---|---|---|
| SMA 20 | $40.66 | -13.7% below | -2.16% | Bearish |
| SMA 50 | $45.19 | -22.4% below | -2.71% | Bearish |
| SMA 200 | $38.45 | -8.7% below | +8.50% | Rising (lagging) |
| EMA 12 | $40.10 | -12.5% below | -6.87% | Bearish |
| EMA 21 | $41.01 | -14.4% below | -7.53% | Bearish |
| EMA 50 | $43.10 | -18.6% below | -6.33% | Bearish |
Key observations:
- Price is below ALL six moving averages. This is the most bearish possible MA configuration. The last time to enter would have required price above at least the 20-day SMA.
- SMA 50 > SMA 200 (Golden Cross still intact) at $45.19 vs $38.45. However, this is a lagging indicator -- the SMA 50 is declining at -2.71% per 10 days, which means a Death Cross is likely within 4-8 weeks if the trend continues.
- EMA stack is fully bearish: Price < EMA 12 < EMA 21 < EMA 50. This stacking order confirms the downtrend across all short and medium timeframes.
- The SMA 200 is still rising (+8.50% over 10 days) because it reflects the massive 2025 rally. This will flatten and turn lower if price stays depressed. The SMA 200 at $38.45 is the first meaningful resistance overhead -- a 9.6% rally from current levels.
The distance from price to the SMA 50 (-22.4%) is extreme. Historically, extensions this large from the 50-day MA tend to produce a snap-back rally toward the mean. But that is a short-term trading signal, not a trend signal.
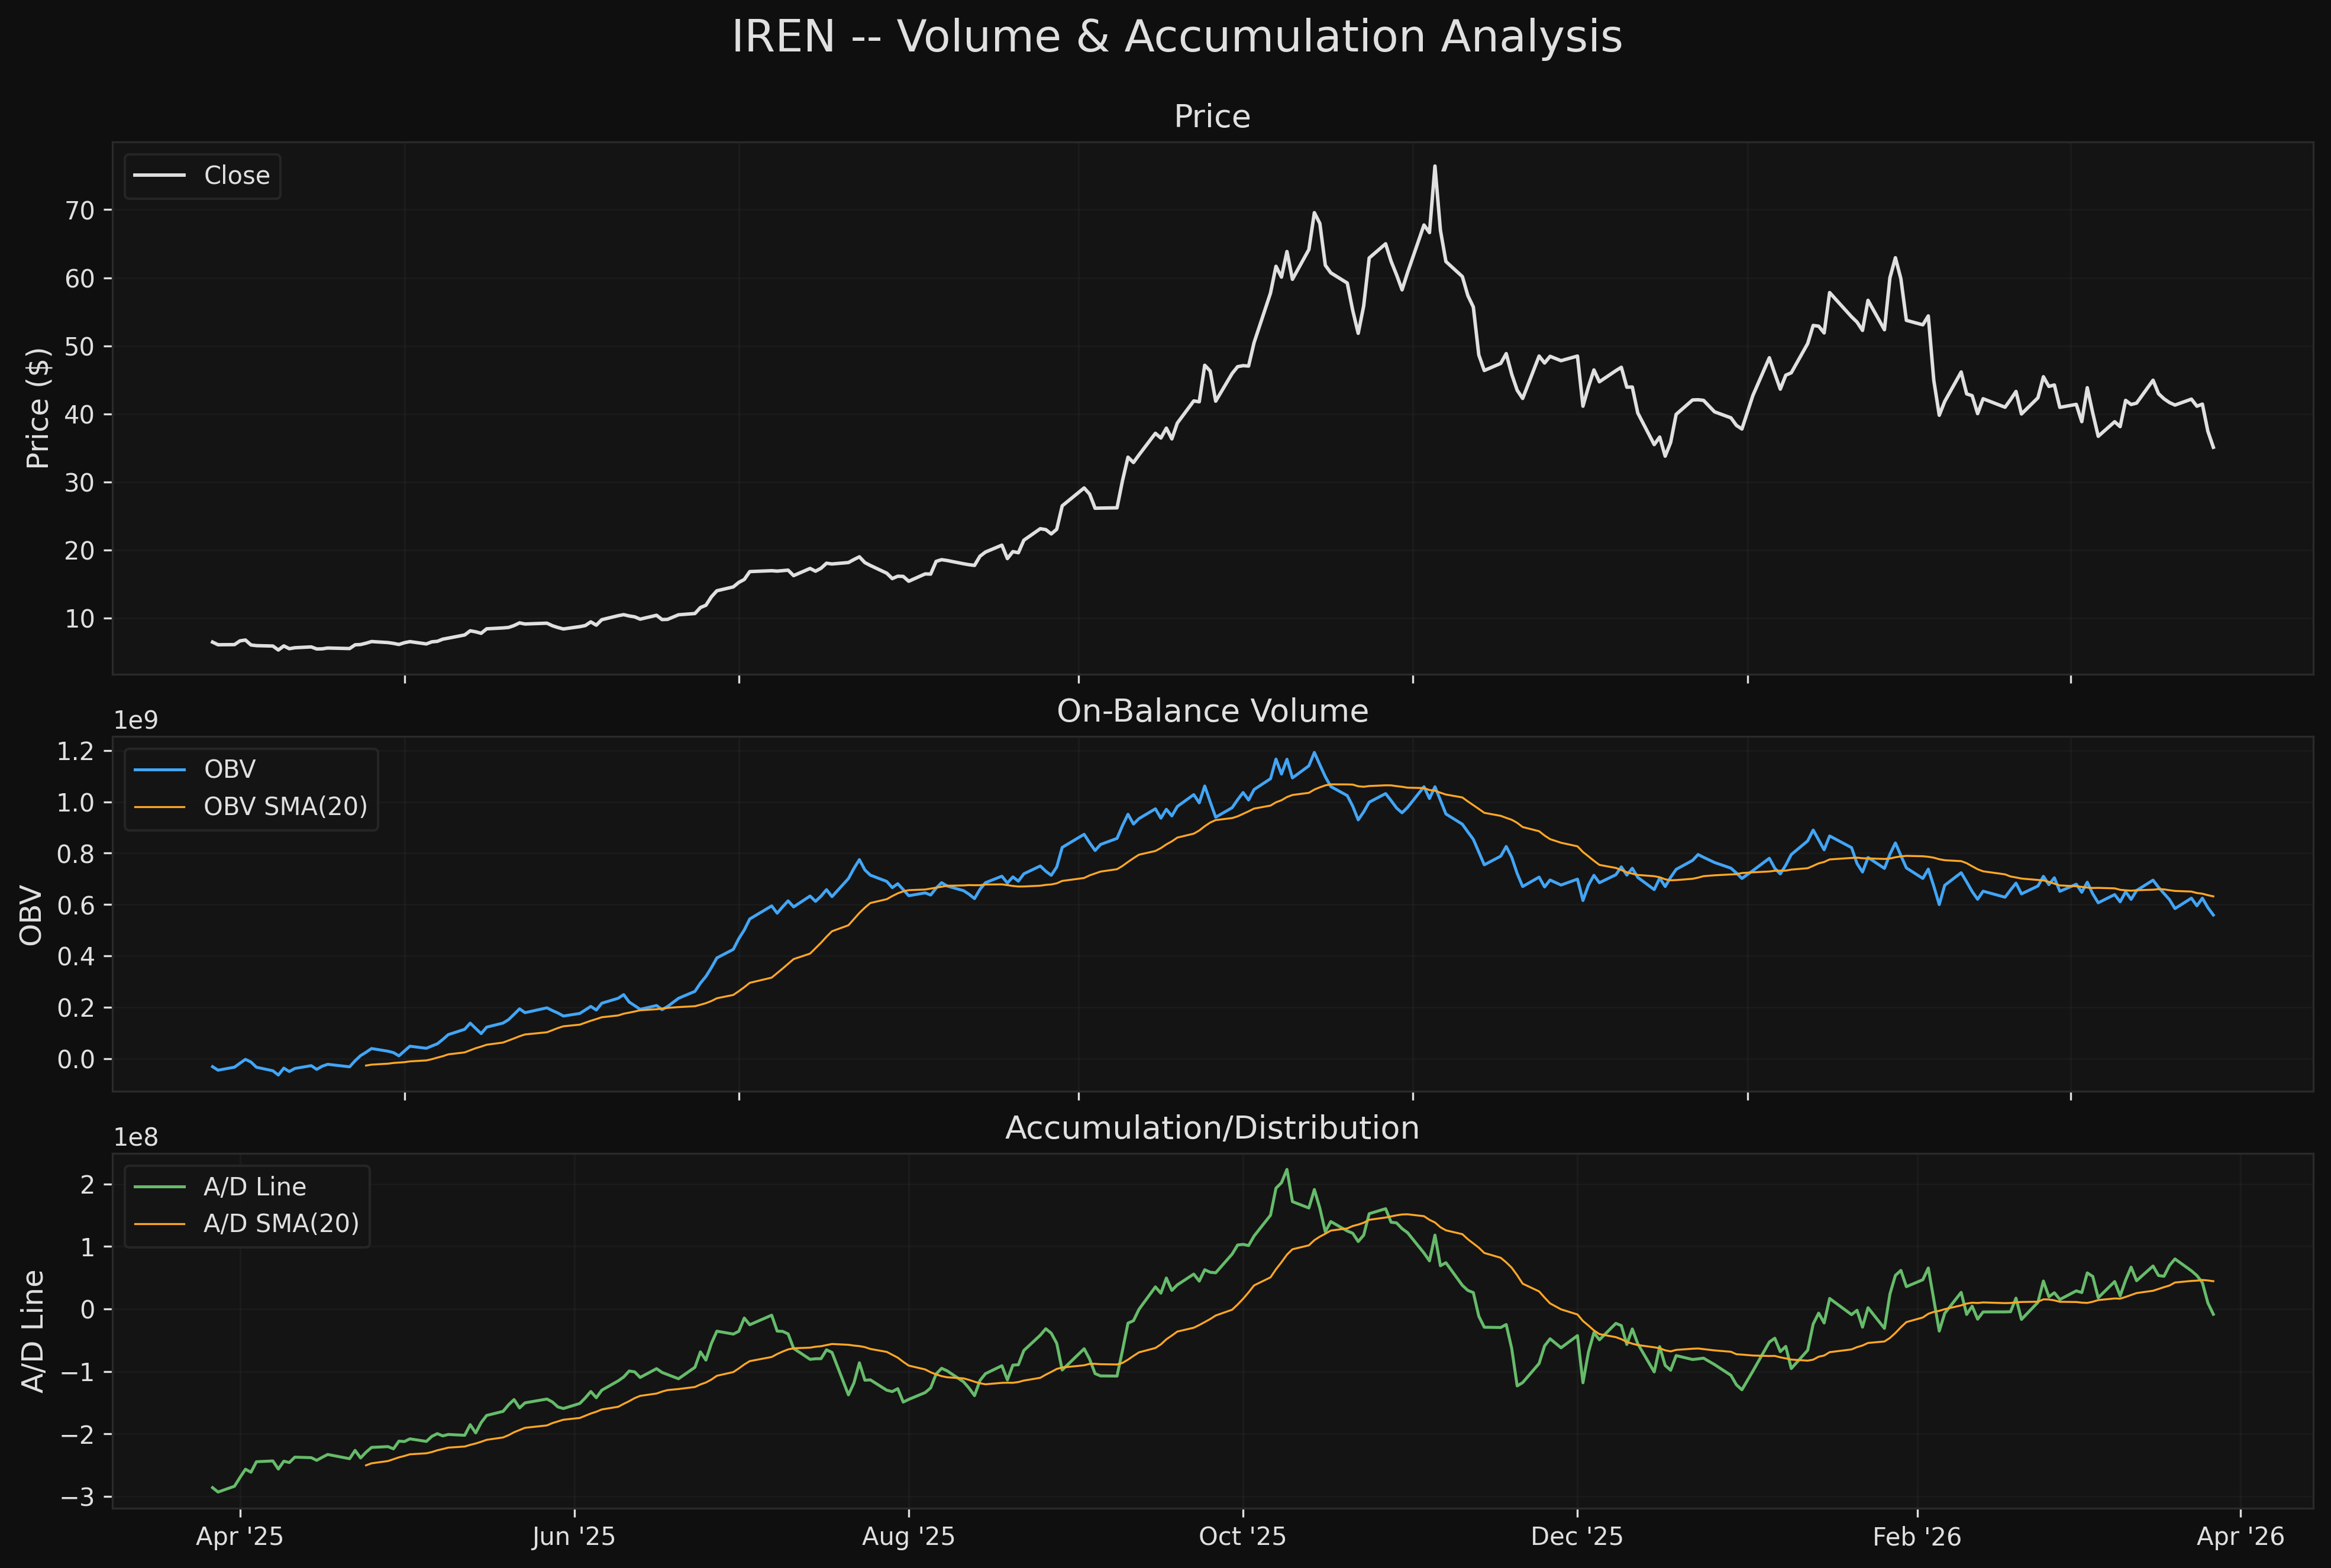
7. Volume Analysis
| Metric | Value | Interpretation |
|---|---|---|
| Current Volume | 28.95M | Below average |
| 20-day Avg Volume | 32.89M | Baseline |
| Volume Ratio | 0.88x | Slightly below average |
| OBV (current) | 559.4M | Falling |
| OBV (20d ago) | 679.2M | Lost 119.8M in 20 days |
| A/D Line Trend | Falling | Distribution |
| Up/Down Vol Ratio (20d) | 1.11 | Marginally positive |
OBV Analysis: The On-Balance Volume has declined by 119.8M over the last 20 sessions, confirming that volume is flowing out of the stock on down days and not returning on up days. The OBV trend aligns with the price downtrend -- no divergence, which means there is no hidden accumulation.
Accumulation/Distribution Line: Also falling, reinforcing the OBV signal. The close-location value (how high/low within each bar the close occurs) is skewing toward the lower end of daily ranges, indicating sellers are dominating intraday price action.
Volume on Declines: The recent selloff (March 23-27) saw volume of 40.6M, 29.8M, 29.8M, 36.7M, and 29.0M. The March 26 bar ($40.68 -> $37.45, -10.6% intraday range) on 36.7M volume is notable -- a high-volume down day that may represent capitulation by a cohort of holders, but not yet a climactic volume spike (IREN has seen 76M+ volume days).
Up/Down Ratio: At 1.11, this is marginally positive, meaning up-day volume slightly exceeds down-day volume over the last 20 sessions. This is the only volume metric that is not outright bearish. It suggests that while the stock is declining, it is not yet in a full panic-liquidation mode.
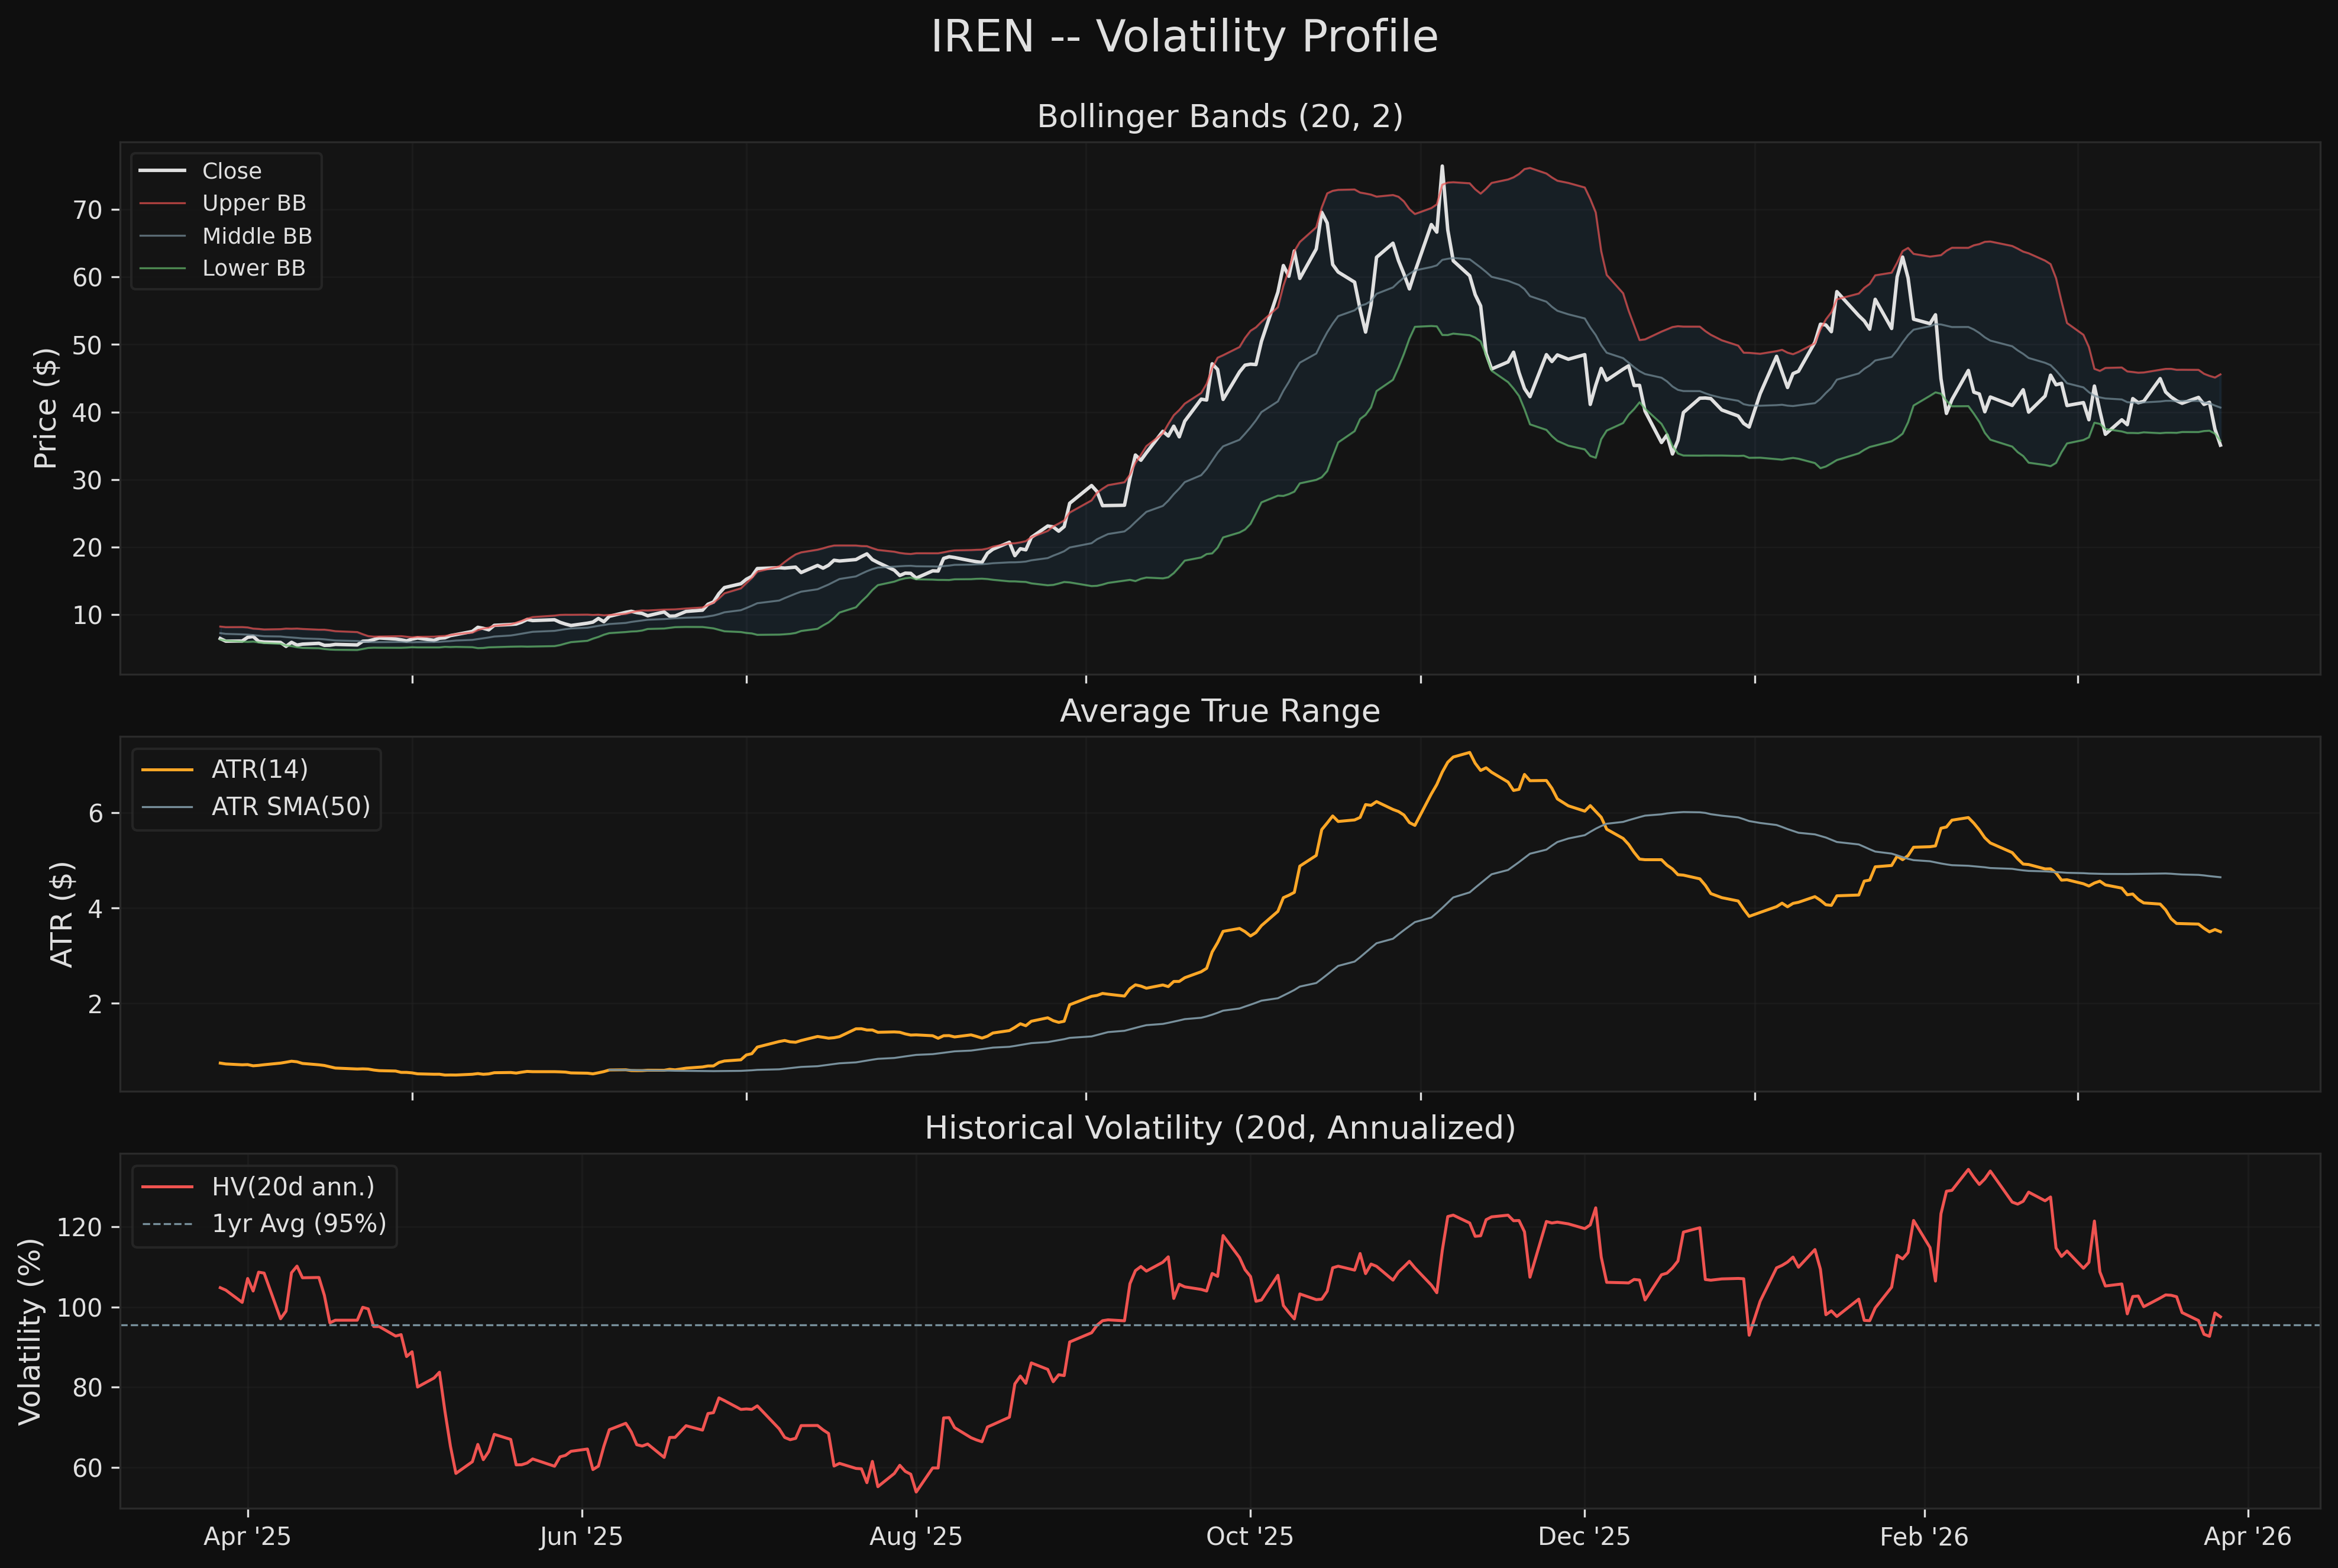
8. Volatility Profile
| Metric | Value | Context |
|---|---|---|
| ATR(14) | $3.50 | 10.0% of price -- extremely volatile |
| BB Width | 0.2416 | Wide bands reflecting recent range |
| BB %B | -0.067 | Below lower band (oversold) |
| Historical Vol (20d, ann.) | 97.5% | Slightly above 1yr avg of 95.4% |
| ATR Ratio | 0.754 | Squeeze active (below 0.90) |
| Return Skewness | 0.095 | Roughly symmetric |
| Return Kurtosis | -0.151 | Normal-tailed |
ATR Context: At $3.50, the ATR is 10.0% of the $35.09 price. This means normal daily fluctuations are $3.50, implying any position in IREN requires stops that can absorb $3-4 of noise per day. This is extremely wide for an equity -- for reference, SPY typically has an ATR around 0.8% of price. IREN is 12x more volatile.
Bollinger Band Breach: Price at $35.09 sits below the lower Bollinger Band, with %B at -0.067. Historically, closes outside the lower band tend to be followed by mean-reversion toward the midline ($40.66). However, in trending markets, walking the bands is common -- price can ride along the lower band for weeks.
Squeeze Status: The ATR ratio of 0.754 is well below the 0.90 squeeze threshold. Despite the recent sell-off, ATR is actually compressed relative to its own 50-day average. This means volatility could expand further. If the squeeze breaks to the downside, the next leg could be swift.
Return Distribution (252d): Returns are roughly symmetric (skew 0.095) with normal tails (kurtosis -0.151). The max daily gain was +15.3% and max daily loss was -17.4%. Daily standard deviation of 6.16% means that 2-sigma moves ($4.32 per day) are not uncommon for IREN.
9. Entry Point Assessment
Given the strong bearish trend, no high-conviction long entries exist. Two speculative zones are identified for traders who want to position for a mean-reversion bounce, ranked by risk/reward.
Zone 1: Fibonacci/Swing Confluence ($32.50 - $33.50)
- Rationale: The 61.8% Fibonacci retracement ($32.53) overlaps with the December 2025 swing low ($33.34). This is the highest-confluence support zone on the chart.
- Entry trigger: Bullish reversal candle (hammer, engulfing) at this zone with volume above 20-day average.
- Stop: Below $29.00 (round number support, -10.8% below zone midpoint).
- Target 1: SMA 200 at $38.45 (R:R approximately 1.6:1 from zone midpoint $33.00).
- Target 2: SMA 20 at $40.66 (R:R approximately 1.9:1 from zone midpoint).
- Quality: Moderate -- the trend is against you, but the zone is structurally significant.
Zone 2: Current Level Bounce ($34.50 - $36.00)
- Rationale: Stochastic is at 4.9 (deeply oversold), price just broke the March 9 swing low. Oversold bounces of 5-10% from these readings are common.
- Entry trigger: Intraday reversal with volume spike above 40M.
- Stop: Below $33.34 (Dec 2025 swing low, -5.0% below current).
- Target 1: SMA 200 at $38.45 (R:R approximately 1.9:1 from $35.09).
- Target 2: 50% Fibonacci at $41.00 (R:R approximately 3.4:1 from $35.09).
- Quality: Low -- no structural support at this exact level; purely a momentum-exhaustion play.
Not recommended: Buying for trend position. Until price reclaims the SMA 20 ($40.66) and holds it on a retest, there is no evidence of trend change. Buying the dip in a structural downtrend has negative expected value.
10. Risk/Reward Framework
Scenario 1: Mean-Reversion Bounce (Base Case -- 45% probability)
| Parameter | Value |
|---|---|
| Entry | $35.09 (current) |
| Stop Loss | $33.34 (Dec 2025 swing low) |
| Target | $38.45 (SMA 200) |
| Risk | $1.75 (5.0%) |
| Reward | $3.36 (9.6%) |
| R:R | 1.92:1 |
Logic: Deeply oversold Stochastic (4.9), BB %B below zero, and 16.8% decline in one week typically produce a 5-10% bounce within 1-2 weeks. The SMA 200 at $38.45 is the natural mean-reversion target. Risk is capped at the December swing low.
Scenario 2: Trend Continuation (Bear Case -- 40% probability)
| Parameter | Value |
|---|---|
| Entry | Short at $35.09 |
| Stop Loss | $38.50 (above SMA 200) |
| Target | $29.00 (round number support) |
| Risk | $3.41 (9.7%) |
| Reward | $6.09 (17.4%) |
| R:R | 1.79:1 |
Logic: The trend is clearly down. Lower highs, lower lows, below all MAs. If the December swing low ($33.34) breaks, the next structural support is around $29 with very little price history in between. The stop above the SMA 200 ensures you exit if the bounce scenario plays out.
Scenario 3: V-Shaped Recovery (Bull Case -- 15% probability)
| Parameter | Value |
|---|---|
| Entry | $35.09 (current) |
| Stop Loss | $33.34 (Dec swing low) |
| Target | $45.19 (SMA 50) |
| Risk | $1.75 (5.0%) |
| Reward | $10.10 (28.8%) |
| R:R | 5.77:1 |
Logic: If a macro or sector catalyst drives aggressive buying (e.g., BTC breakout, AI infrastructure spending announcement), the stock could rally hard from oversold conditions back to the SMA 50. The R:R is excellent but the probability is low given the structural damage.
11. Key Levels Summary
| Type | Level | Description | Significance |
|---|---|---|---|
| Resistance 3 | $49.46 | 38.2% Fibonacci retracement | Major -- last broken Feb 28 |
| Resistance 2 | $45.19 | SMA 50 | Major -- prior support, now resistance |
| Resistance 1 | $38.45 | SMA 200 | Major -- first overhead MA |
| Current Price | $35.09 | -- | -- |
| Support 1 | $33.34 | Dec 2025 swing low | Critical -- last tested support |
| Support 2 | $32.53 | 61.8% Fibonacci retracement | Major -- confluence with Support 1 |
| Support 3 | $29.00 | Round number | Psychological -- untested |
| Support 4 | $20.48 | 78.6% Fibonacci retracement | Deep -- massive gap below |
The $32.53-$33.34 zone is the most important level on the chart. It combines the 61.8% Fibonacci retracement of the 52-week range with the December 2025 swing low. A loss of this zone would open the door to $29 and potentially $20.
12. Overall Technical Score
| Component | Score | Weight | Weighted |
|---|---|---|---|
| Trend Alignment | 2.5/10 | 25% | 0.62 |
| Momentum | 3.0/10 | 20% | 0.60 |
| Volume Confirmation | 3.5/10 | 20% | 0.70 |
| Volatility Profile | 4.0/10 | 15% | 0.60 |
| Market Structure | 2.0/10 | 20% | 0.40 |
| Overall | 2.9/10 | 100% | 2.92 |
Score rationale by component:
-
Trend Alignment (2.5): Price is below all six tracked moving averages. All short/medium-term slopes are negative. The only positive is the still-intact Golden Cross (SMA 50 > SMA 200), which is a lagging artifact. Score reflects near-total bearish alignment with a small credit for the rising 200-day.
-
Momentum (3.0): RSI at 37.2 is approaching oversold but not yet there. MACD crossed bearish on March 26. Stochastic at 4.9 is deeply oversold, which earns a small bump since extreme oversold readings precede bounces. No bullish divergences anywhere. Score reflects all-negative momentum with a small oversold-bounce credit.
-
Volume Confirmation (3.5): OBV and A/D line are both falling, confirming distribution. Volume on the selloff is elevated but not climactic. The up/down volume ratio of 1.11 prevents a sub-3 score -- there is not yet panic selling. Score reflects confirmed distribution without capitulation.
-
Volatility Profile (4.0): The highest component score because elevated volatility cuts both ways. ATR of 10% of price means massive daily swings, which creates opportunity for mean-reversion trades. The squeeze (ATR ratio 0.754) signals a pending volatility expansion. BB %B below zero is statistically oversold. Score reflects dangerous-but-potentially-opportunistic conditions.
-
Market Structure (2.0): The lowest score. Lower highs ($76.87 -> $63.59 -> $47.25) and lower lows ($39.52 -> $33.34 -> $35.63 -> potentially lower). This is textbook markdown phase. No evidence of accumulation, no volume climax, no reversal pattern forming. Score reflects structural damage with no repair signals.
13. Limitations
Data quality: The TradingView OHLCV data covers 1,093 trading days (November 2021 to March 2026) with zero missing values. No data quality issues identified. However, IREN underwent a corporate name change and restructuring (formerly Iris Energy) which means early price data may reflect a different corporate structure.
52-week range caveat: The 52-week low of $5.12 was set approximately one year ago during what appears to have been a bottoming process before the 2025 parabolic rally. The range from $5.12 to $76.87 is extremely wide (15:1), making percentage-based metrics somewhat misleading. The stock's recent trading range (last 6 months: $33-$77) is more relevant for current positioning.
Volatility and position sizing: IREN's 97.5% annualized volatility and 6.16% daily standard deviation mean that standard equity position sizing rules do not apply. A 1-ATR stop ($3.50) represents 10% of position value. Any position must be sized for this reality.
No fundamental context: This is a pure technical analysis. IREN is a Bitcoin mining / AI data center company, making it highly correlated with BTC price and AI sector sentiment. A fundamental catalyst (BTC breakout, AI infrastructure spending, hash rate changes) could override all technical signals.
Oversold bounce statistics: The claim that Stochastic readings below 5 tend to produce bounces is based on general equity behavior. For a stock with IREN's volatility profile, the reliability of mean-reversion signals may be lower than for typical equities.
Short history at current scale: IREN only became a large-cap-relevant stock in 2025. Most of its trading history is as a micro/small-cap with very different liquidity characteristics. The technical patterns observed during the 2024-2025 period may not be representative of future behavior.
Appendix A: Models & Configuration
Data Source
| Parameter | Value |
|---|---|
| Ticker | IREN |
| Source File | data-samples/ohlcv/tv-export/IREN.csv |
| Source | TradingView export |
| Date Range | 2021-11-17 to 2026-03-27 |
| Bar Count | 1,093 daily bars |
| Missing Values | None |
Indicator Configuration
| Indicator | Parameters | Library/Source |
|---|---|---|
| SMA | 20, 50, 200 periods | Custom (pandas rolling) |
| EMA | 12, 21, 50 periods | Custom (pandas ewm) |
| RSI | 14-period, Wilder smoothing | Custom (pandas ewm, alpha=1/14) |
| MACD | Fast=12, Slow=26, Signal=9 | Custom (pandas ewm) |
| Stochastic | K=14, D=3 | Custom (pandas rolling) |
| ATR | 14-period, Wilder smoothing | Custom (pandas ewm, alpha=1/14) |
| Bollinger Bands | 20-period, 2 std dev | Custom (pandas rolling) |
| OBV | Cumulative signed volume | Custom (numpy sign) |
| A/D Line | Money Flow Multiplier * Volume | Custom (pandas) |
| ATR Ratio | ATR(14) / SMA(ATR, 50) | Custom |
| Fibonacci Retracement | 52-week high/low | Custom |
| Swing Detection | 10-bar lookback | Custom (rolling max/min) |
| Historical Volatility | 20-day annualized (sqrt 252) | Custom (pandas rolling std) |
Scoring Configuration
| Component | Weight | Score Range |
|---|---|---|
| Trend Alignment | 25% | 0-10 |
| Momentum | 20% | 0-10 |
| Volume Confirmation | 20% | 0-10 |
| Volatility Profile | 15% | 0-10 |
| Market Structure | 20% | 0-10 |
Overall score = weighted average of component scores. Bias determined by score: 0-3.5 = Bearish, 3.5-6.5 = Neutral, 6.5-10 = Bullish.
Script
Analysis script: analysis/quant-research/scripts/IREN-technical-2026-03-28.py
Charts