IREN
Conviction 3IREN -- Combined Deep Dive Assessment
Date: 2026-03-28 Asset Class: Equity Ticker: IREN (Iris Energy Limited)
Fundamental Summary
| Metric | Value |
|---|---|
| Overall Score | 55.5/100 |
| Verdict | AVOID |
| Red Flags | 4 HIGH (1 Hidden/Undisclosed), 2 MEDIUM |
The Market Analyst scored IREN at 55.5/100 with an AVOID verdict. The score falls in the CAUTION range (40-59), but the presence of a Hidden/Undisclosed HIGH flag escalates the verdict to AVOID. The business is in the middle of a high-stakes transformation: 91% of revenue is still Bitcoin mining, with AI Cloud at just 9.4% ($17.3M quarterly). The $9.7B Microsoft contract for 140,000 GB300 GPUs at Childress, TX is the bull case -- but it is unproven, with first GPU deployment targeted for mid-2026.
Critical red flags: - Hidden/Undisclosed HIGH: $500M AI Cloud ARR guidance was NOT reaffirmed in the March 2026 $6B ATM prospectus. Jim Chanos publicly flagged this omission as evidence the near-term target will be missed. This is not widely understood by retail investors. - $6B ATM = 51% potential dilution at $35. Co-CEOs each sold 1M shares at $33.13 in Sept 2025 ($66M combined). Share count already grew 6.3x since FY2022. - Negative GAAP EPS through FY2026. FCF -$1.25B TTM. 3 of 4 recent EPS misses. - EV/Revenue 16.2x vs mining peer median 3-5x and CoreWeave at 9x.
Peer context: IREN is the clear AI transition leader among Bitcoin miners (no peer has a signed hyperscaler deal), but against CoreWeave, IREN is 15% of the revenue scale with a single-customer backlog vs CRWV's $66B diversified pipeline. The 68/100 peer strength score reflects best-in-class among miners, mid-field among AI infrastructure.
Technical Summary
| Metric | Value |
|---|---|
| Overall Score | 2.9/10 |
| Bias | Bearish |
| Red Flags | 2 HIGH, 1 MEDIUM |
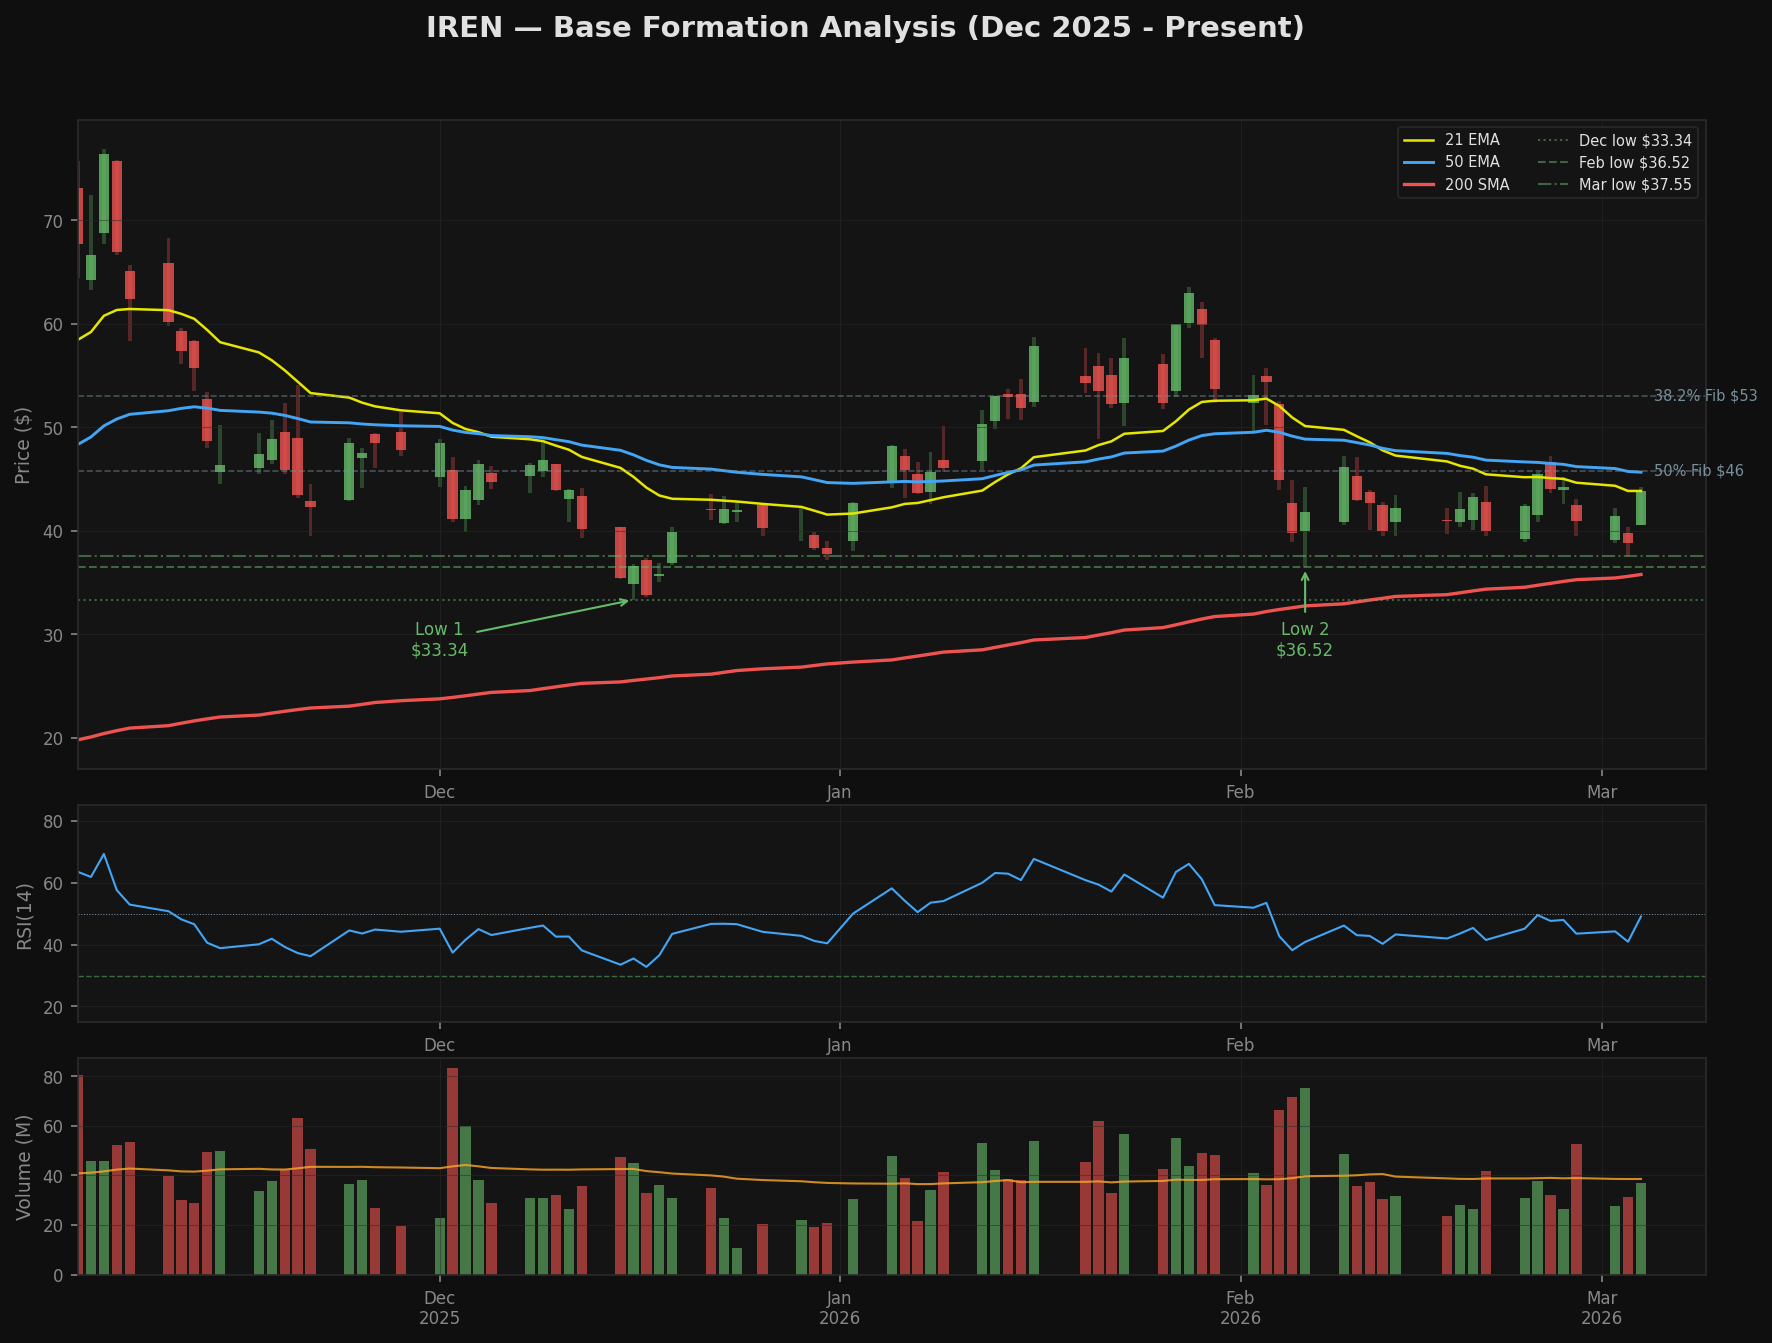
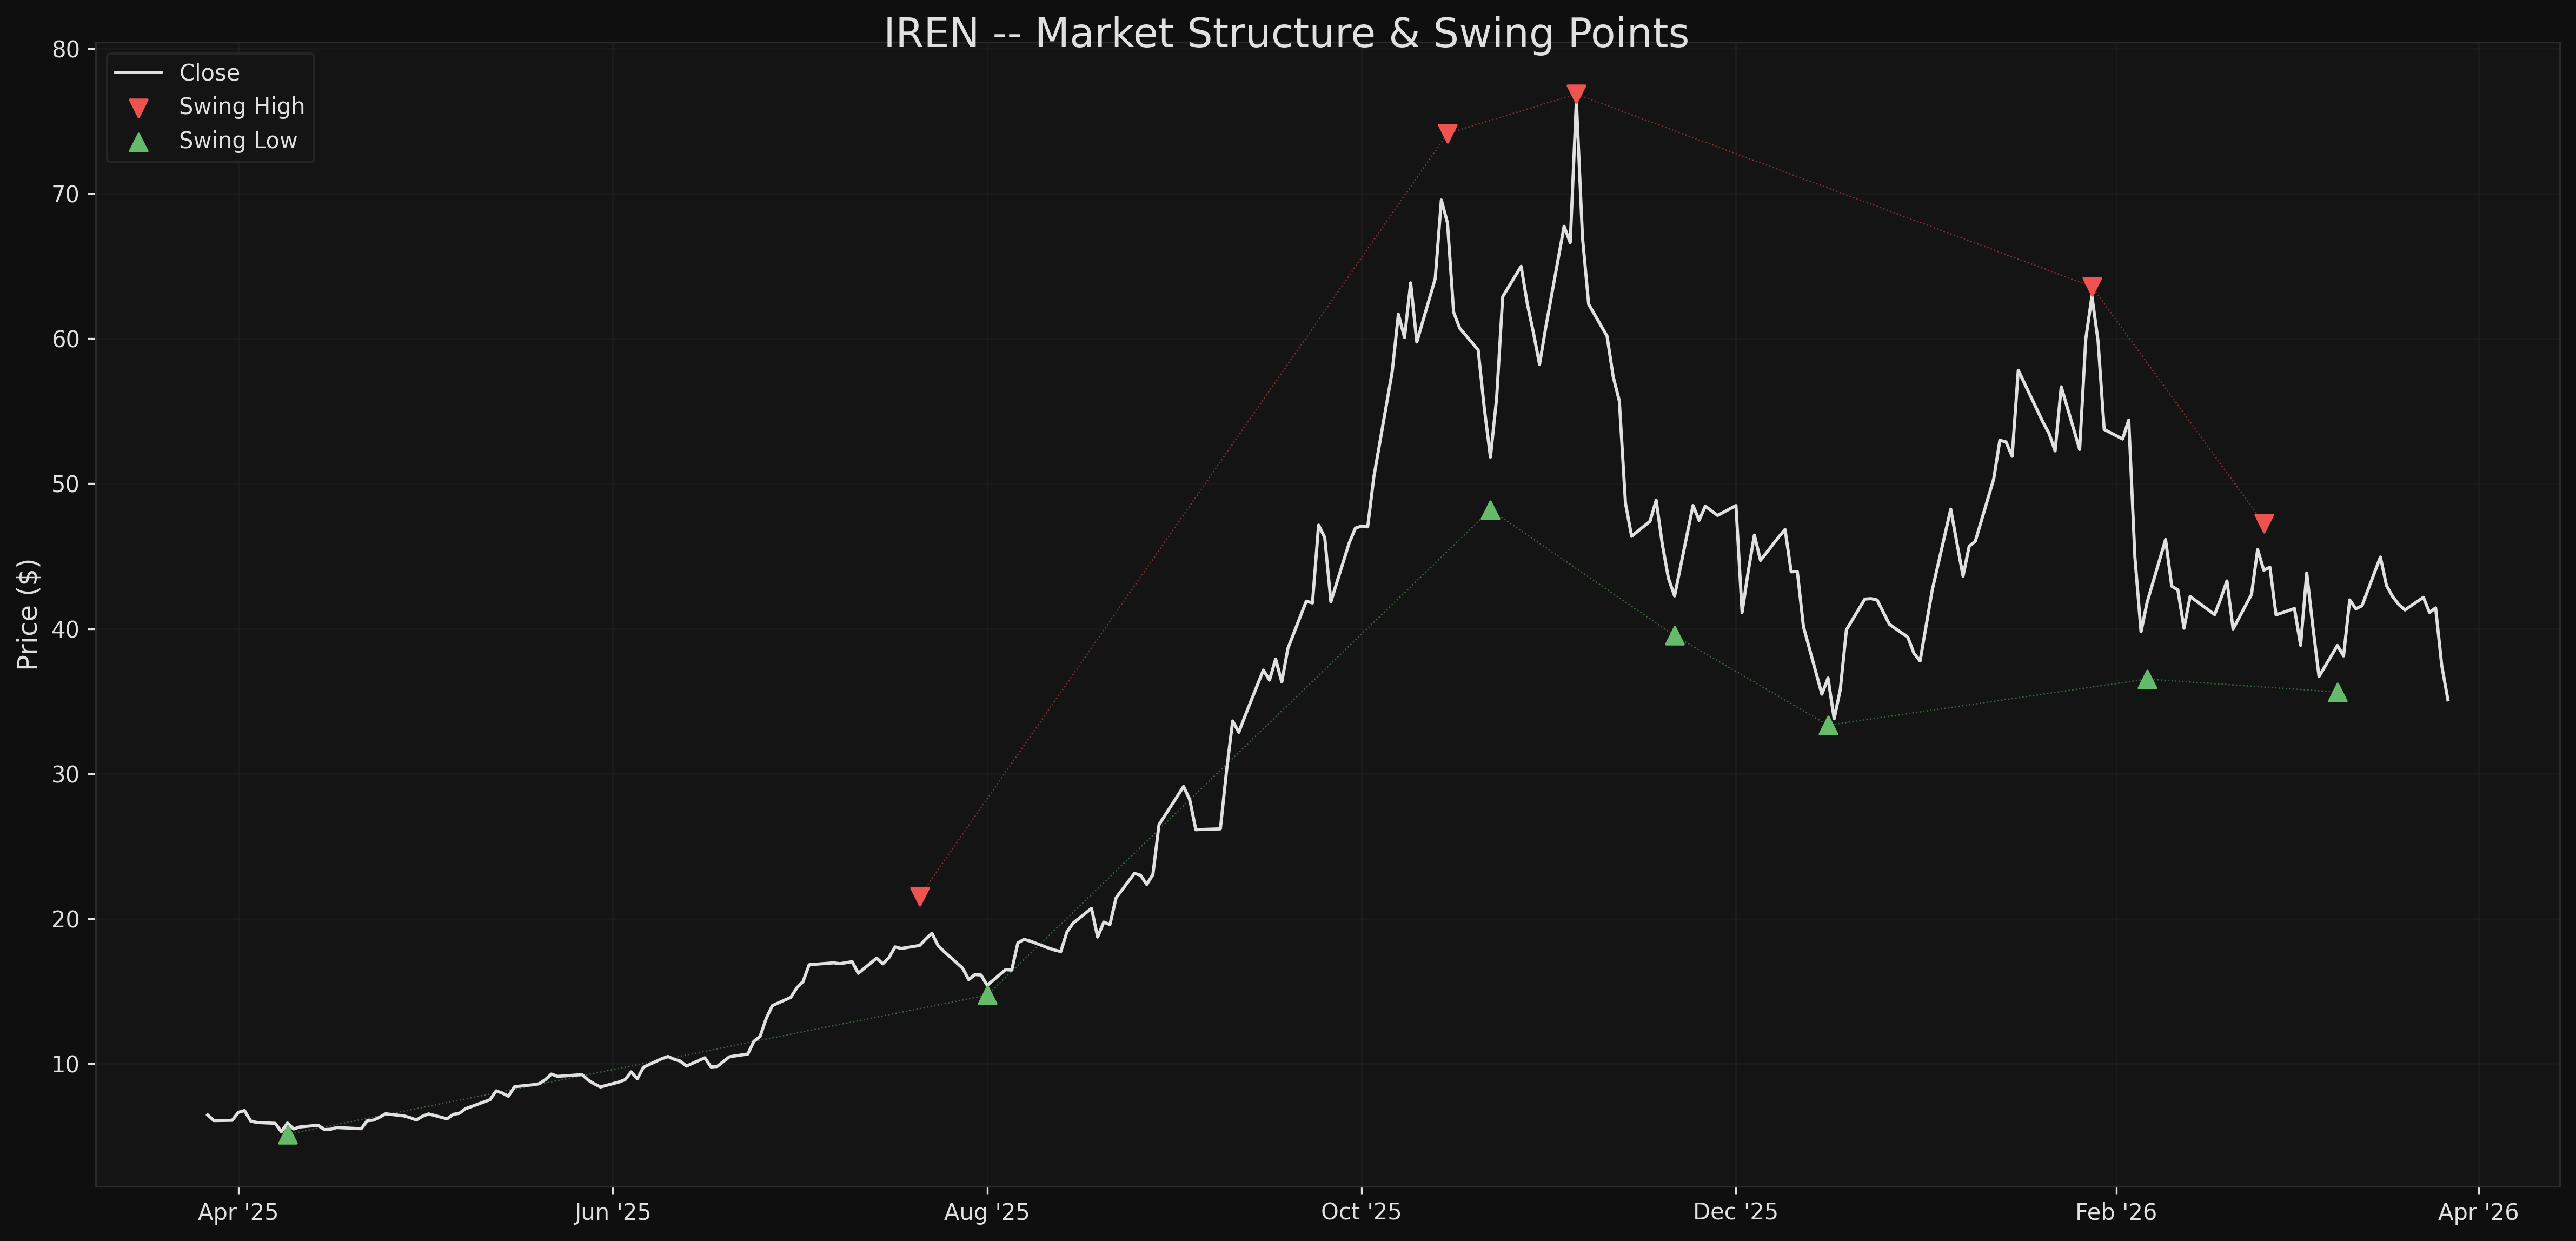
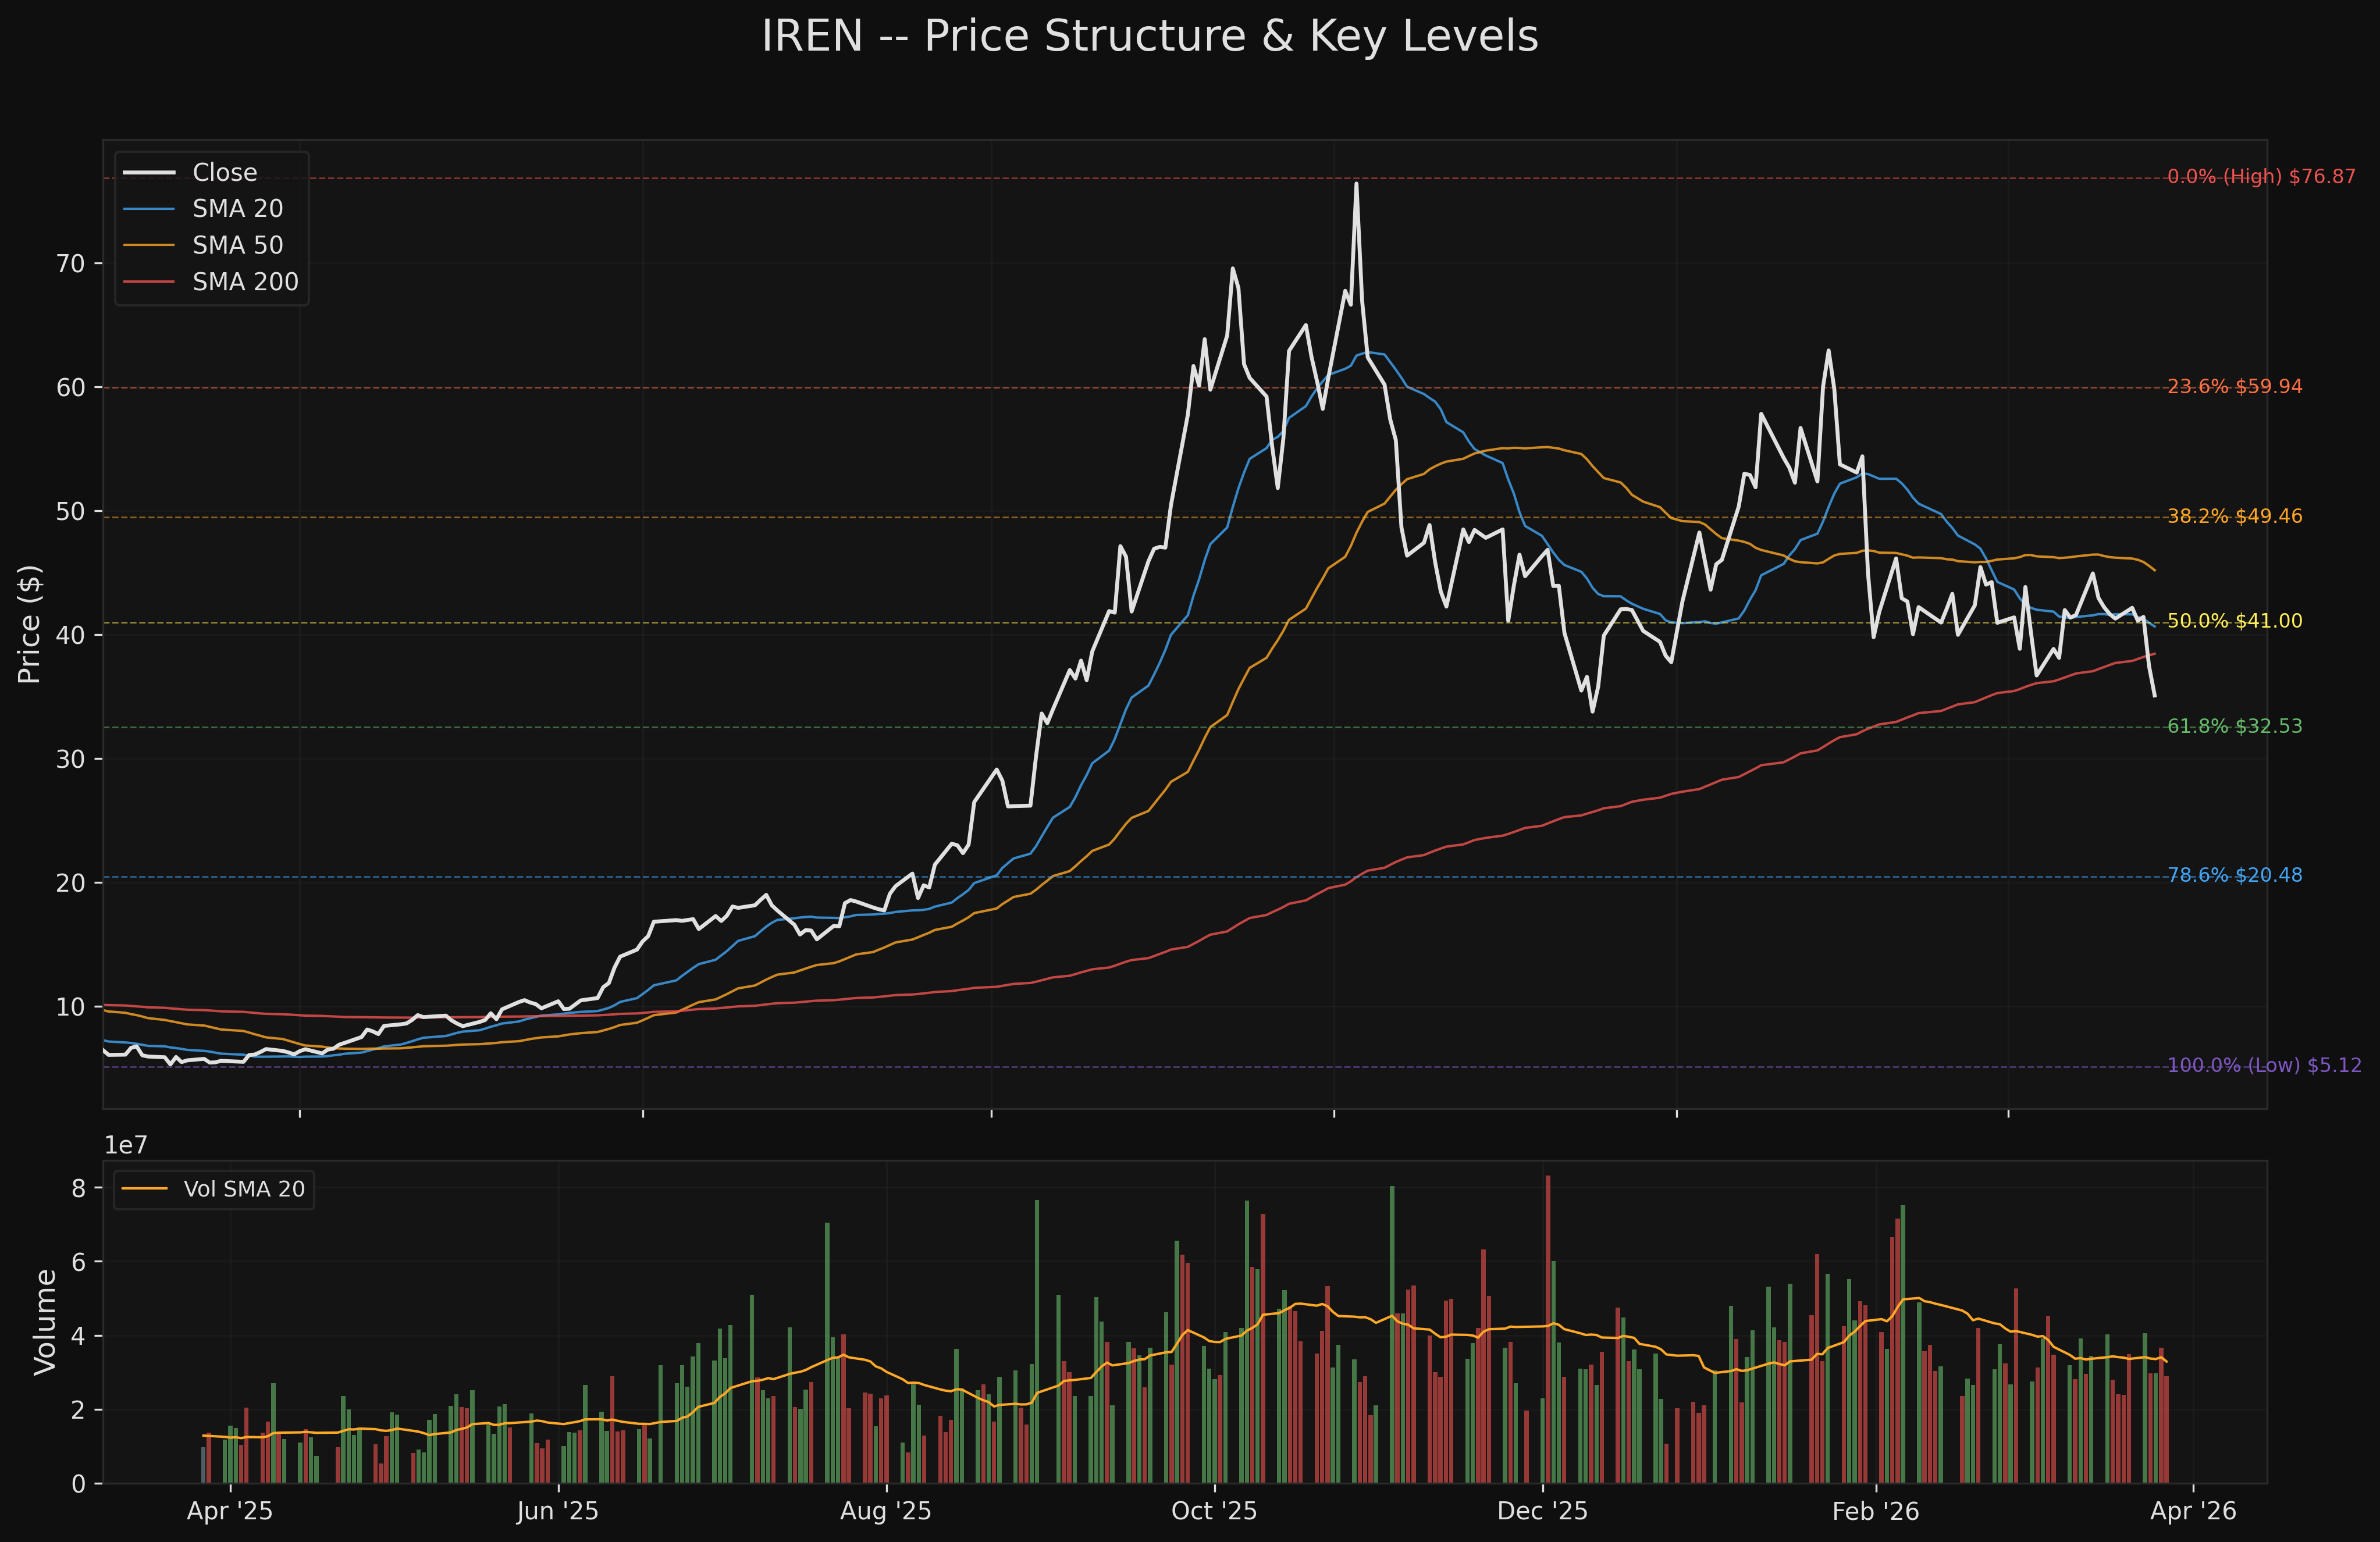
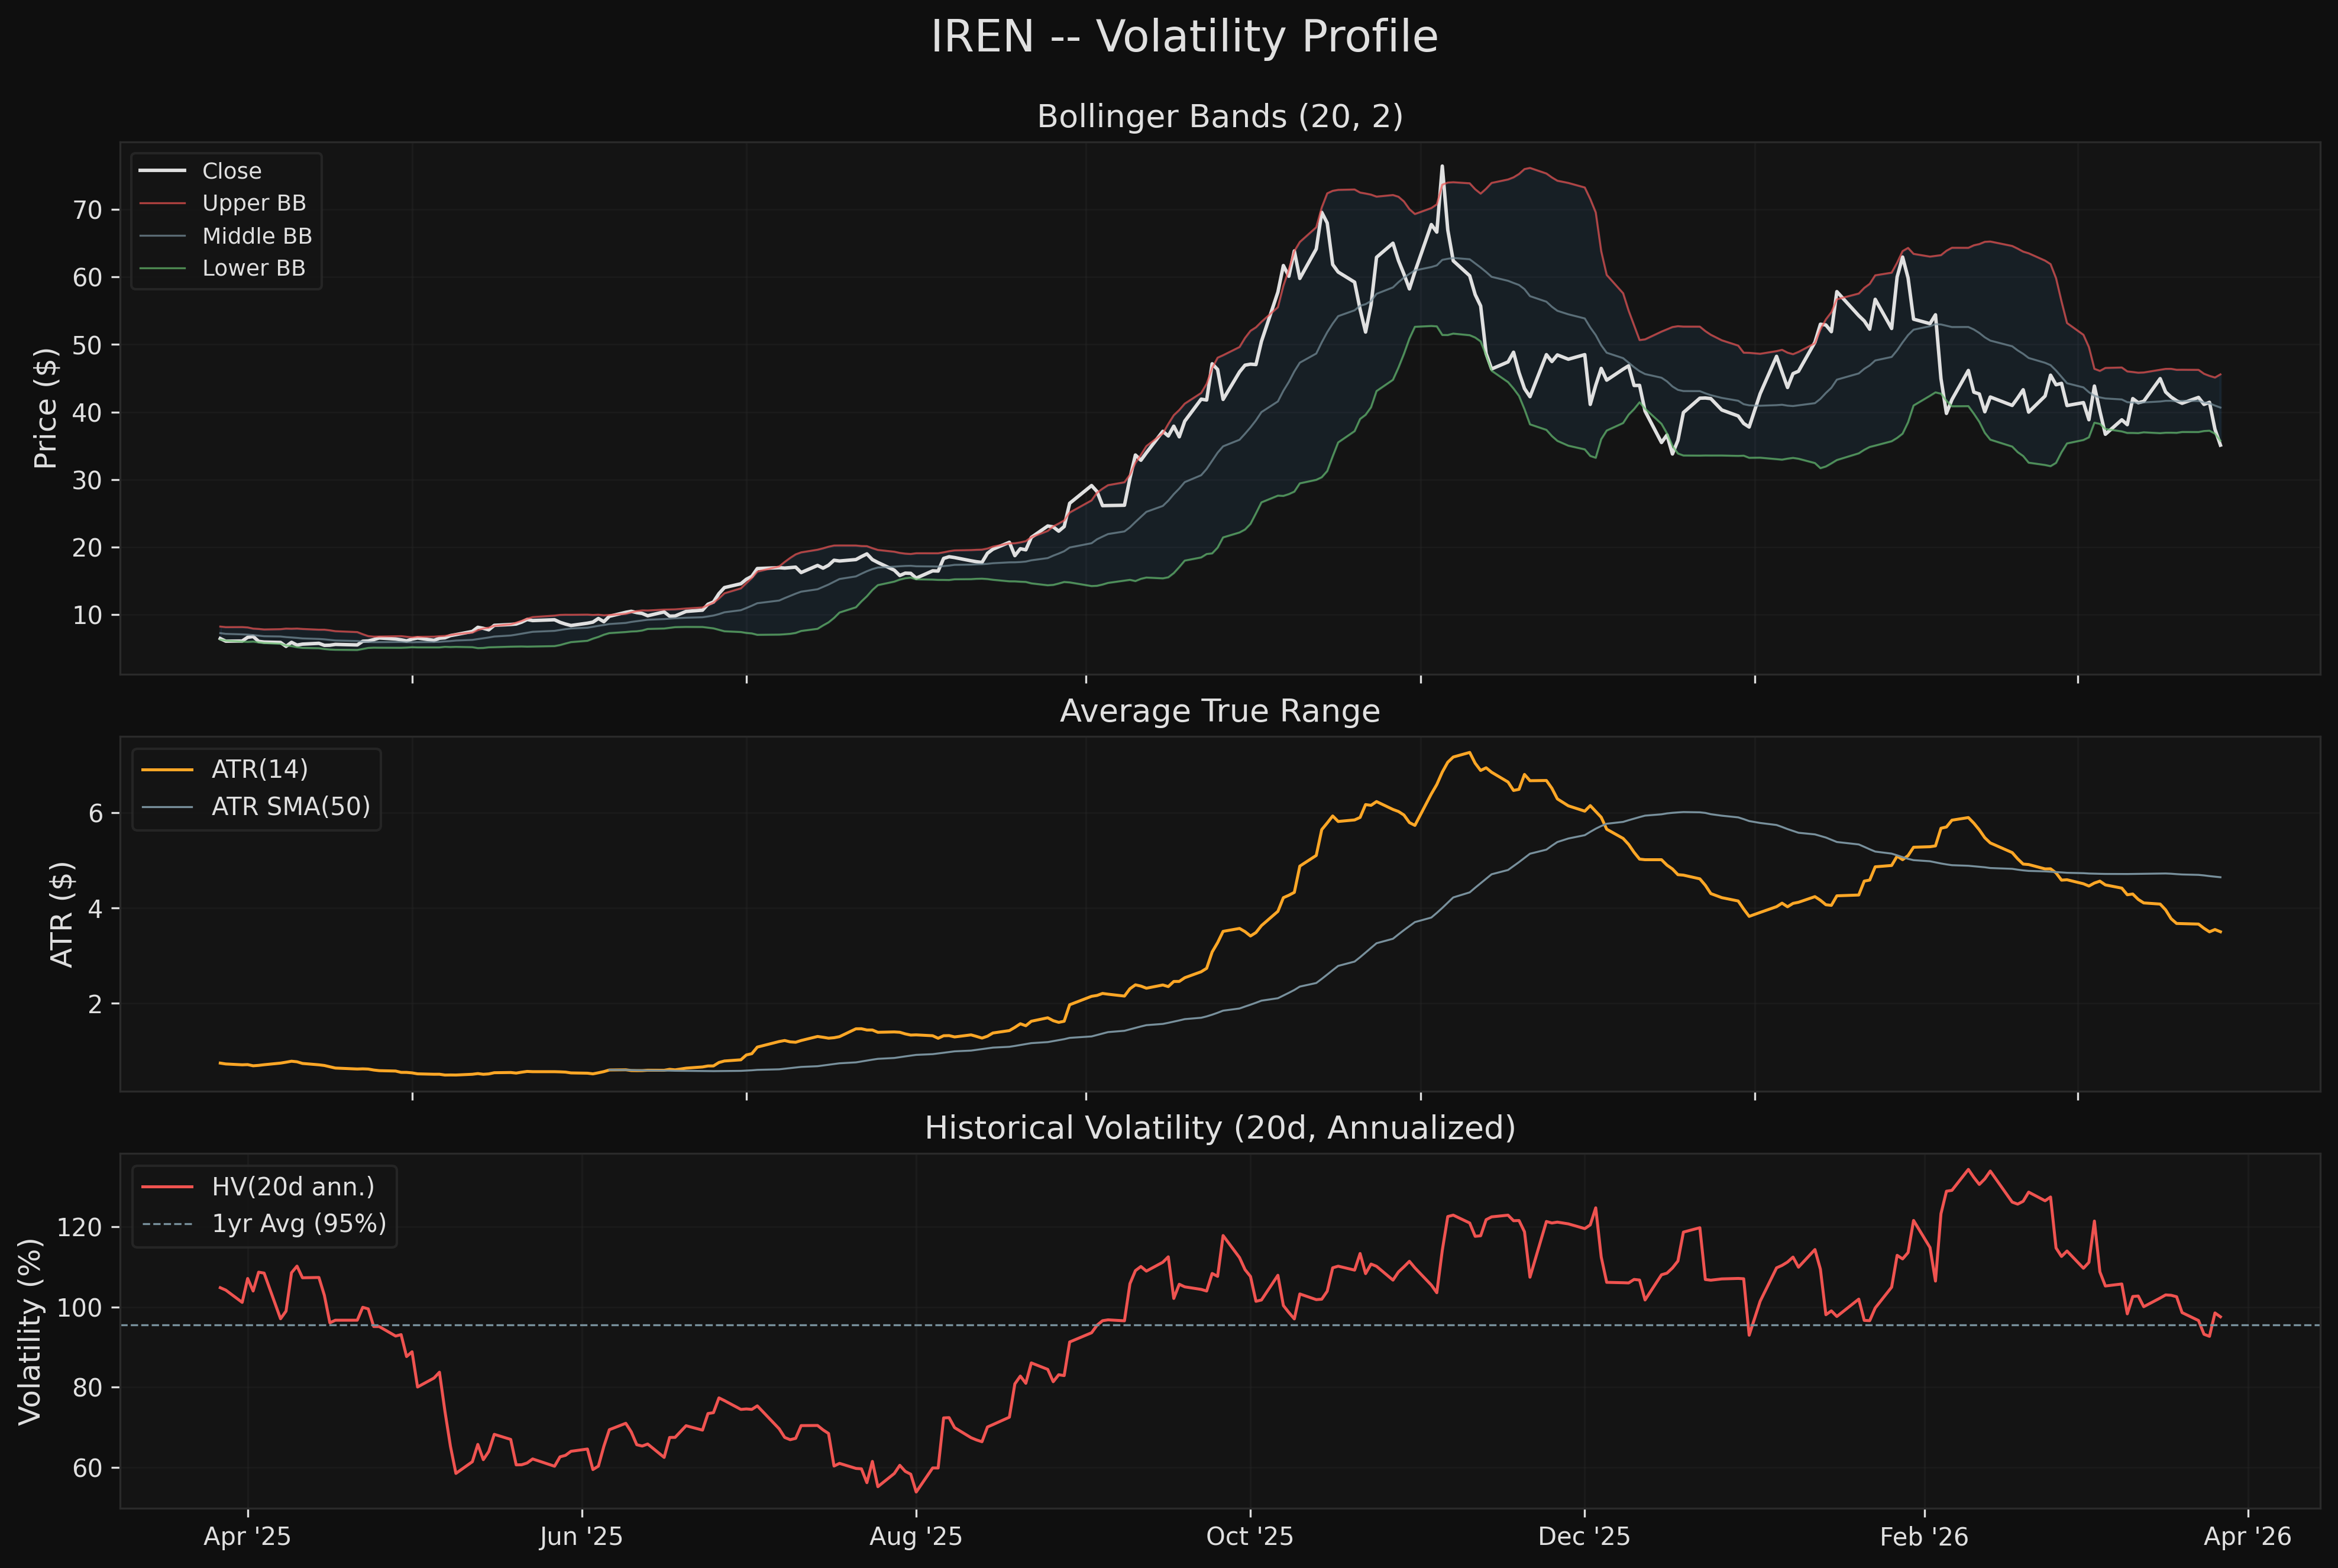
The Quant Researcher scored IREN at 2.9/10 with a Bearish bias. The stock is -54.4% from its November 2025 high of $76.87, in a confirmed markdown phase with lower highs ($76.87 -> $63.59 -> $47.25) and lower lows ($39.52 -> $33.34 -> $35.63). Price sits below ALL major moving averages -- SMA 20 ($40.66), SMA 50 ($45.19), SMA 200 ($38.45), and all EMAs. The EMA stack is fully bearish (Price < EMA 12 < EMA 21 < EMA 50).
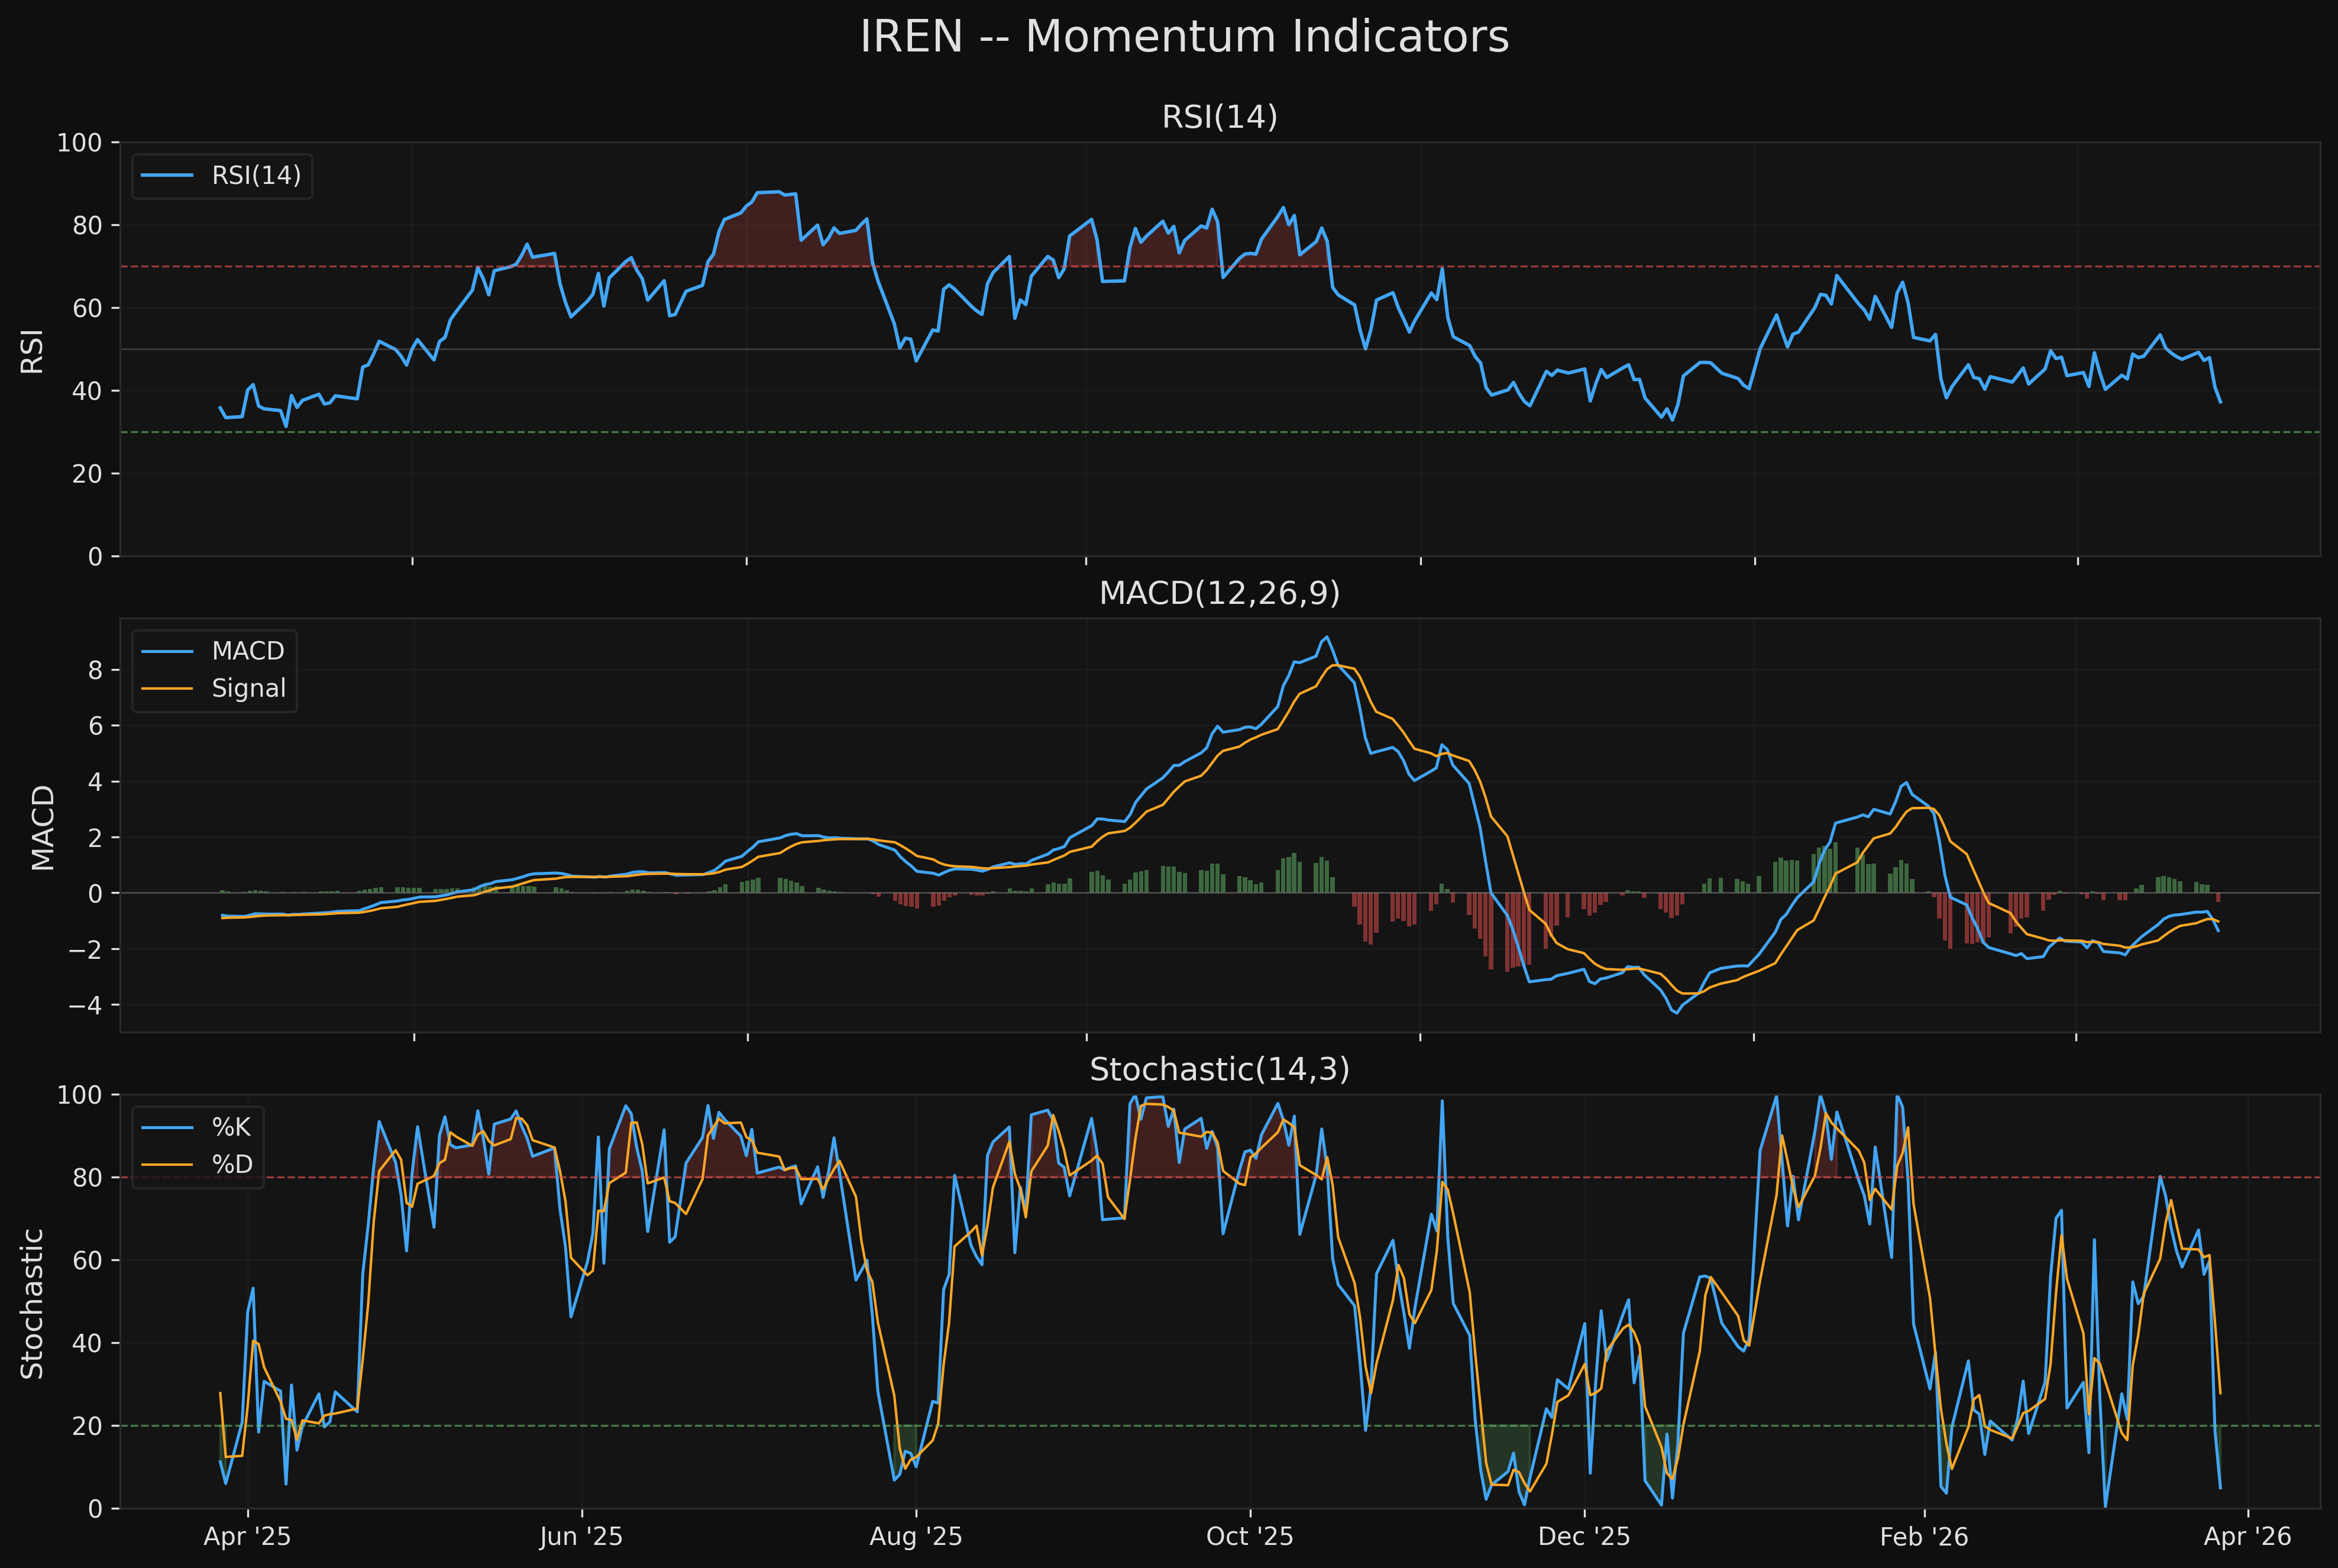
Oversold conditions: Stochastic at 4.9 is deeply oversold; BB %B at -0.067 (below lower band); RSI at 37.2 approaching oversold. These readings historically produce short-term bounces but do not indicate trend reversal.
Squeeze active: ATR ratio 0.754 (below 0.90 threshold) signals compressed volatility. When this breaks, the directional move will be significant -- but given the downtrend context, the path of least resistance is lower.
AGREEMENT Assessment
Fundamental-Technical Alignment: ALIGNED-BEAR
Both analyses independently arrive at the same conclusion: IREN is not a buy at current levels.
-
Direction -- ALIGNED. Fundamentals say AVOID (Hidden/Undisclosed HIGH flag, no margin of safety on current financials). Technicals say Bearish (2.9/10, structural downtrend, below all MAs). There is zero disagreement on the current risk posture.
-
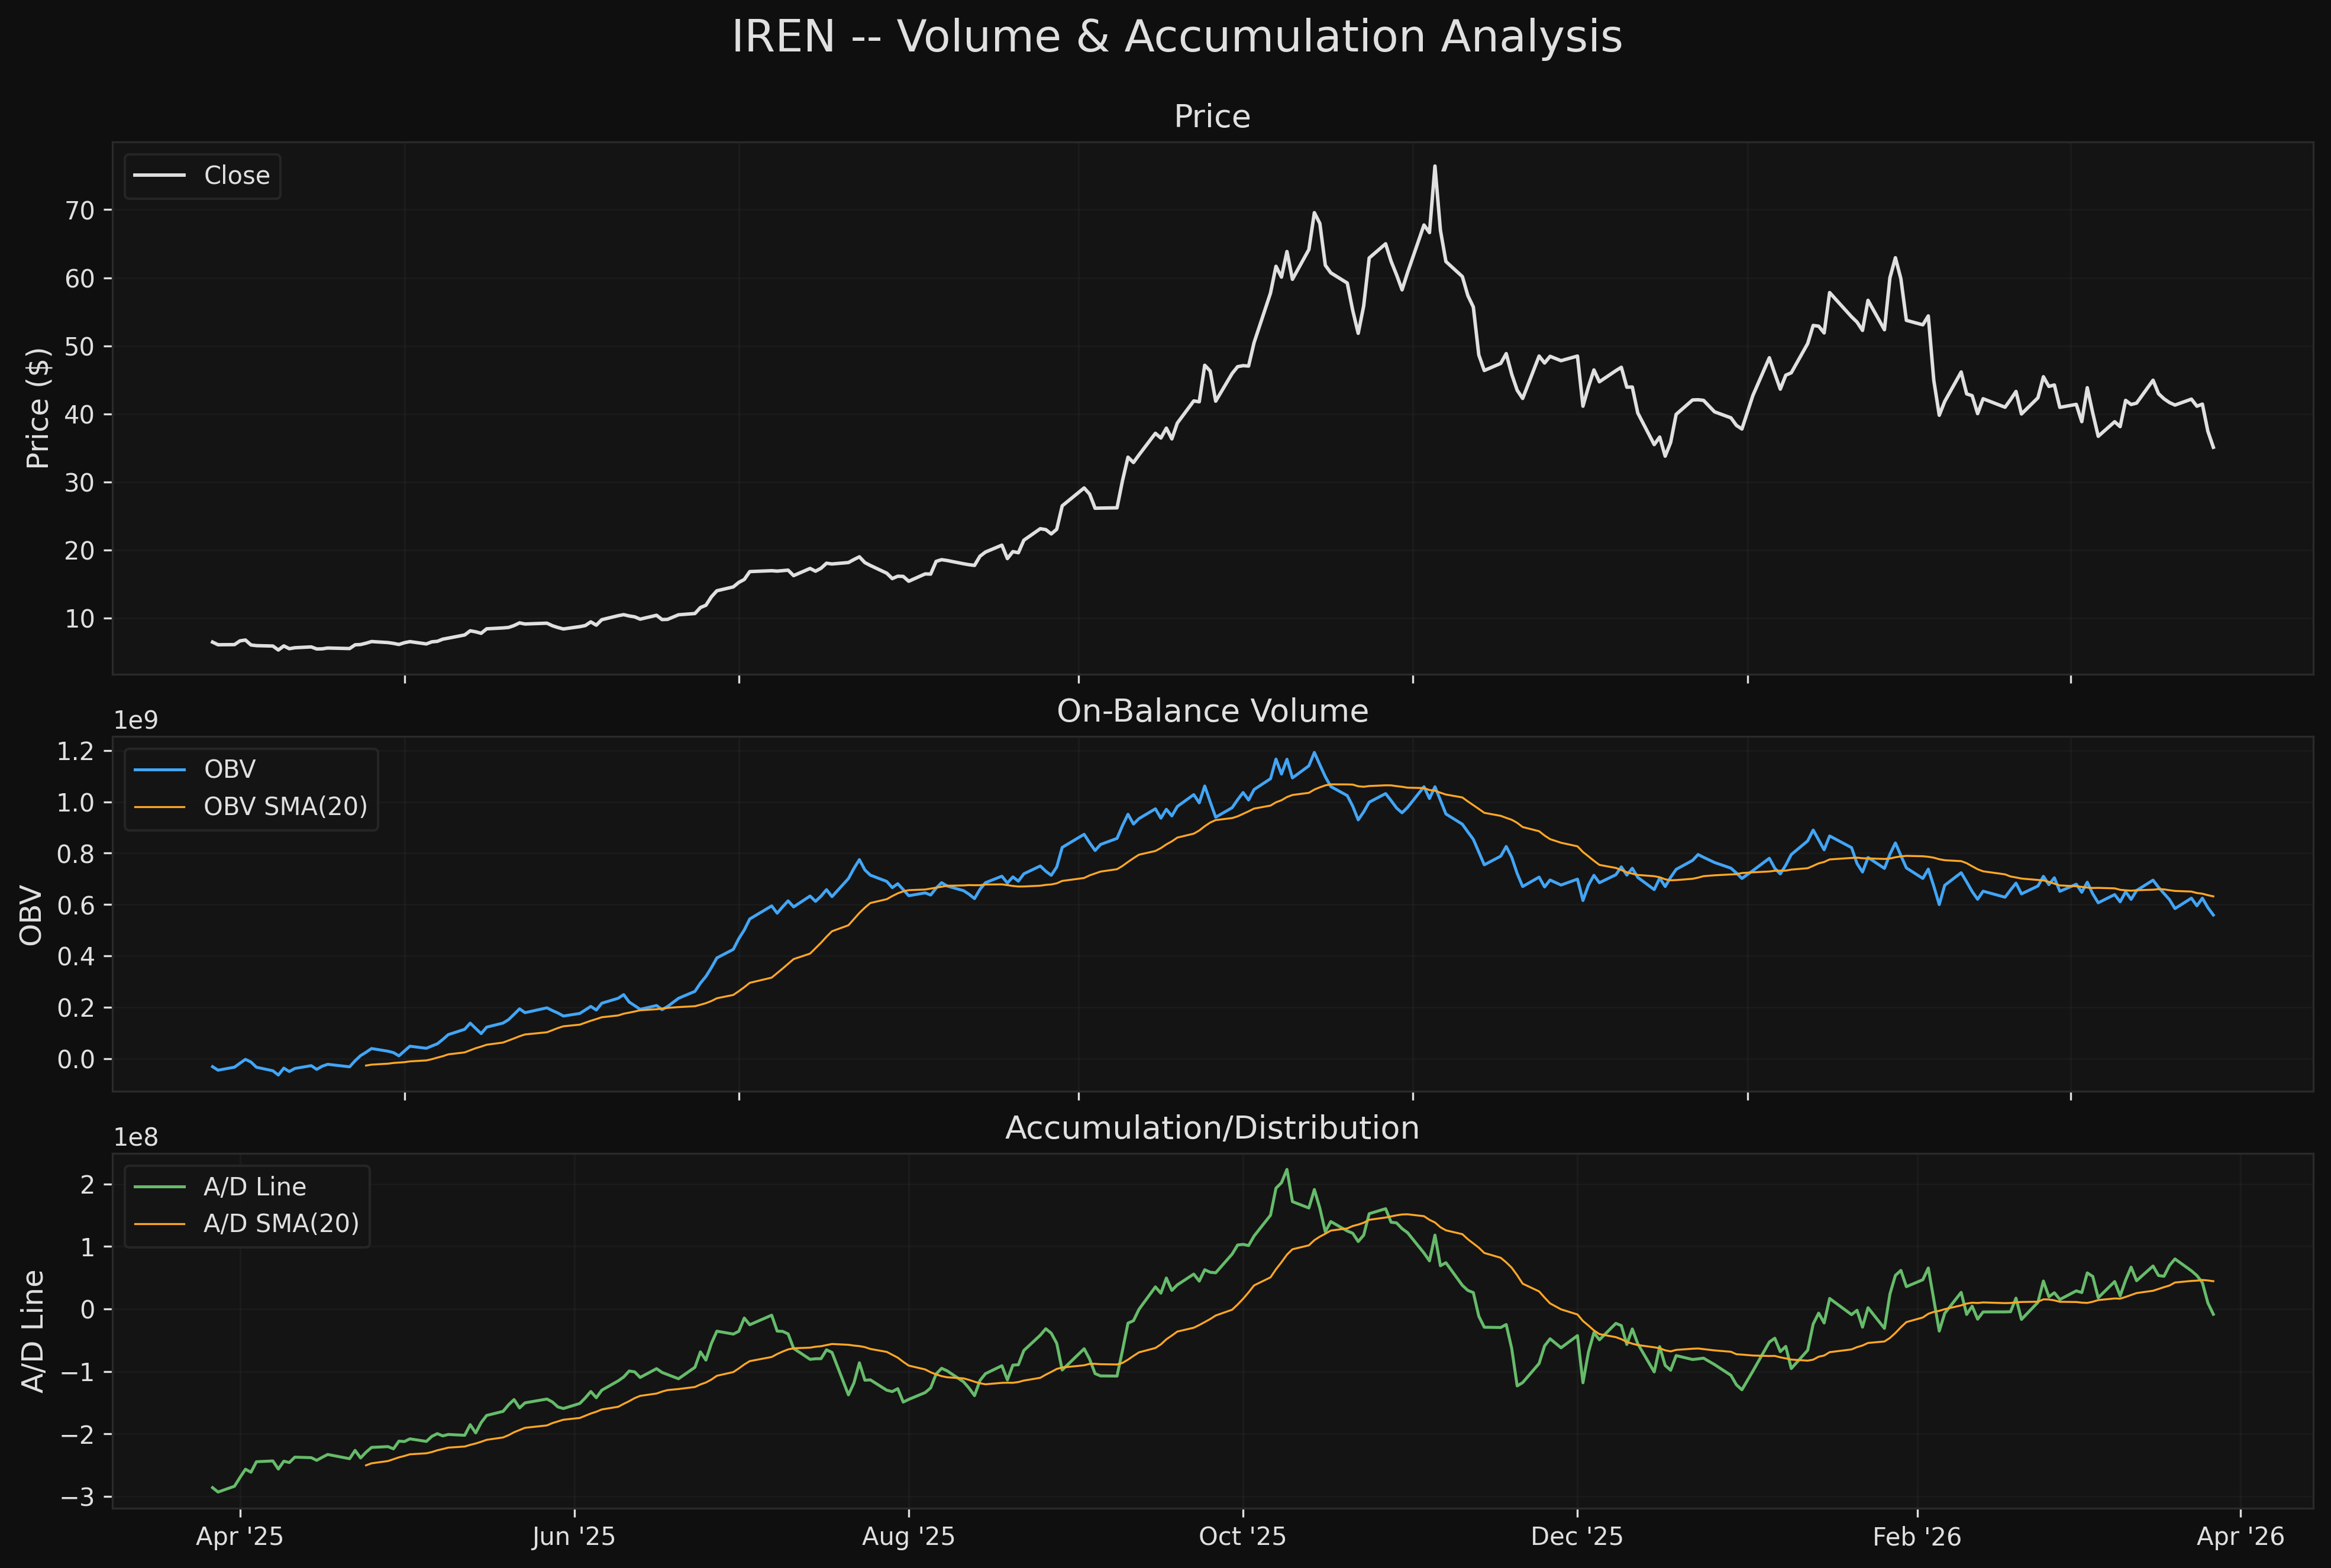
Earnings quality -- ALIGNED. Fundamentals quantify the problem: 91% mining revenue, negative GAAP EPS, -$1.25B FCF. Technicals confirm via distribution patterns: OBV dropped 119.8M in 20 sessions, A/D line falling, no accumulation evidence. The market is voting with its feet.
-
Dilution risk -- REINFORCED. The fundamental analysis identifies the $6B ATM as a structural supply overhang. The technical analysis independently shows why: every rally attempt gets sold, lower highs are contracting, and the ATM creates a ceiling on any short-term bounce as management opportunistically issues shares.
-
The bull case -- ALIGNED ON CONDITIONALITY. Both agree the Microsoft contract COULD be transformational. Fundamentals show that on the $3.4B ARR target, forward EV/ARR compresses to 3.6x (cheaper than CoreWeave). Technicals show that a V-shaped recovery to SMA 50 ($45.19) offers 5.8:1 R:R if triggered. But both agree this is a low-probability scenario (15% per technicals) that requires hard evidence -- specifically, on-time Childress energization and Q3 FY26 AI Cloud revenue above $75M.
Where they agree most: This is a falling knife with no reversal evidence, a Hidden/Undisclosed red flag that the market hasn't fully priced, and a structural supply overhang from the ATM. The transformation story is real but unproven.
No meaningful disagreements. This is the cleanest fundamental-technical alignment in the deep dive -- both say avoid, both identify the same risks, both agree on what would change the thesis.
Key Levels
| Level | Price | Source |
|---|---|---|
| Resistance 3 (SMA 50) | $45.19 | Technical: prior support, now resistance |
| Resistance 2 (50% Fib) | $41.00 | Technical: lost this week |
| Resistance 1 (SMA 200) | $38.45 | Technical: first overhead MA |
| Current Price | $35.09 | -- |
| Support 1 (Dec Swing Low) | $33.34 | Technical: last tested structural support |
| Support 2 (61.8% Fib) | $32.53 | Technical: confluence with Support 1 |
| Support 3 (Round Number) | $29.00 | Technical: untested psychological level |
Risk/Reward Framework
Scenario 1: Mean-Reversion Bounce (Base Case -- 45%)
- Entry: $33.00-$33.50 (61.8% Fib / Dec swing low confluence)
- Stop: $29.00 (round number support)
- Target: $38.45 (SMA 200)
- R:R: 1.4:1
- Note: This is a TRADE, not a position. Oversold bounces are mean-reversion plays that require immediate profit-taking.
Scenario 2: Trend Continuation (Bear Case -- 40%)
- Trigger: Break below $33.34 on expanding volume
- Next support: $29.00, then $20.48 (78.6% Fib)
- Implication: The 2025 rally unwinds further; fundamental thesis is cracking
Scenario 3: V-Shaped Recovery (Bull Case -- 15%)
- Trigger: On-time Childress energization + Q3 AI Cloud > $75M
- Entry: Reclaim of SMA 20 ($40.66) and hold on retest
- Target: SMA 50 ($45.19), then $60+ if ARR guidance reaffirmed
- R:R: Excellent if triggered, but requires hard evidence first
Catalyst Timeline
| When | Event | Expected Impact | What to Watch |
|---|---|---|---|
| April 2026 | Childress TX power substation energization | +15-25% if on time | This converts the Microsoft contract from paper to deployed GPUs |
| ~May 13, 2026 | Q3 FY26 Earnings (unconfirmed date) | +/-15-25% | AI Cloud quarterly revenue; any $500M ARR guidance update |
| Ongoing | $6B ATM share issuance | Structural negative | Caps rallies; dilutes existing shareholders |
| Ongoing | Bitcoin price | +/-10-15% per $10K BTC move | 91% of current revenue is mining |
| Ongoing | Jim Chanos short campaign | Sentiment negative | Active public short with specific thesis on ARR miss |
Conviction Assessment
| Component | Value | Rationale |
|---|---|---|
| Fund-Tech Agreement | 1.0 | Fully aligned bearish -- both say avoid, same risks identified |
| Catalyst Density | 0.6 | Moderate -- Childress April, Q3 earnings May, but both are binary |
| Data Quality | 0.6 | Mid-cap with limited trading history at current scale; some coverage gaps |
| Risk/Reward Asymmetry | 0.3 | Poor for longs -- best R:R is 1.4:1 mean-reversion bounce; no attractive trend entry |
| Red Flag Severity | 0.1 | 1 HIGH Hidden/Undisclosed flag ($500M ARR omission) -- the most severe possible rating |
Conviction Score: 3 (Moderate) Weighted Score: 61.0/100 Position Sizing: Do not initiate -- AVOID verdict overrides sizing guidance
The moderate conviction score reflects high agreement (both bearish) offset by a devastating red flag profile. The Hidden/Undisclosed HIGH flag is the key differentiator -- this isn't a stock that's merely overvalued or in a downtrend, it's a stock where a material guidance omission may not be fully understood by the market.
Actionable Framework
Do not initiate a new long position. The AVOID verdict is driven by the combination of: (a) $500M ARR guidance silence in the ATM prospectus, (b) serial dilution via $6B ATM, (c) 91% mining revenue with negative GAAP EPS, (d) confirmed structural downtrend with no reversal evidence, and (e) 16.1% short interest with an active, public short campaign.
For existing holders: The deep dive does not recommend selling into the current oversold condition (Stochastic 4.9), as a short-term bounce to $38-41 is the base case. But any bounce should be used to reduce or exit the position unless the Childress April energization and Q3 earnings provide hard evidence of AI revenue inflection.
Reassess conditions (all must be met): 1. On-time Childress TX energization confirmed (April 2026) 2. Q3 FY26 AI Cloud quarterly revenue > $75M (implies $300M+ ARR pace) 3. $500M ARR guidance explicitly reaffirmed by management 4. Price reclaims SMA 20 ($40.66) and holds on retest
What the bull case requires: If IREN achieves $3.4B ARR by year-end, forward EV/ARR compresses to 3.6x -- cheaper than CoreWeave at 9x. That is genuinely compelling. But the path from $17.3M quarterly AI revenue to $850M quarterly AI revenue in 3 quarters is extraordinary, and the $500M ARR omission from the ATM filing raises the question of whether management itself believes the timeline is achievable.
Charts