IPX — Technical Summary
Conviction 3IPX -- Technical Deep Dive
- Date: 2026-03-11
- Researcher: Quant Researcher (Signals)
- Status: Complete
- Script:
analysis/quant-research/scripts/ipx-technical-setup-2026-03-11.py - Charts:
charts/ipx_technical_setup.png,charts/ipx_momentum_indicators.png,charts/ipx_rs_volume_profile.png,charts/ipx_volatility_analysis.png
1. Score Box
===========================================================
IPX -- Technical Analysis 2026-03-11
Asset Class: Equity
Price: $50.26 | 52wk: $19.33 - $61.45
AH Price: ~$44 (-12% post-earnings)
===========================================================
OVERALL SCORE: 7.0/10 BIAS: Bullish (with timing caveat)
COMPONENT SCORES
-----------------------------------------------------------
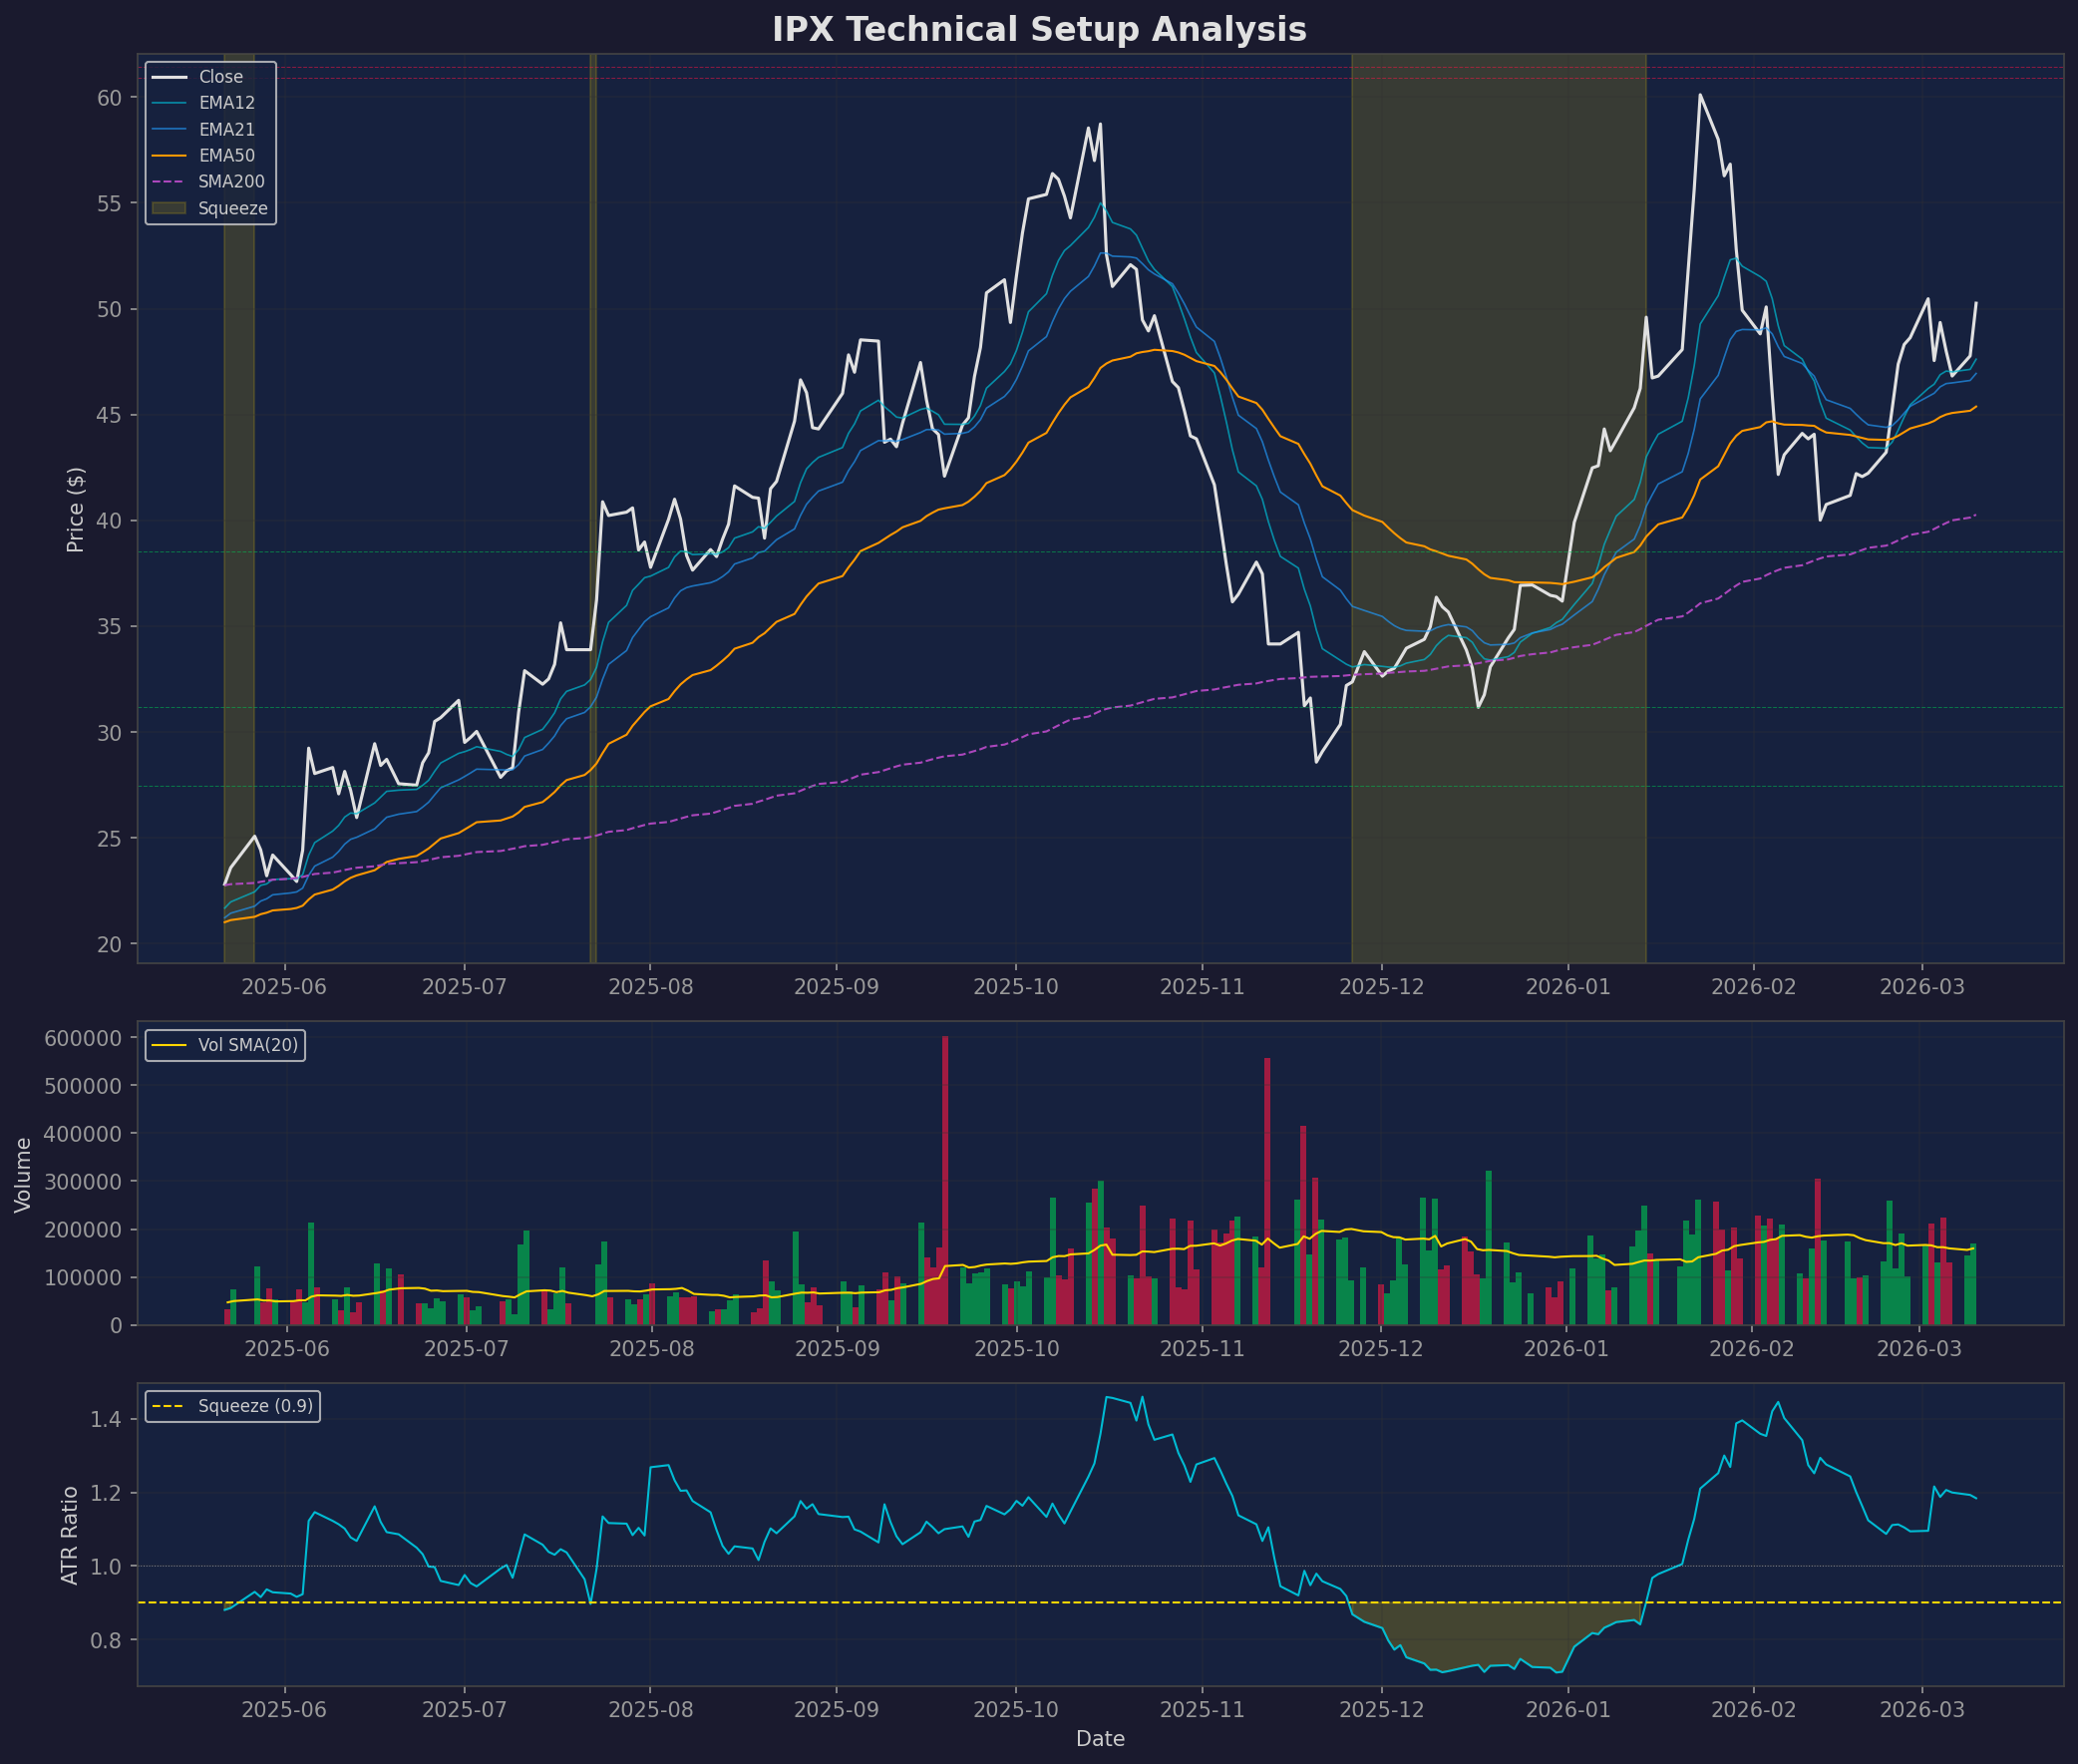
Trend Alignment 8.0/10 wt 25% EMA12>21>50, all rising, above SMA200
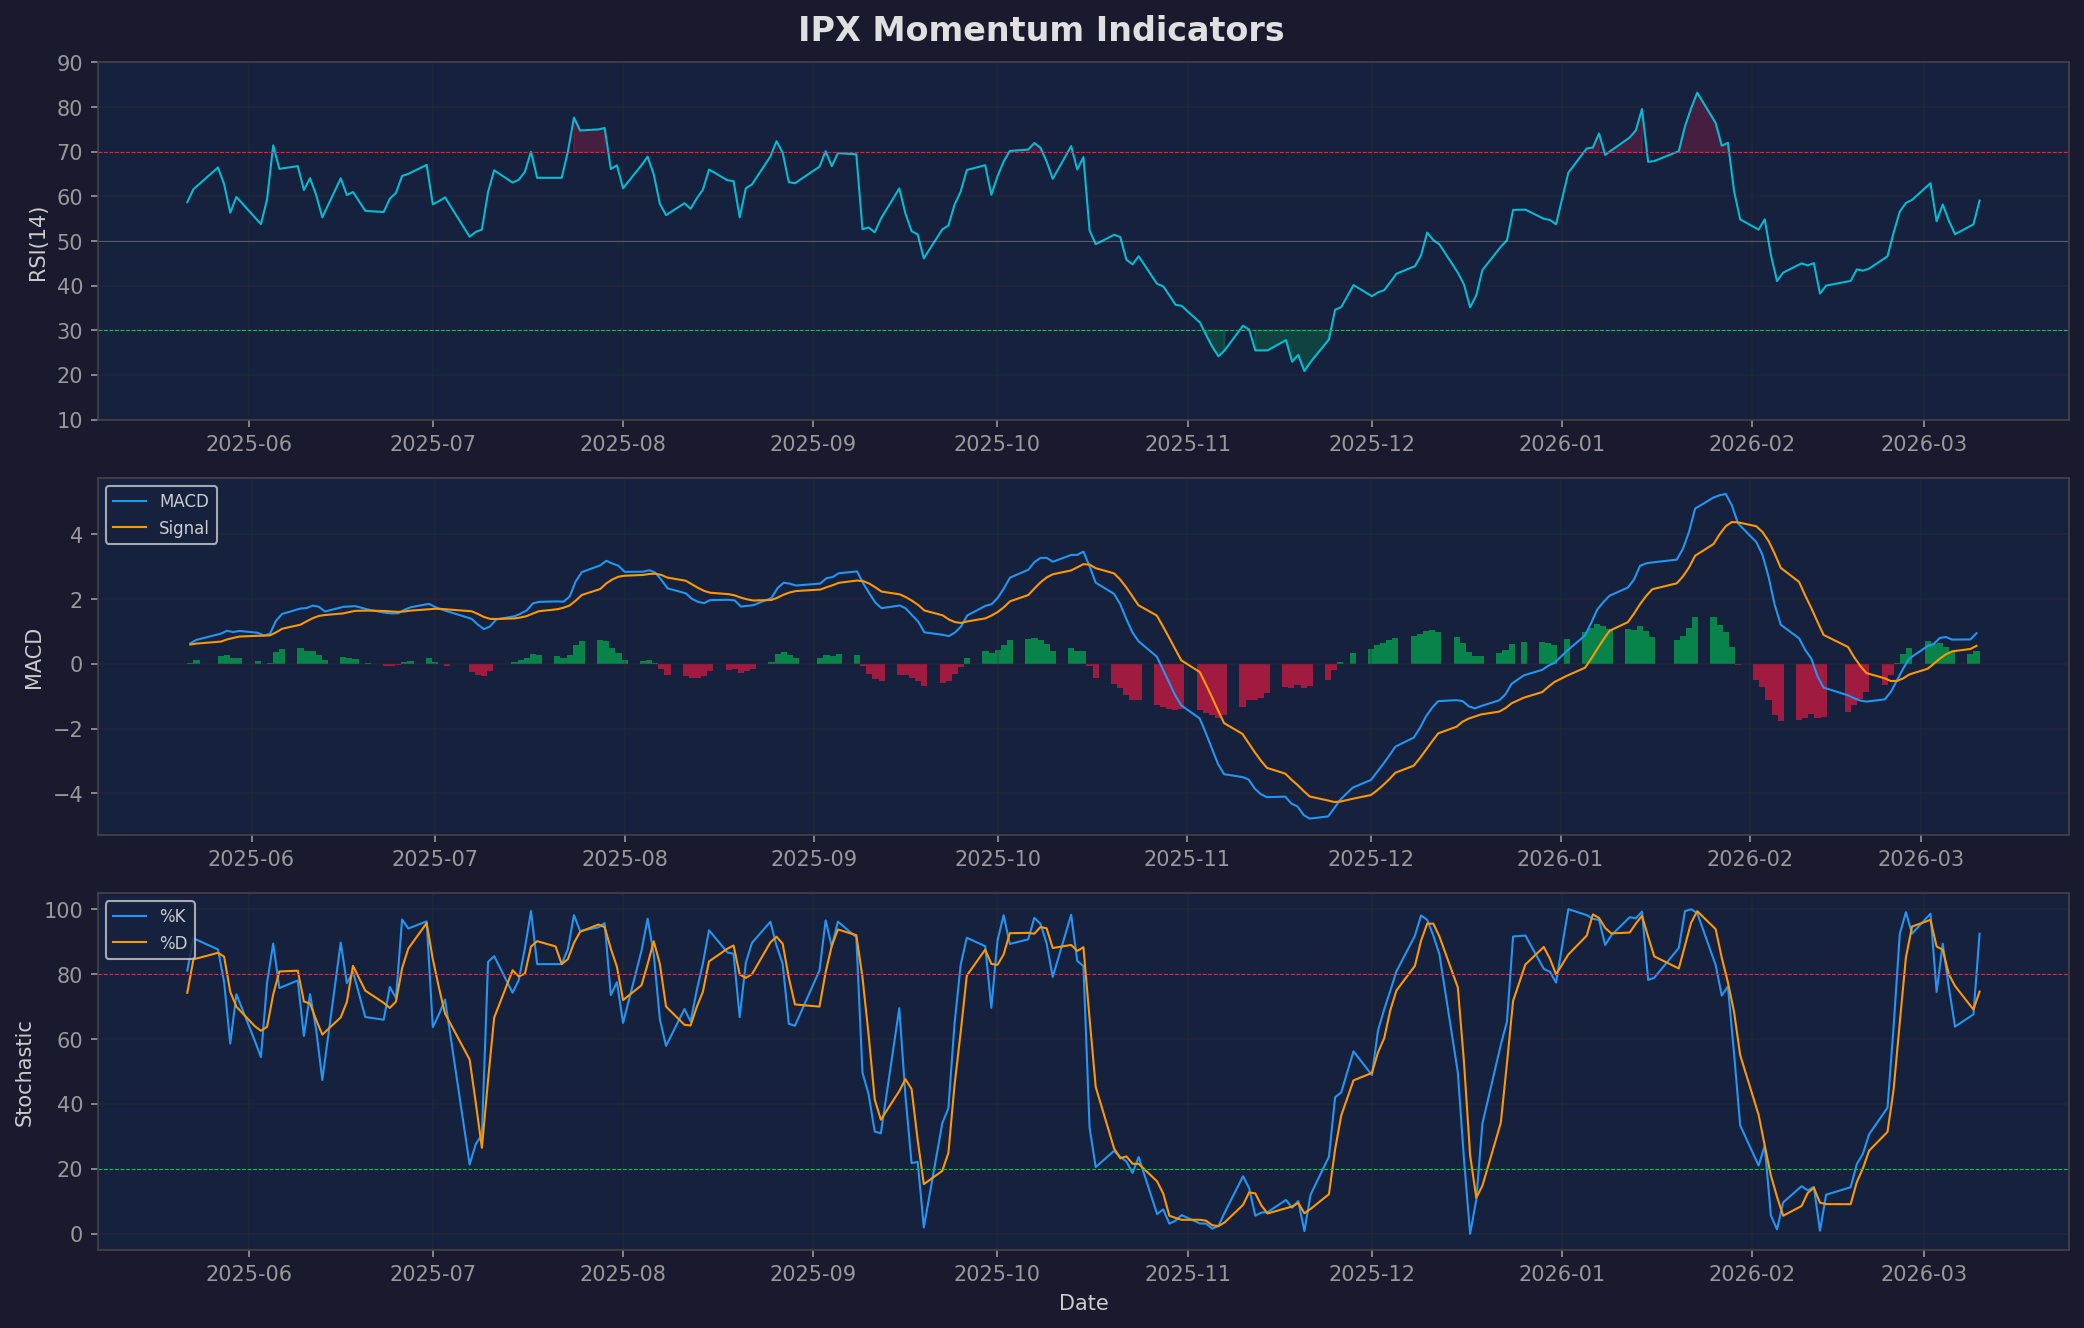
Momentum 6.5/10 wt 20% MACD bullish, RSI 59; Stoch overbought
Volume Confirmation 7.0/10 wt 20% OBV/AD rising; 2.4x vol expansion
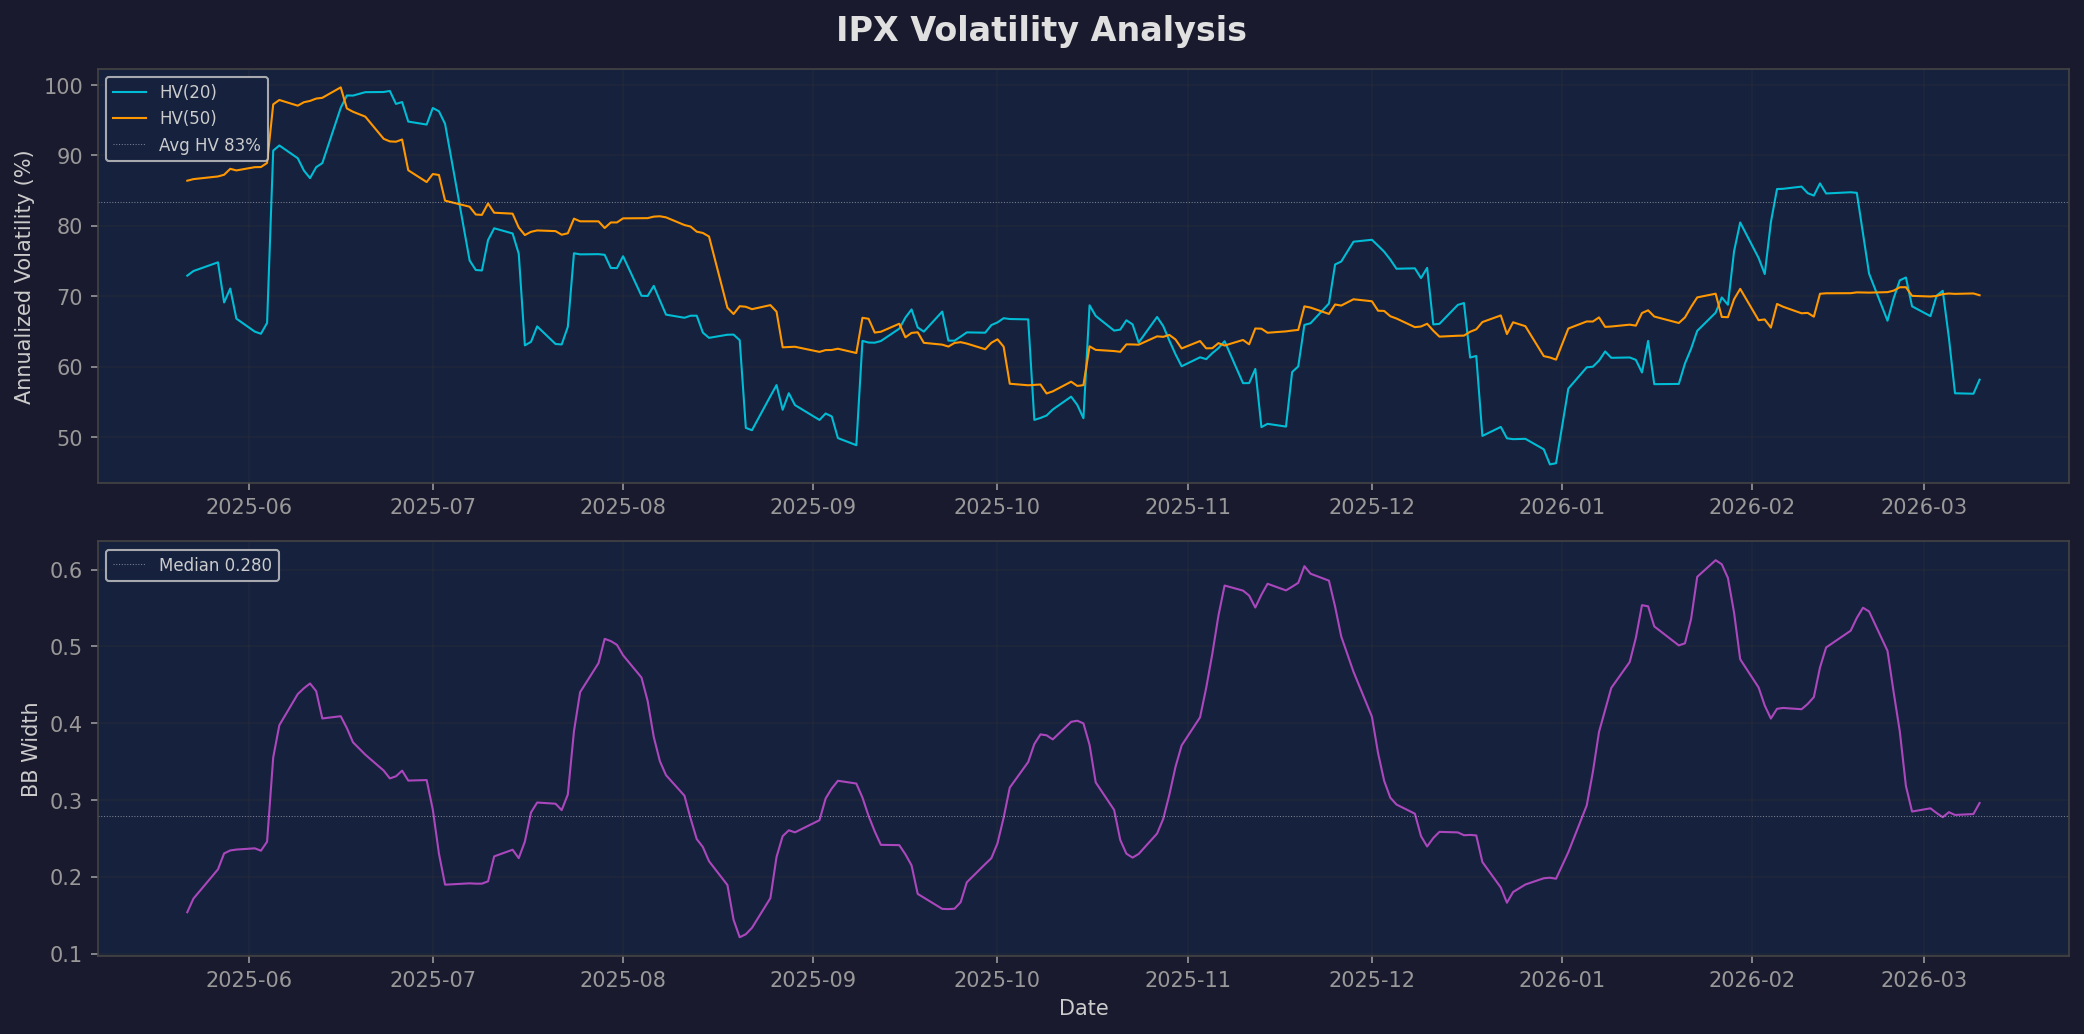
Volatility Profile 6.0/10 wt 15% HV20 at 70% of lifetime; ATR expanding
Market Structure 8.0/10 wt 20% Higher-low sequence confirmed
KEY LEVELS (pre-AH)
-----------------------------------------------------------
ATH / Resistance 2: $61.45 2026-01-26
38.2% Fib: $52.69 Next resistance
50% Fib / Current: $50.26 Decision zone
61.8% Fib: $47.28 First support
EMA21: $46.94 Trend support
EMA50: $45.38 Key trend level
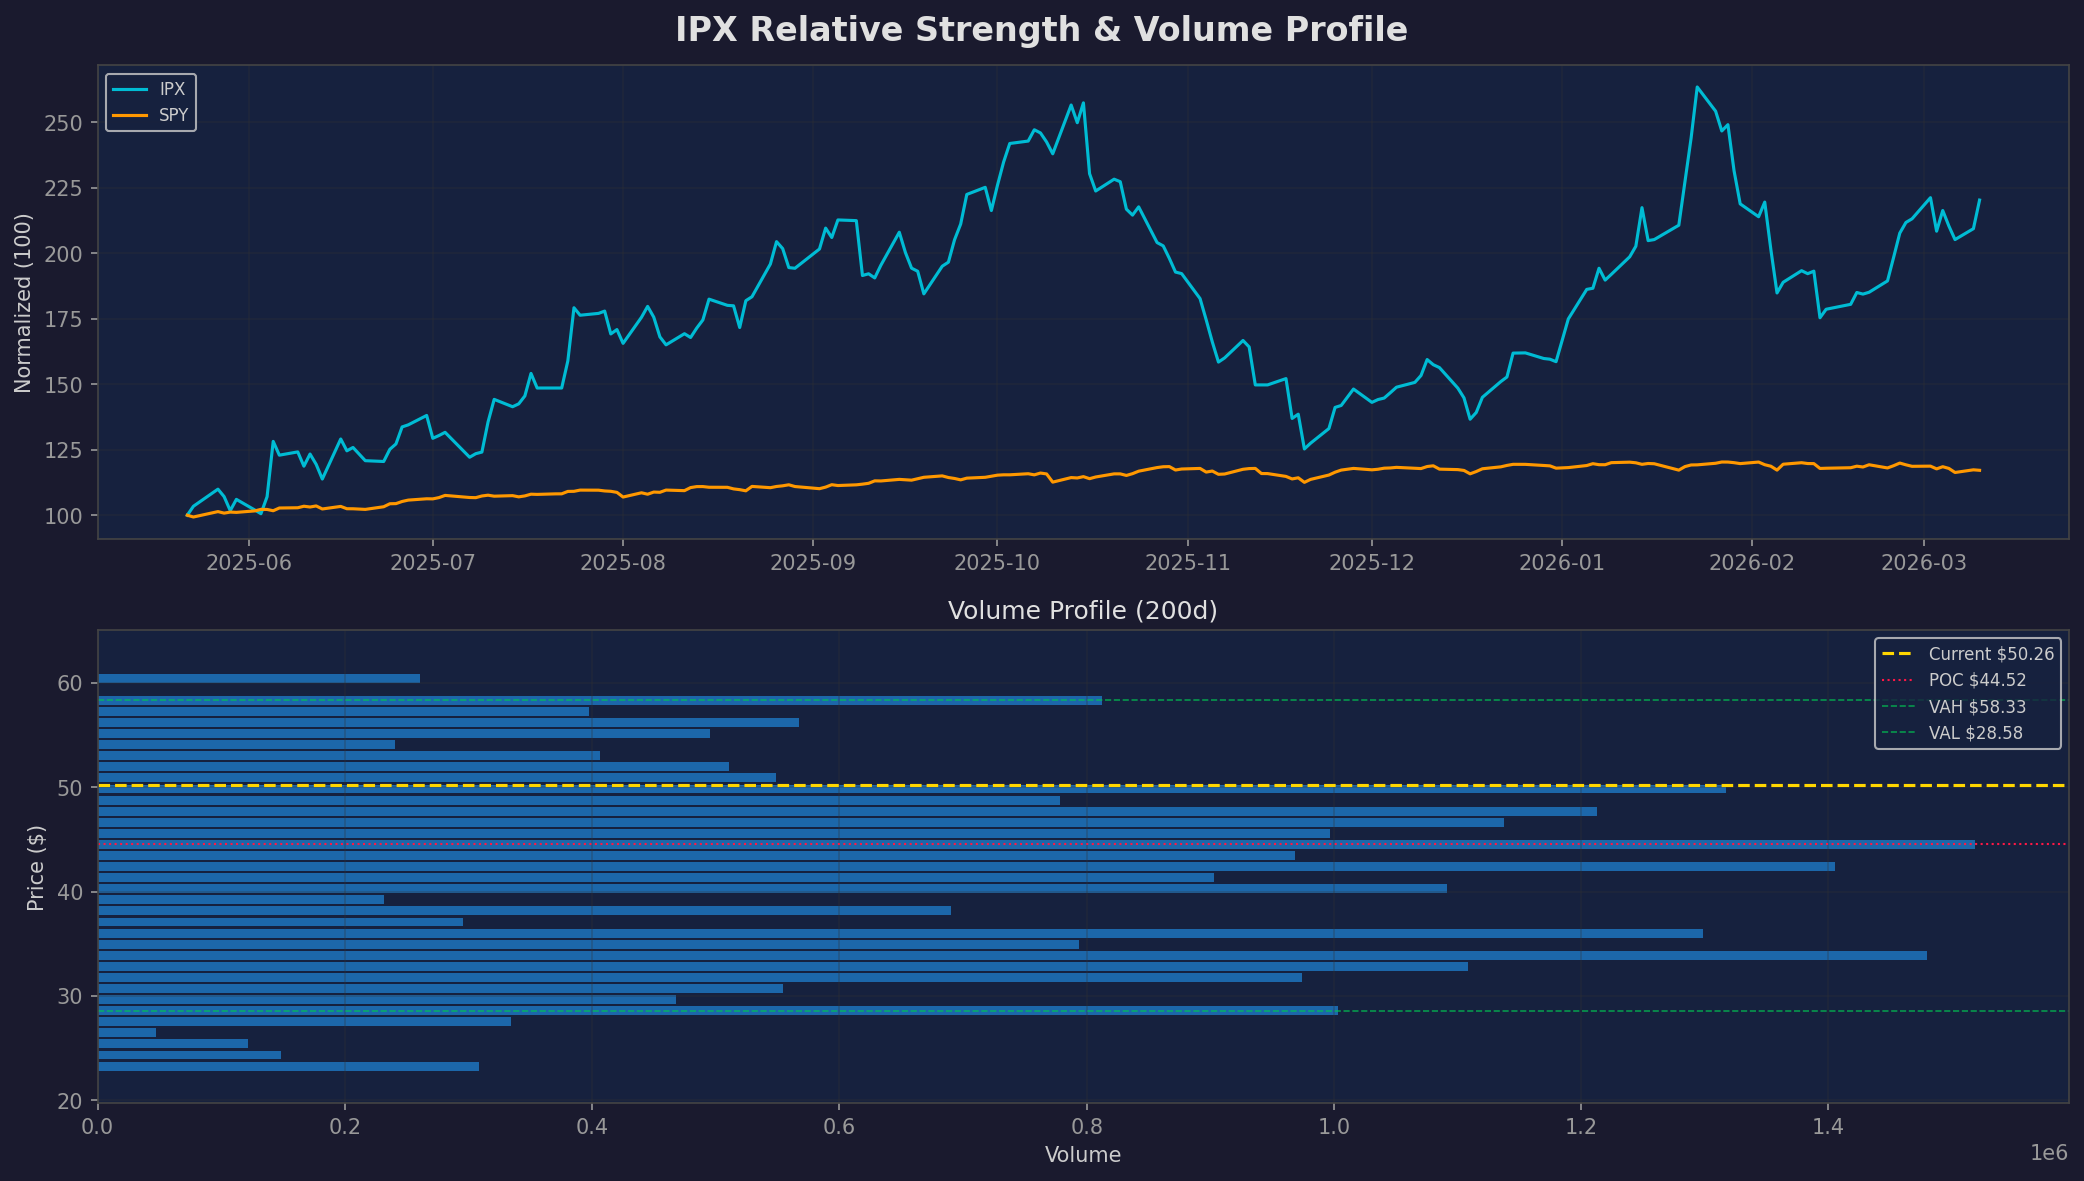
Vol POC: $44.52 Highest volume node (200d)
Swing Low: $38.52 Structure support (2026-02-13)
SMA200: $40.27 Long-term trend
RED FLAGS (2 found)
-----------------------------------------------------------
HIGH Max drawdown -66% in 3.5yr history [Volatility]
MEDIUM Stochastic overbought at 92.4 [Momentum]
===========================================================
2. Executive Summary
IPX has a strong bullish trend structure -- EMA stack is aligned (12>21>50, all rising), price is 24.8% above the SMA200, and the swing low sequence ($27.45 -> $31.17 -> $38.52) confirms progressively higher support. The stock has massively outperformed SPY over 20 days (+16.8%) and 50 days (+37.9%), with low correlation (0.43) confirming this is stock-specific strength, not beta.
However, the entry timing at $50.26 was suboptimal. Multiple indicators flagged short-term extension: Stochastic at 92.4, z-score 1.42, Donchian position 0.94, and price sitting exactly at the 50% Fibonacci retracement from ATH. The quant analysis recommended waiting for either a pullback to the EMA21/61.8% Fib cluster (~$47) or a confirmed breakout above $52.69.
The -12% after-hours move changes the calculus significantly. At ~$44, IPX would be: - Below the EMA50 ($45.38) -- first time since the February rally began - Near the volume POC ($44.52) -- the highest-volume price node over 200 days - All overbought signals (Stochastic, z-score, Donchian) would be reset - Approaching the key support zone between SMA200 ($40.27) and swing low ($38.52)
This transforms the setup from "strong trend but late entry" to "potential structure test with defined support."
3. Squeeze Analysis
| Metric | Value |
|---|---|
| Current ATR ratio | 1.184 |
| Currently in squeeze | No |
| Last squeeze | 2025-11-26 to 2026-01-14 (49 days) |
| Total squeeze episodes | 17 |
IPX is not in a squeeze. The last squeeze ended 2026-01-14, and price has moved +49% since. Historical squeeze breakout performance (n=17): best window is 10 days (+6.95% mean, 65% hit rate, 0.54 IR). The 20-day median return turns negative (-1.15%), suggesting squeeze momentum fades quickly in this name.
4. EMA Band Structure
| Level | Price | Distance from Close |
|---|---|---|
| Close | $50.26 | -- |
| EMA12 | $47.62 | +5.6% above |
| EMA21 | $46.94 | +7.1% above |
| EMA50 | $45.38 | +10.8% above |
| SMA200 | $40.27 | +24.8% above |
At the AH price of ~$44, the stock would be below the EMA50 for the first time since the rally began, testing a critical trend level.
5. Volume Analysis
| Metric | Value | Interpretation |
|---|---|---|
| 20d avg volume | 159,553 | 2.43x historical average |
| Up/Down volume ratio (20d) | 2.00 | Strongly bullish |
| Volume skew (50d) | 0.96 | Neutral |
| OBV 20d slope | +70,812 | Positive accumulation |
| A/D line 20d slope | +66,114 | Positive accumulation |
Volume is mixed but net-positive. The 20-day bullish signature (2.0 up/down ratio, positive OBV/AD) is strong, but the 50-day skew is neutral (0.96). The bullish volume is recent, not yet established over a longer window.
6. Relative Strength
| Window | IPX Return | SPY Return | Excess |
|---|---|---|---|
| 20d | +14.6% | -2.2% | +16.8% |
| 50d | +36.0% | -1.9% | +37.9% |
| 100d | -14.4% | +2.1% | -16.5% |
Exceptional short-term RS, but 100-day still negative. Low SPY correlation (0.43) confirms stock-specific catalysts driving the move.
7. Support/Resistance Framework
Fibonacci levels (ATH $61.45 to post-ATH low $38.52):
| Level | Price | Status |
|---|---|---|
| 23.6% | $56.04 | Overhead resistance |
| 38.2% | $52.69 | Near-term resistance |
| 50% | $49.99 | Close-of-day decision zone |
| 61.8% | $47.28 | First support |
| 78.6% | $43.44 | AH price landing zone |
Key insight: The -12% AH drop puts IPX near the 78.6% Fibonacci retracement ($43.44) -- a much deeper reset than the quant's recommended $47 pullback entry. This is near the volume POC ($44.52) and would test the EMA50 from below.
8. Drawdown History
| Episode | Drawdown | Duration |
|---|---|---|
| 1 | -66% | Longest |
| 2 | -51% | |
| 3 | -49% | |
| 4 | -43% |
IPX has experienced four 40%+ drawdowns in 3.5 years. Position sizing must account for this extreme volatility (lifetime HV = 83.3%).
Data through 2026-03-10. AH estimates based on reported -12% move.
Appendix A: Models & Configuration
Data Source
| Field | Value |
|---|---|
| Ticker | IPX |
| Source | data-samples/ohlcv/IPX.csv (yfinance) |
| Date range | 2022-06-21 to 2026-03-10 |
| Bars | 933 trading days |
| Benchmark | SPY (S&P 500 ETF) |
| Comparables attempted | MP, LTHM, LAC, UUUU, NXE, IREN, VALE, X, CLF, AA, CENX |
| Comparables found | IREN (only match in local dataset) |
Indicator Configuration
| Indicator | Parameters | Library/Source |
|---|---|---|
| Squeeze Detection | ATR(14) / SMA(ATR, 50), threshold ≤ 0.90 | models/shared/indicators.py — compute_atr(), compute_sma() |
| EMA Stack | EMA(12), EMA(21), EMA(50) | models/shared/indicators.py — compute_ema() |
| SMA 200 | SMA(200) | models/shared/indicators.py — compute_sma() |
| Donchian Channel | 20-period | models/shared/indicators.py — compute_donchian() |
| RSI | 14-period, Wilder smoothing (ewm alpha=1/14) | Custom (pandas ewm) |
| MACD | Fast=12, Slow=26, Signal=9 | Custom (via compute_ema()) |
| Stochastic | %K=14, %D=3 (SMA smoothing) | Custom (pandas rolling) |
| Bollinger Bands | 20-period SMA, 2 standard deviations | Custom (pandas rolling) |
| ATR | 14-period | models/shared/indicators.py — compute_atr() |
| OBV | Cumulative sign(return) × volume | Custom (numpy/pandas) |
| A/D Line | CLV multiplier × volume, cumulative | Custom (pandas) |
| Historical Volatility | 20-day and 50-day log-return std × √252 | Custom (pandas/numpy) |
| Volume Profile | 40 bins over 200-day range, volume-weighted | Custom (numpy histogram) |
Squeeze Detection Detail
The squeeze detector matches the TradingView Squeeze Breakout indicator configuration:
ATR_PERIOD = 14
ATR_SMA_PERIOD = 50
SQUEEZE_THRESHOLD = 0.90

atr_ratio = ATR(14) / SMA(ATR(14), 50)
in_squeeze = atr_ratio ≤ 0.90
- Threshold 0.90 matches the TV indicator's fire threshold (input max is 0.95 but 0.90 is the actual trigger)
- Note: The gut check engine uses a more conservative default of 0.80. Per-ticker registry overrides target ~0.90 to match TV.
Support/Resistance Detection
| Parameter | Value |
|---|---|
| Swing point lookback | 10 bars |
| Fibonacci reference high | All-time high ($61.45, 2026-01-26) |
| Fibonacci reference low | Post-ATH swing low ($38.52, 2026-02-13) |
| Volume profile lookback | 200 days |
| Value area threshold | 70% of total volume |
Composite Setup Scoring Rubric
| Factor | Max Points | Criteria |
|---|---|---|
| Squeeze | 2 | +2 if currently in squeeze, +1 if within 5 bars |
| EMA stack | 2 | +2 if bullish (12>21>50), +1 if above EMA50 |
| EMA50 trend | 1 | +1 if rising (10-bar slope > 0) |
| Above SMA200 | 1 | +1 if close > SMA200 |
| Volume skew | 1 | +1 if 50-day up/down avg volume ratio > 1.1 |
| RSI zone | 1 | +1 if RSI(14) between 40-65 |
| RS vs SPY | 1 | +1 if 20-day IPX return > SPY return |
| Vol compression | 1 | +1 if HV(20) < 80% of HV(all) |
| Total | 10 |
Signal Quality Methodology
Squeeze breakout forward returns were measured from the bar where atr_ratio crossed back above 0.90 (squeeze end). Forward windows: 5, 10, 20, 40 trading days. Hit rate = proportion of positive returns. Information Ratio = mean / std of forward returns.
Script
Analysis script: analysis/quant-research/scripts/ipx-technical-setup-2026-03-11.py
Charts