IPX
Conviction 3IPX -- Combined Deep Dive Assessment
Date: 2026-03-11 Asset Class: Equity Ticker: IPX (IperionX Limited)
Fundamental Summary
| Metric | Value |
|---|---|
| Overall Score | 43.3/100 |
| Verdict | AVOID |
| Red Flags | 3 HIGH, 2 MEDIUM |
The Market Analyst scored IPX at 43.3/100 with an AVOID verdict (valuation component < 20 triggers override). Key strengths: $54.8M cash with near-zero debt, $99M DoD SBIR Phase III contract, 16.82% insider ownership, and a compelling US titanium supply chain thesis. Three HIGH red flags: pre-revenue with accelerating losses ($34.8M half-year net loss, +115% YoY), extreme valuation (18.75x P/B, 361% premium to Morningstar fair value), and dilution risk ($75M capex need exceeds cash position). Two MEDIUM flags: HAMR technology unproven at commercial scale and single-asset concentration on Virginia facility.
Technical Summary
| Metric | Value |
|---|---|
| Overall Score | 7.0/10 |
| Bias | Bullish (with timing caveat) |
| Red Flags | 1 HIGH, 1 MEDIUM |
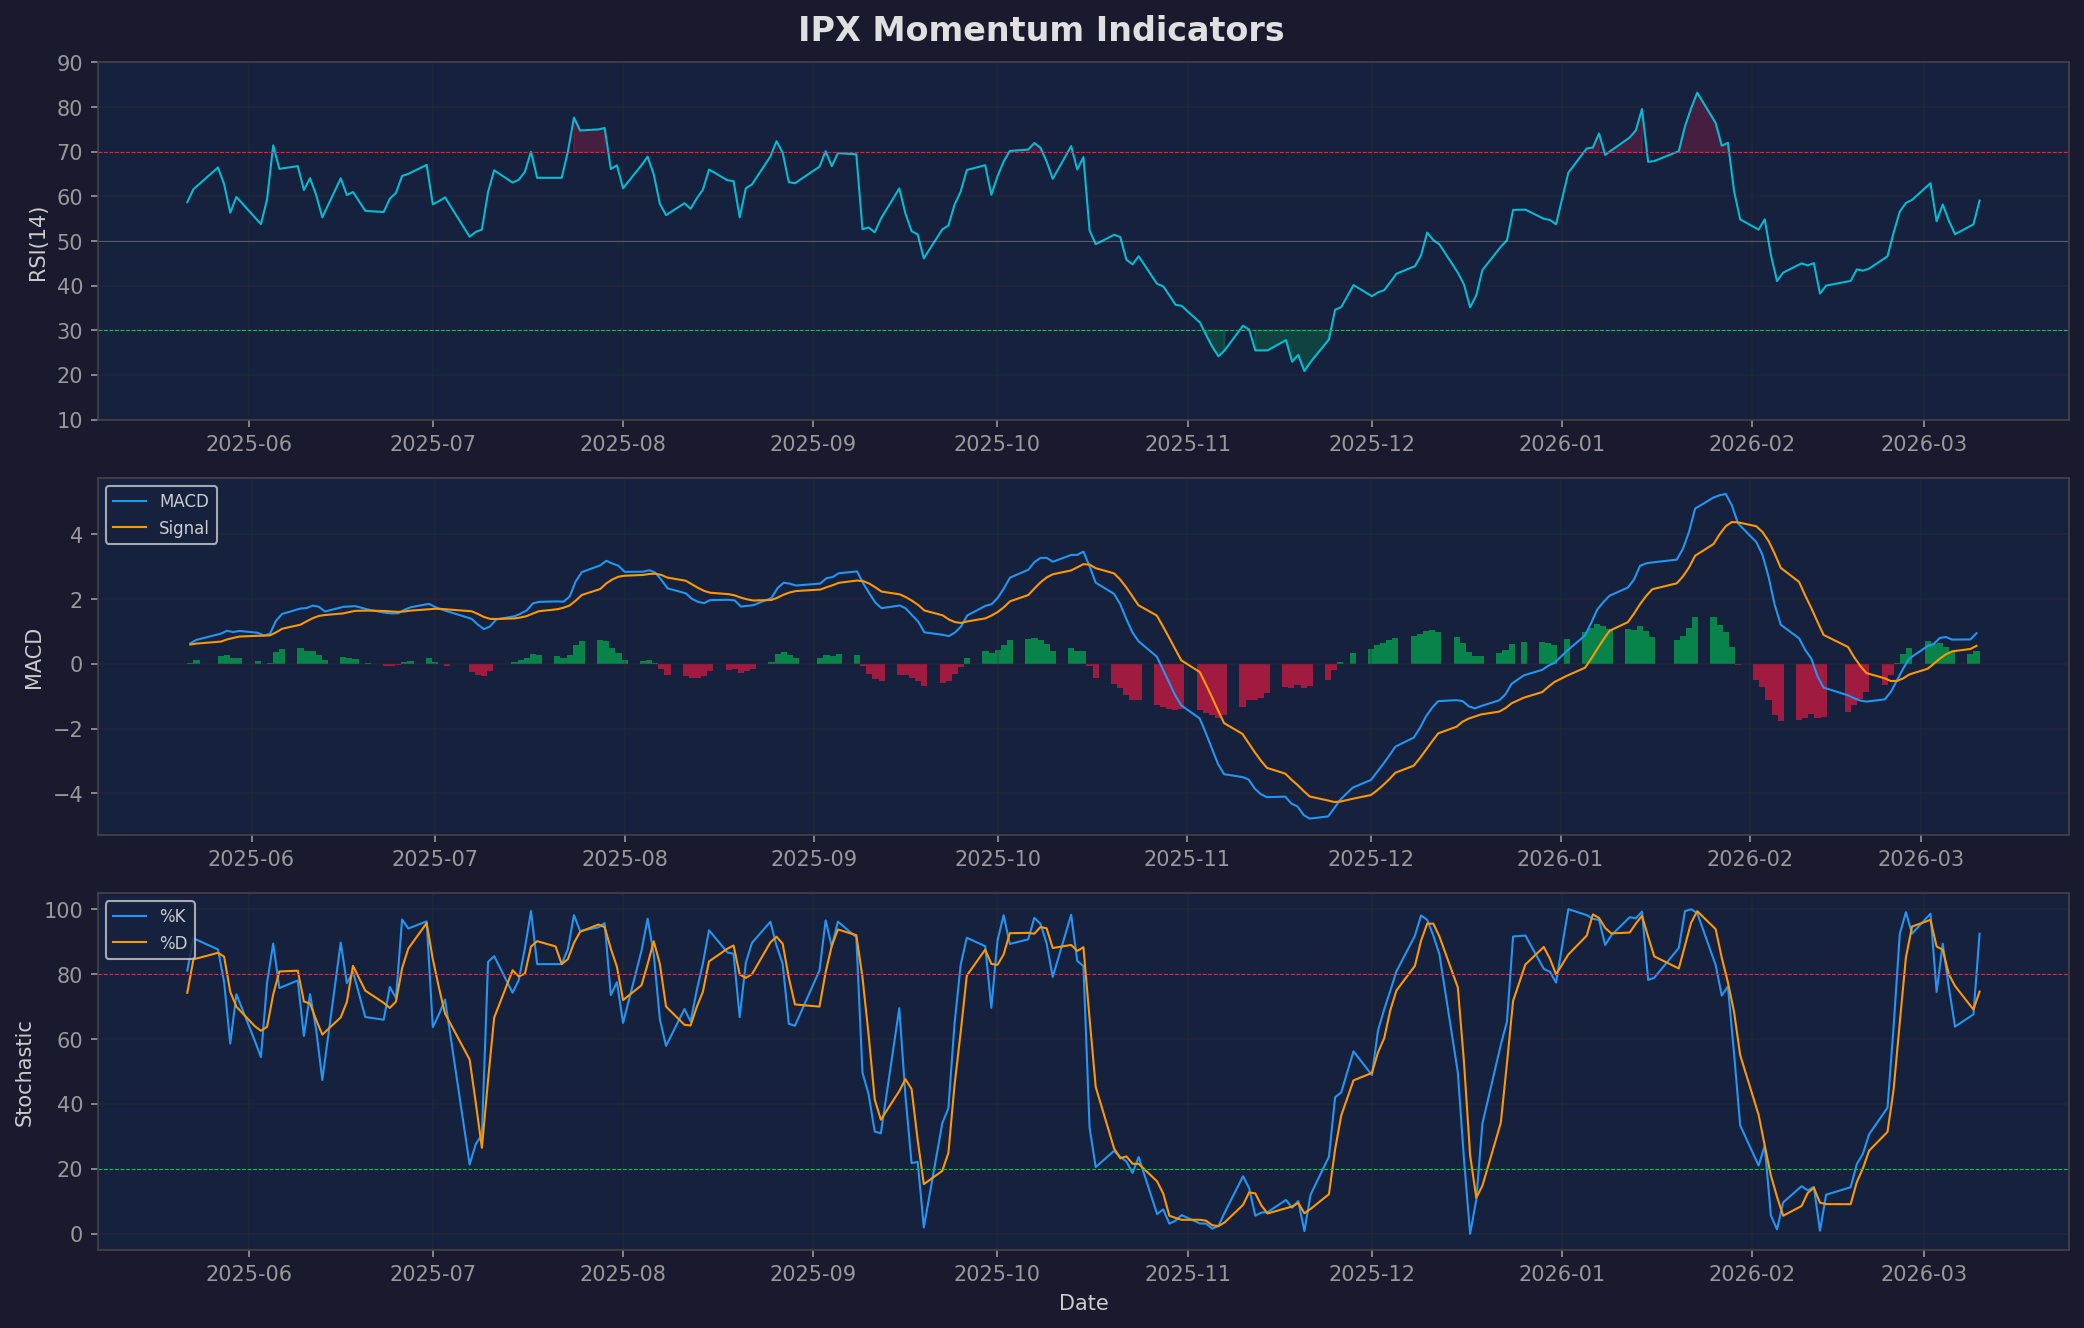
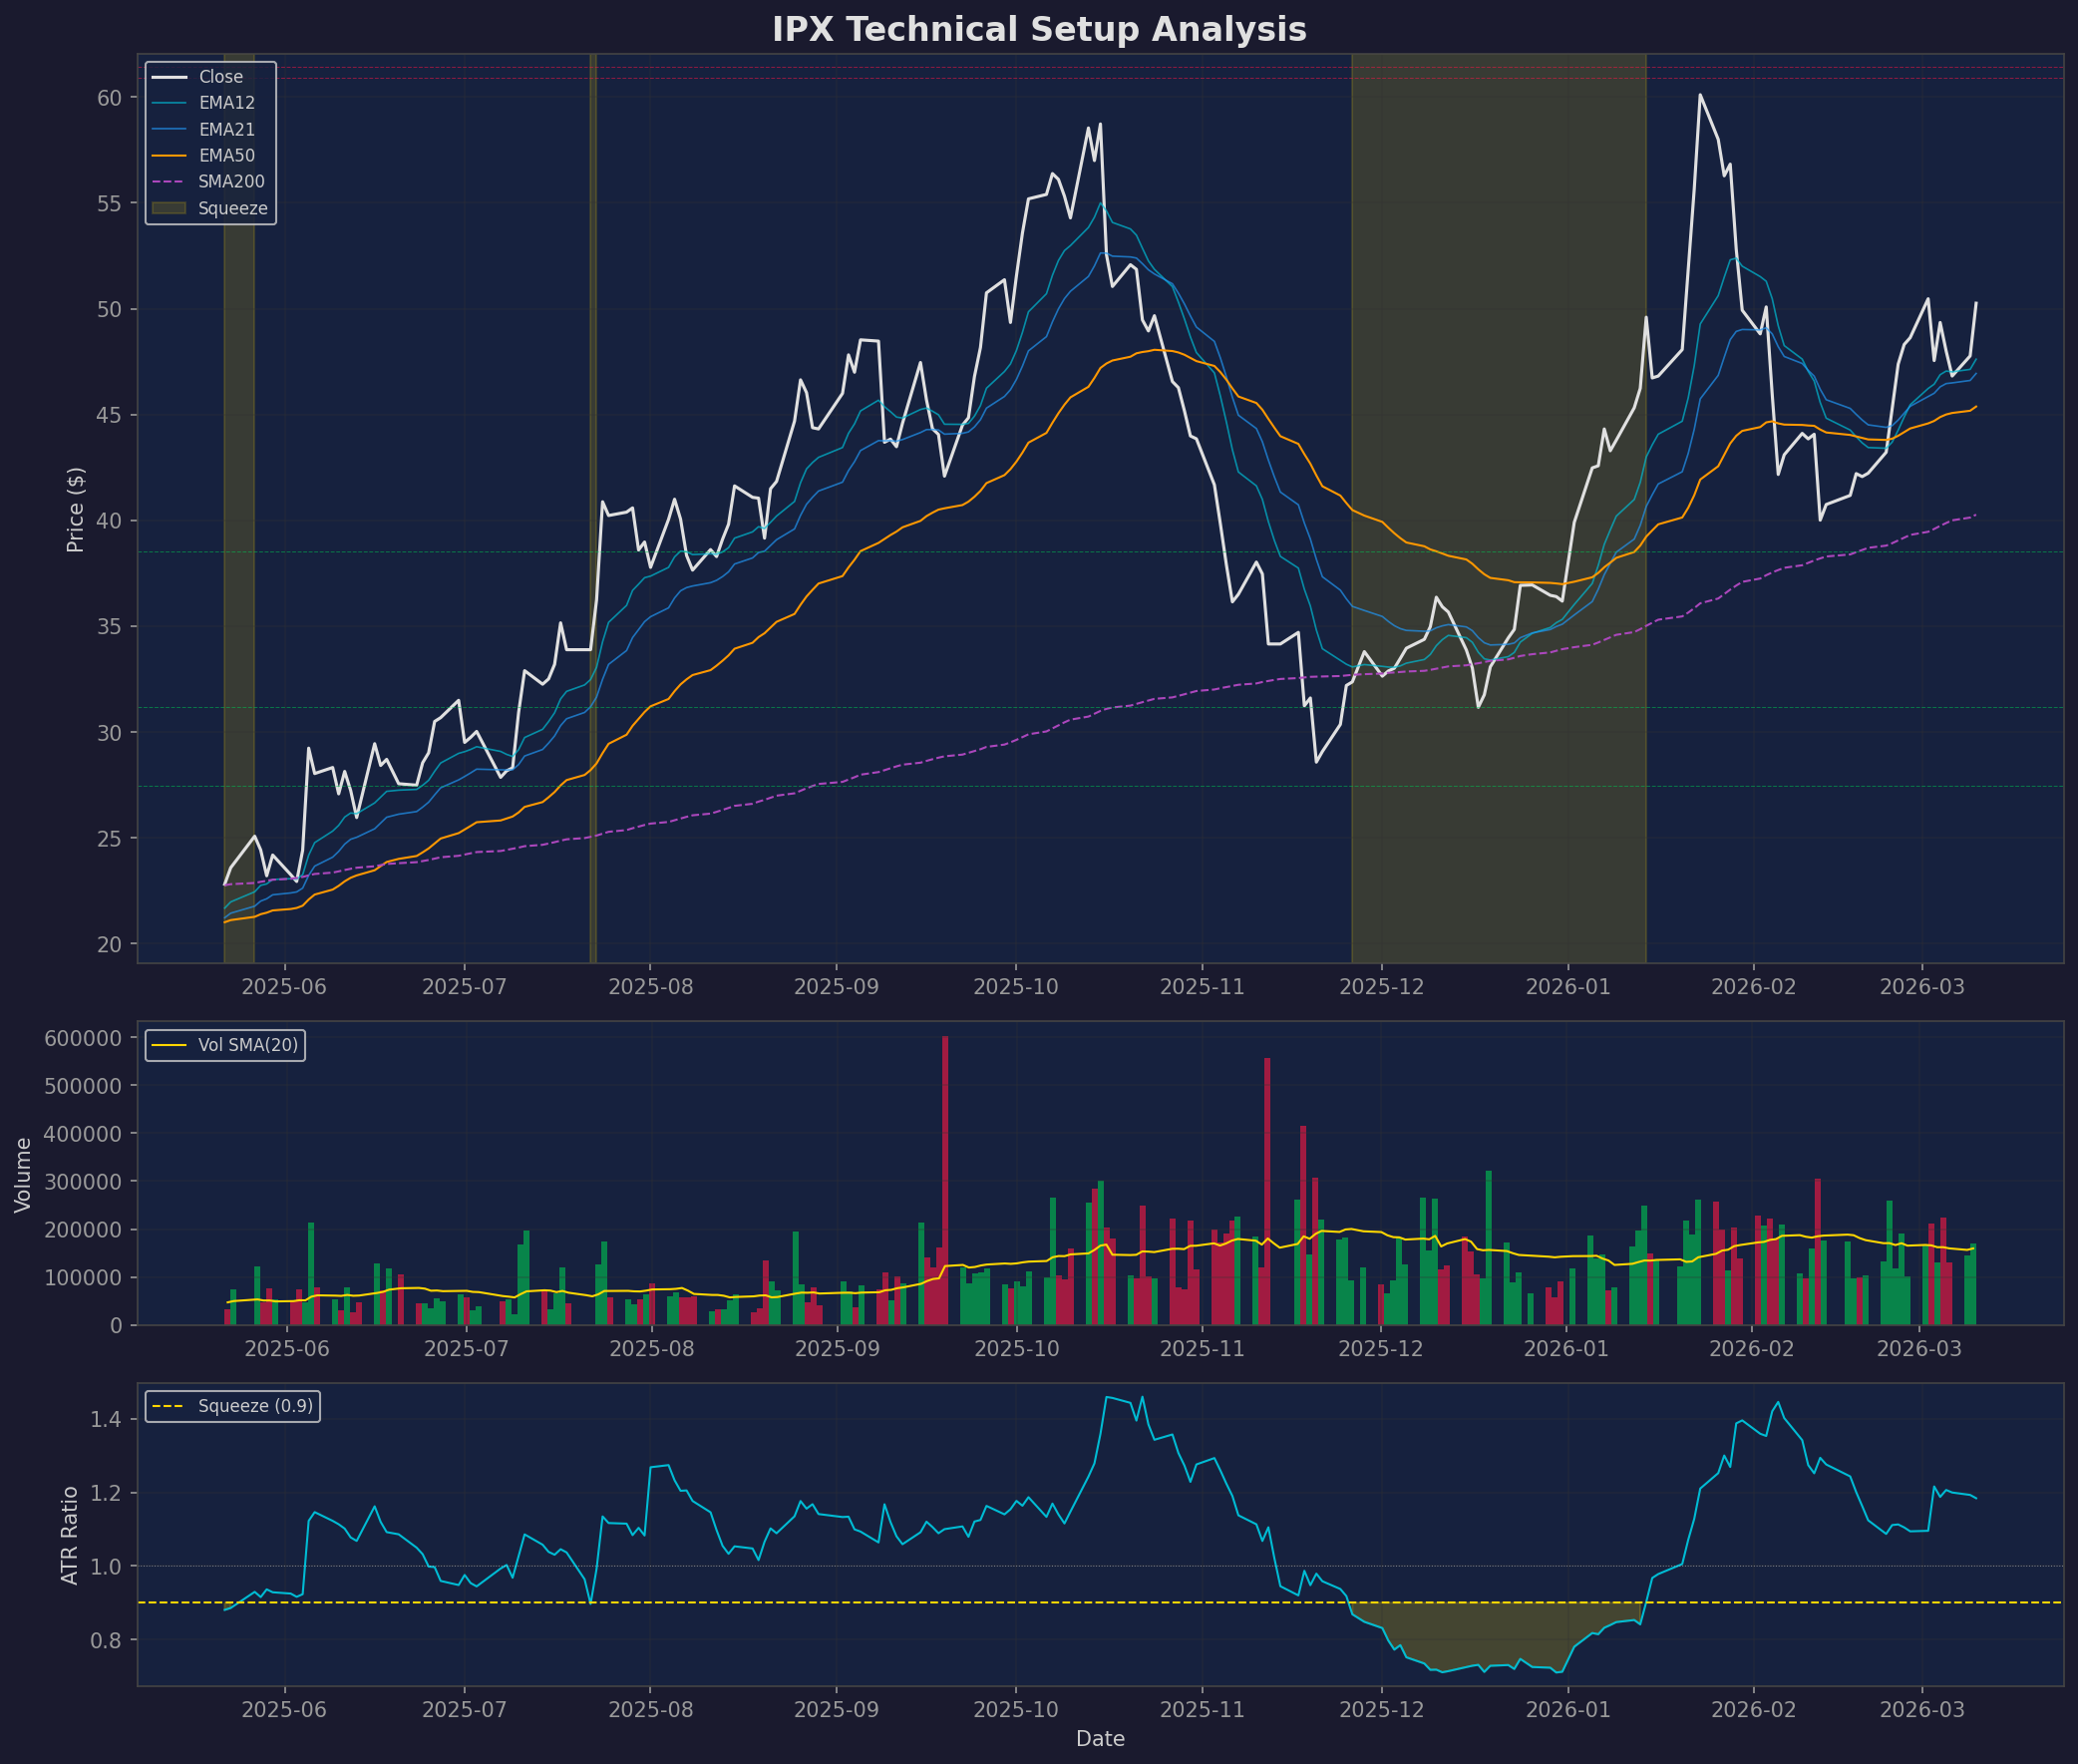
The Quant Researcher scored IPX at 7.0/10 with a Bullish bias, though with significant timing caveats. The trend structure is strong -- bullish EMA stack (12>21>50, all rising), higher-low sequence ($27.45 -> $31.17 -> $38.52), massive relative strength vs. SPY (+16.8% over 20d, +37.9% over 50d), and stock-specific strength (SPY correlation only 0.43). However, at the $50.26 close, the stock was extended (Stochastic 92.4, z-score 1.42, exactly at 50% Fib retracement). The -12% after-hours drop on earnings materially changes the entry picture -- see below.
PARTIAL AGREEMENT Assessment
Fundamental-Technical Alignment: PARTIAL-CONSTRUCTIVE
The fundamental and technical analyses reach different headline conclusions but are more aligned than they appear:
-
Thesis validation: Both analyses confirm IPX's strategic positioning is genuine. Fundamentals cite the DoD $99M contract, bipartisan titanium supply chain support, and strong insider ownership. Technicals confirm stock-specific strength (low SPY correlation, massive RS outperformance) driven by catalysts rather than market beta.
-
Risk recognition: Both flag serious risks. Fundamentals highlight the zero-revenue, high-burn profile with likely dilution. Technicals highlight extreme historical drawdowns (-66% max) and low liquidity (~66K avg volume). Neither analysis suggests this is a safe, low-risk position.
-
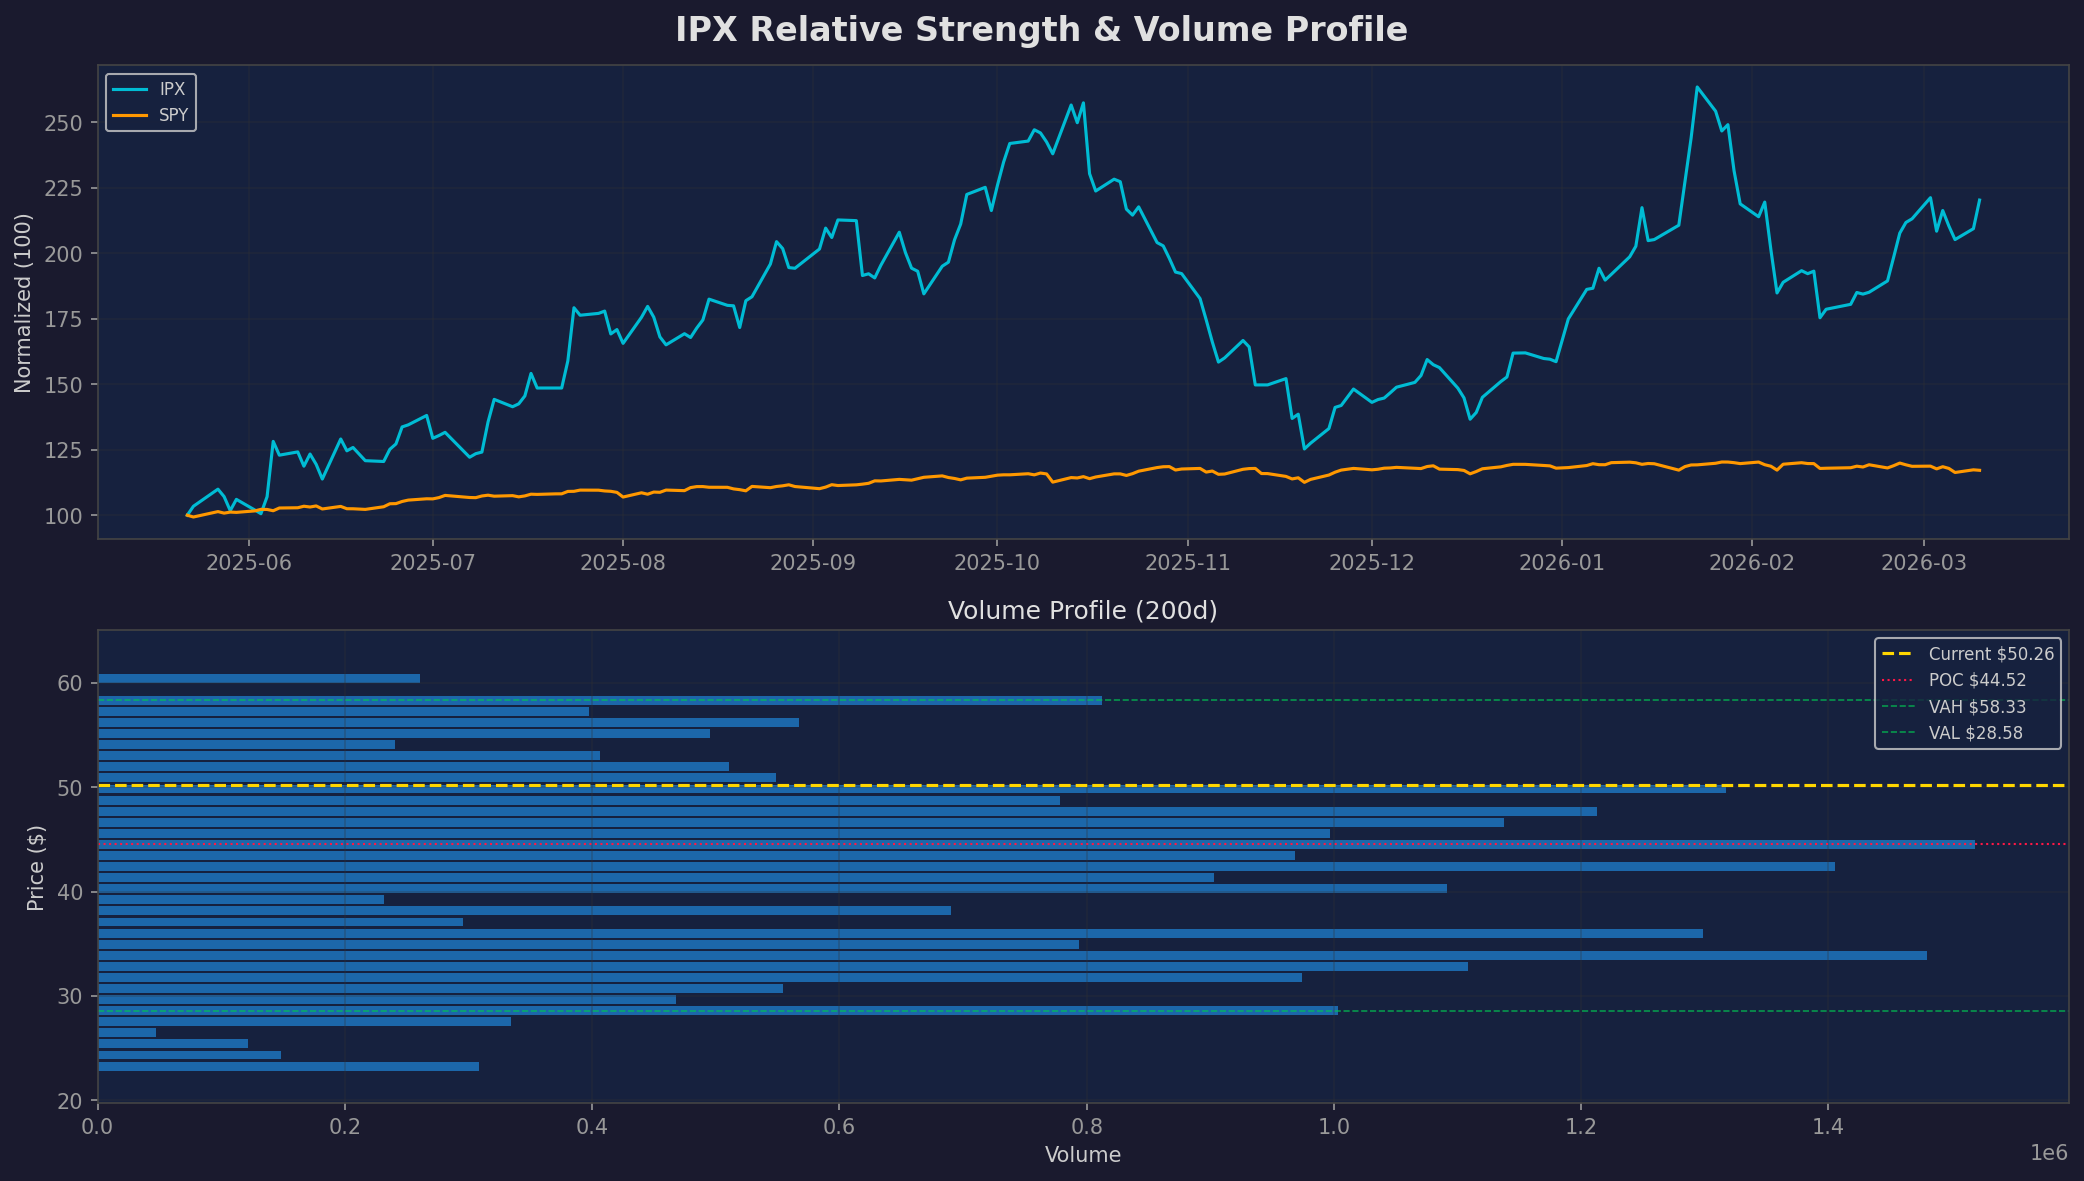
Timing divergence resolved by AH move: The quant analysis at $50.26 recommended waiting for a pullback to $47 (EMA21/61.8% Fib cluster). The -12% after-hours drop to ~$44 overshoots this target, landing near the 78.6% Fib ($43.44) and volume POC ($44.52). This resolves the "strong trend but late entry" problem flagged by the technical analysis.
-
Valuation vs. momentum tension: The fundamental AVOID rating (driven by 18.75x P/B on zero revenue) directly conflicts with the technical bullish structure. This is the defining tension: IPX is fundamentally expensive but technically constructive. This tension is common in pre-revenue companies with strong narratives and is not resolvable through analysis -- it requires a position sizing decision.
Where they agree: IPX is a speculative position that requires small sizing, defined risk, and patience. The catalyst pipeline (DFS Q2 2026, facility commissioning mid-2027) provides concrete milestones to trade around. Both analyses would be more constructive with a lower entry price -- the AH drop helps.
Where they disagree: Fundamentals say AVOID; technicals say the trend is bullish. This disconnect is structural for pre-revenue companies where the market prices in future execution. The technical analysis is more useful for entry timing; the fundamental analysis is more useful for position sizing and risk management.
Key Levels
| Level | Price | Source |
|---|---|---|
| ATH / Resistance 3 | $61.45 | Technical: 2026-01-26 high |
| 38.2% Fib | $52.69 | Technical: breakout confirmation level |
| 50% Fib | $49.99 | Technical: close-of-day decision zone |
| Close (Mar 10) | $50.26 | -- |
| 61.8% Fib | $47.28 | Technical: original pullback target |
| EMA21 | $46.94 | Technical: trend support |
| EMA50 | $45.38 | Technical: key trend level |
| Vol POC | $44.52 | Technical: highest volume node (200d) |
| AH Price | ~$44 | Post-earnings landing zone |
| 78.6% Fib | $43.44 | Technical: deep retracement support |
| SMA200 | $40.27 | Technical: long-term trend |
| Swing Low | $38.52 | Technical: structure support (2026-02-13) |
Risk/Reward Framework
Scenario 1: Structure Hold at POC/78.6% Fib (Base Case)
- Entry: $43-45 (AH zone, near POC $44.52 and 78.6% Fib $43.44)
- Stop: $37.50 (below swing low $38.52)
- Target 1: $50 (50% Fib reclaim) -- R:R ~1.0:1
- Target 2: $53 (38.2% Fib breakout) -- R:R ~1.5:1
- Target 3: $61+ (ATH retest) -- R:R ~2.7:1
- Probability: Moderate (40%) -- AH gap fills partially, trend structure holds
Scenario 2: Deeper Pullback to SMA200/Swing Low
- Entry: $38-40 (SMA200 and swing low cluster)
- Stop: $35.00 (below structure)
- Target 1: $45 (POC reclaim) -- R:R ~1.7:1
- Target 2: $50 (50% Fib) -- R:R ~3.3:1
- Probability: Lower (25%) -- would require sustained selling beyond AH reaction
Scenario 3: Structure Break (Bearish)
- Probability: 20%
- Thesis: Earnings reaction triggers institutional selling, swing low at $38.52 fails
- Downside target: $30-33 (prior accumulation zone)
- Action: No long entry; re-evaluate fundamental thesis
Scenario 4: AH Gap Fill / V-Recovery
- Probability: 15%
- Thesis: Market overreacted to expected earnings miss; opens down but recovers quickly
- Action: Wait for confirmation above EMA50 ($45.38) before entry
Catalyst Timeline
| Date | Event | Expected Impact |
|---|---|---|
| 2026-03-11 (AH) | Half-year earnings reaction (-12%) | HIGH -- creates entry opportunity if support holds |
| Q2 2026 | Titan DFS (Definitive Feasibility Study) | HIGH -- key de-risking milestone |
| Mid-2027 | Virginia facility commissioning (1,400 tpa) | HIGH -- transforms from pre-revenue to revenue |
| Ongoing | DoD $99M SBIR Phase III execution | MEDIUM -- validates defense demand |
| Ongoing | U.S. Army initial purchase orders | MEDIUM -- first commercial revenue signal |
| Unknown | Additional government contracts | MEDIUM -- supply chain policy tailwind |
Conviction Assessment
| Component | Value | Rationale |
|---|---|---|
| Fund-Tech Agreement | 0.5 | Partial -- fundamentals say AVOID (valuation), technicals say bullish structure; aligned on speculation |
| Catalyst Density | 0.7 | Dense -- DFS Q2 2026, DoD contract execution, facility milestones within 12 months |
| Data Quality | 0.5 | Short history (3.5yr), pre-revenue, low liquidity, n=17 squeeze sample |
| Risk/Reward Asymmetry | 0.7 | AH drop improves significantly; $44 entry with $38 stop offers 2.7:1 to ATH |
| Red Flag Severity | 0.35 | 3 HIGH fundamental + 1 HIGH technical; all structural/disclosed but severe |
Conviction Score: 3 (Moderate) Weighted Score: 55.0/100 Position Sizing: Speculative (25-50% of standard position)
Actionable Framework
Entry approach: The -12% AH drop creates a more favorable entry than what existed at the close. Wait for the open to assess: 1. If IPX opens near $44 and holds above $43 (78.6% Fib), a starter position at speculative sizing is supported by the technical structure 2. If it breaks below $38.52 (swing low), no entry -- structure is broken 3. Consider scaling: 50% at $43-44, add 50% on reclaim of EMA50 ($45.38)
Stop loss: Below swing low at $38.52. Aggressive stop at $37.50 gives room for wick. ATR-based alternative: 2x ATR ($5.88) below entry = ~$38 from a $44 entry.
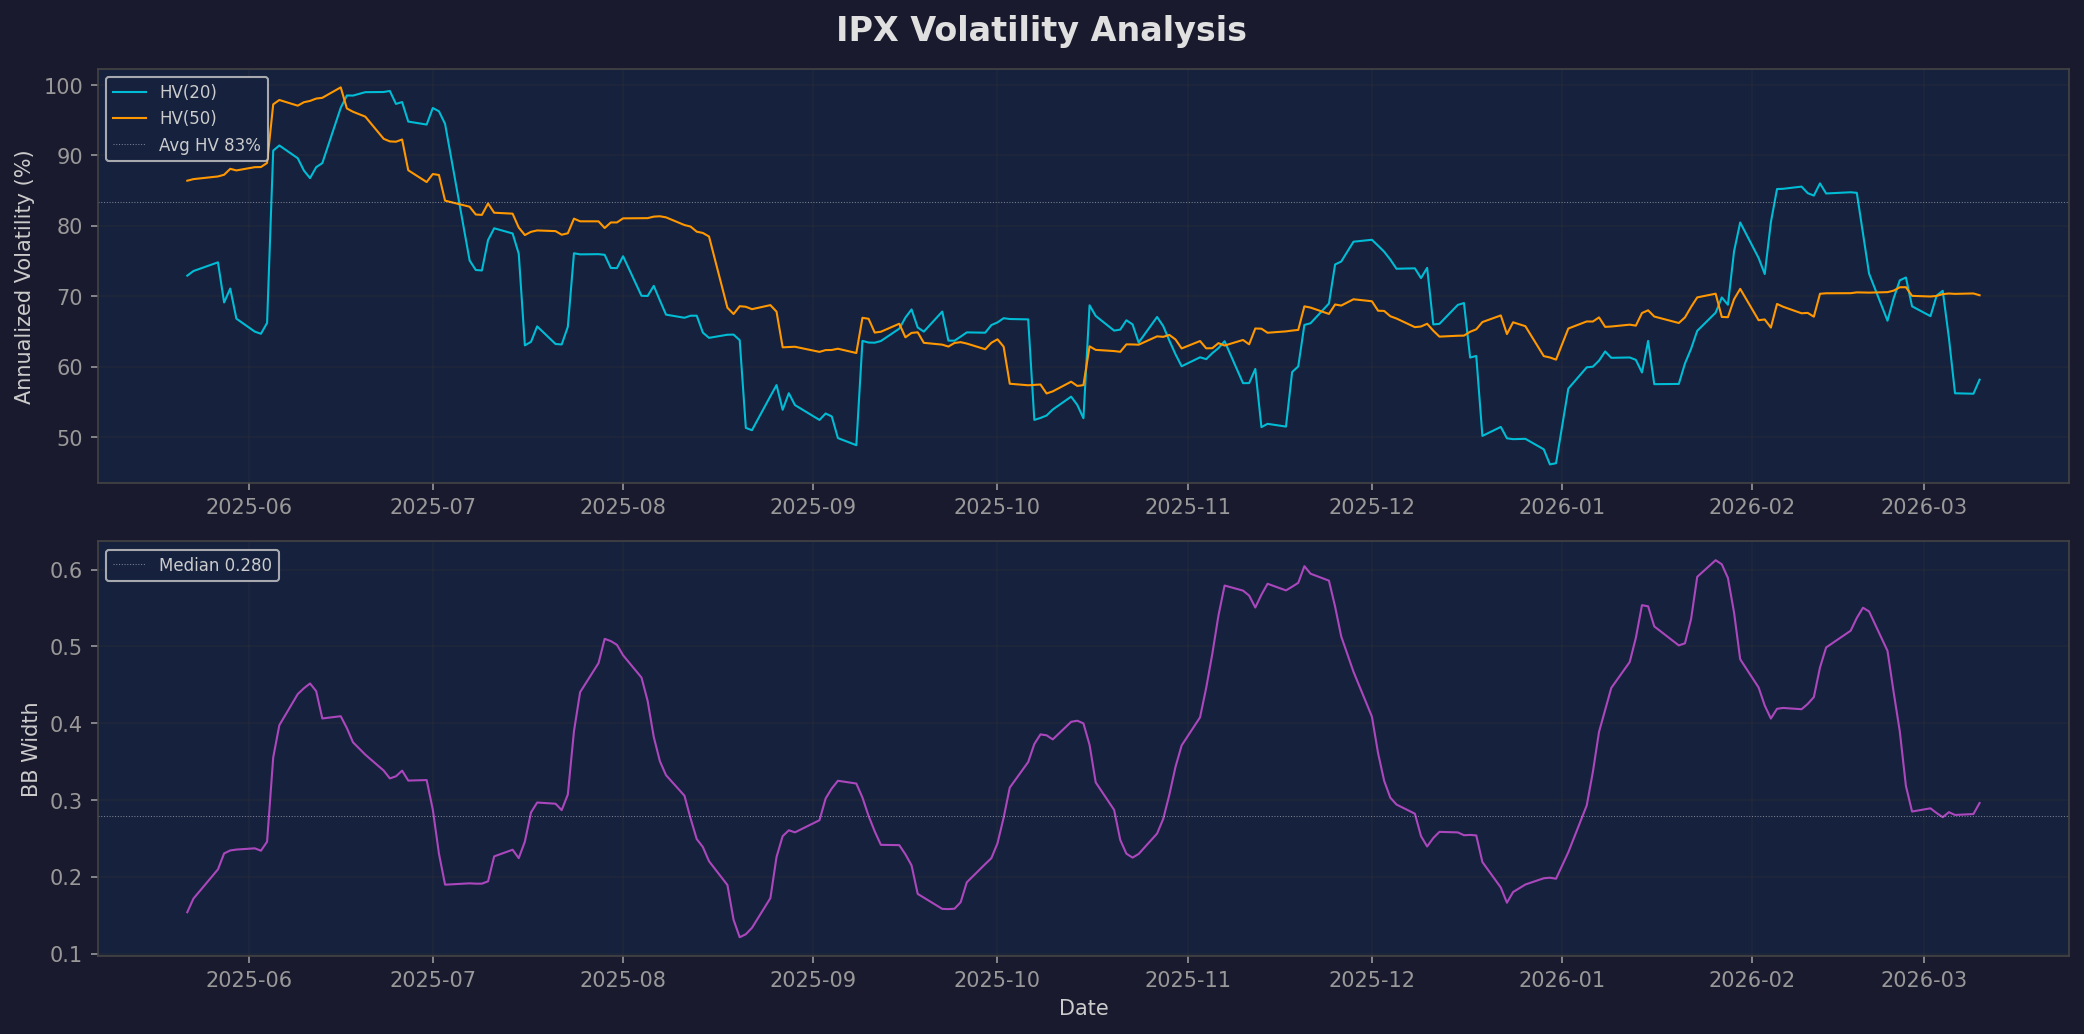
Position sizing: Given AVOID fundamental rating, extreme volatility (HV 83%, max DD -66%), and pre-revenue status, this must be sized as speculative. 25-50% of standard position size. The catalyst pipeline justifies the speculation; the fundamentals demand the constraint.
What to watch: - Bullish: Holds $43-44 at open, volume confirms support, reclaims EMA50 within days - Bearish: Opens below $43, fails to bounce, breaks swing low $38.52 - Catalyst: DFS announcement Q2 2026 is the next major thesis milestone
What would change the thesis: - Upgrade trigger: DFS confirms economics + first commercial revenue + facility on schedule - Downgrade trigger: DFS delayed + additional dilutive raise at depressed prices + DoD contract issues
Charts