GLW — Technical Summary
Conviction 4GLW -- Technical Deep Dive
- Date: 2026-03-28
- Researcher: Quant Researcher (Signals)
- Status: Complete
- Script:
analysis/quant-research/scripts/GLW-technical-2026-03-28.py - Charts:
analysis/quant-research/charts/glw_price_structure.png,glw_momentum.png,glw_volume_accumulation.png,glw_volatility.png,glw_relative_strength_spy.png
Plain-language summary: GLW has been one of the strongest large-cap names in 2026, up 51% YTD after a massive earnings gap in late January rerated the stock from the $90s to $110+. It sits above all major moving averages with a bullish EMA stack, and has dramatically outperformed SPY (by over 60 percentage points over 3 months). The main concern is extreme volatility -- daily swings of 6%+ are routine, and the stock just pulled back 25% from its March 2 high before bouncing. This is a momentum name that rewards trend-following but punishes anyone who sizes too large or enters at a swing high without a plan for the inevitable 15-25% pullback.
1. Score Box
===========================================================
  GLW -- Technical Analysis                   2026-03-28
  Asset Class: Equity
  Price: $136.81  |  52wk: $37.31 - $162.10
===========================================================

  OVERALL SCORE: 7.1/10      BIAS: Bullish

  COMPONENT SCORES
  -----------------------------------------------------------
  Trend Alignment        10.0/10  wt 25%  Above all MAs; bullish EMA stack
  Momentum                7.5/10  wt 20%  RSI neutral; MACD hist negative
  Volume Confirmation     4.5/10  wt 20%  OBV/AD falling; up/down vol weak
  Volatility Profile      2.5/10  wt 15%  ATR 6.2%; HV 79%; very elevated
  Market Structure        9.0/10  wt 20%  HH/HL intact; unfilled gap holds

  KEY LEVELS
  -----------------------------------------------------------
  Resistance 2:  $162.10   52-week high / Feb 25 swing high
  Resistance 1:  $150.25   Mar 25 bounce high / VWAP of upper zone
  Current Price: $136.81
  Support 1:     $125.94   SMA 50 / EMA 50 cluster (~$125.72-$125.94)
  Support 2:     $120.01   Mar 9 swing low / correction bottom

  RED FLAGS                                    (3 found)
  -----------------------------------------------------------
  MEDIUM  Elevated ATR (6.24% of price)        [Volatility]
  MEDIUM  High 20-day HV (79.3% annualized)    [Volatility]
  MEDIUM  Recent single-day move of 15.6%      [Volatility]
  (If none: "No technical red flags identified.")

===========================================================
2. Executive Summary
Corning (GLW) has undergone a fundamental rerate in 2026, transforming from a $90 specialty glass company into a $135+ AI-infrastructure play. The catalyst was a massive earnings gap on January 27 -- the stock jumped 15.6% on 4.2x average volume, opening at $102 and closing at $110. That gap has never been filled (post-gap low was $99.50 on Jan 29), confirming institutional conviction behind the move.
Since then, GLW has been a tale of two forces: relentless trend strength and punishing volatility. The stock is +51% YTD, +53% over 3 months, and +73% over 6 months. It sits above every moving average (SMA 50, 100, 200 and all EMAs), with a perfectly ordered bullish EMA stack (12 > 21 > 50). Over the same period, SPY has declined roughly 8%, making GLW's relative outperformance of 60+ percentage points one of the most pronounced in the large-cap universe.
The catch is the volatility. ATR is 6.24% of price, 20-day historical volatility is 79% annualized, and the stock experienced a 25% drawdown ($160 to $120) in just 8 trading days during early March. This is not a low-risk trend-following setup -- it requires conviction, proper sizing, and stop discipline to capture the trend without being shaken out by routine 10-15% pullbacks.
The current technical setup shows GLW consolidating between $124-$150 after the March correction, with the 50-day moving average rising at $126 and providing dynamic support. Momentum is neutral (RSI 52.7, MACD histogram slightly negative), suggesting the stock is digesting the correction rather than resuming the decline. Volume patterns are the weakest element: OBV and A/D line are both falling over the last 20 days, and the up/down volume ratio is 0.85 -- below 1.0, indicating sellers have had slightly more conviction than buyers in recent sessions.
3. Price Structure
52-Week Range
| Metric | Value |
|---|---|
| 52-Week High | $162.10 (2026-02-25) |
| 52-Week Low | $37.31 (2025-04-07) |
| Current Price | $136.81 |
| % From High | -15.60% |
| % From Low | +266.68% |
| 52-Week Range | $124.79 |
The 52-week range is unusually wide because the stock was trading at $37 a year ago, long before the fundamental rerate. For practical purposes, the relevant trading range since the Jan 27 gap is $99.50 (post-gap low) to $162.10 (Feb 25 high), a span of $62.60. The current price at $136.81 sits at the 59.6th percentile of this post-gap range.
Fibonacci Retracements (from 52-week range)
| Level | Price | Status |
|---|---|---|
| 0.0 (Low) | $37.31 | Irrelevant -- pre-rerate |
| 0.236 | $66.76 | Irrelevant -- pre-rerate |
| 0.382 | $84.98 | Below gap fill |
| 0.500 | $99.70 | Near gap fill level ($94.95) |
| 0.618 | $114.43 | Jan 27 gap area |
| 0.786 | $135.39 | Near current price -- active |
| 1.0 (High) | $162.10 | Feb 25 high |
The 0.786 Fibonacci level at $135.39 is the most relevant -- it sits just below the current price and has acted as both resistance and support over the last 3 weeks. A sustained break below this level would open the path toward $126 (50 SMA) and $120 (March 9 swing low).
Recent Performance
| Period | Return |
|---|---|
| 1 Week | +9.82% |
| 2 Weeks | +5.96% |
| 1 Month | -8.98% |
| 3 Months | +52.59% |
| 6 Months | +72.89% |
| YTD | +50.89% |
The 1-week return of +9.8% reflects the bounce off the March 20 low ($124.41 intraday). The 1-month return of -9.0% captures the correction from the $150+ area. The 3-month and 6-month returns are extraordinary and place GLW among the top-performing large-cap equities in the market.
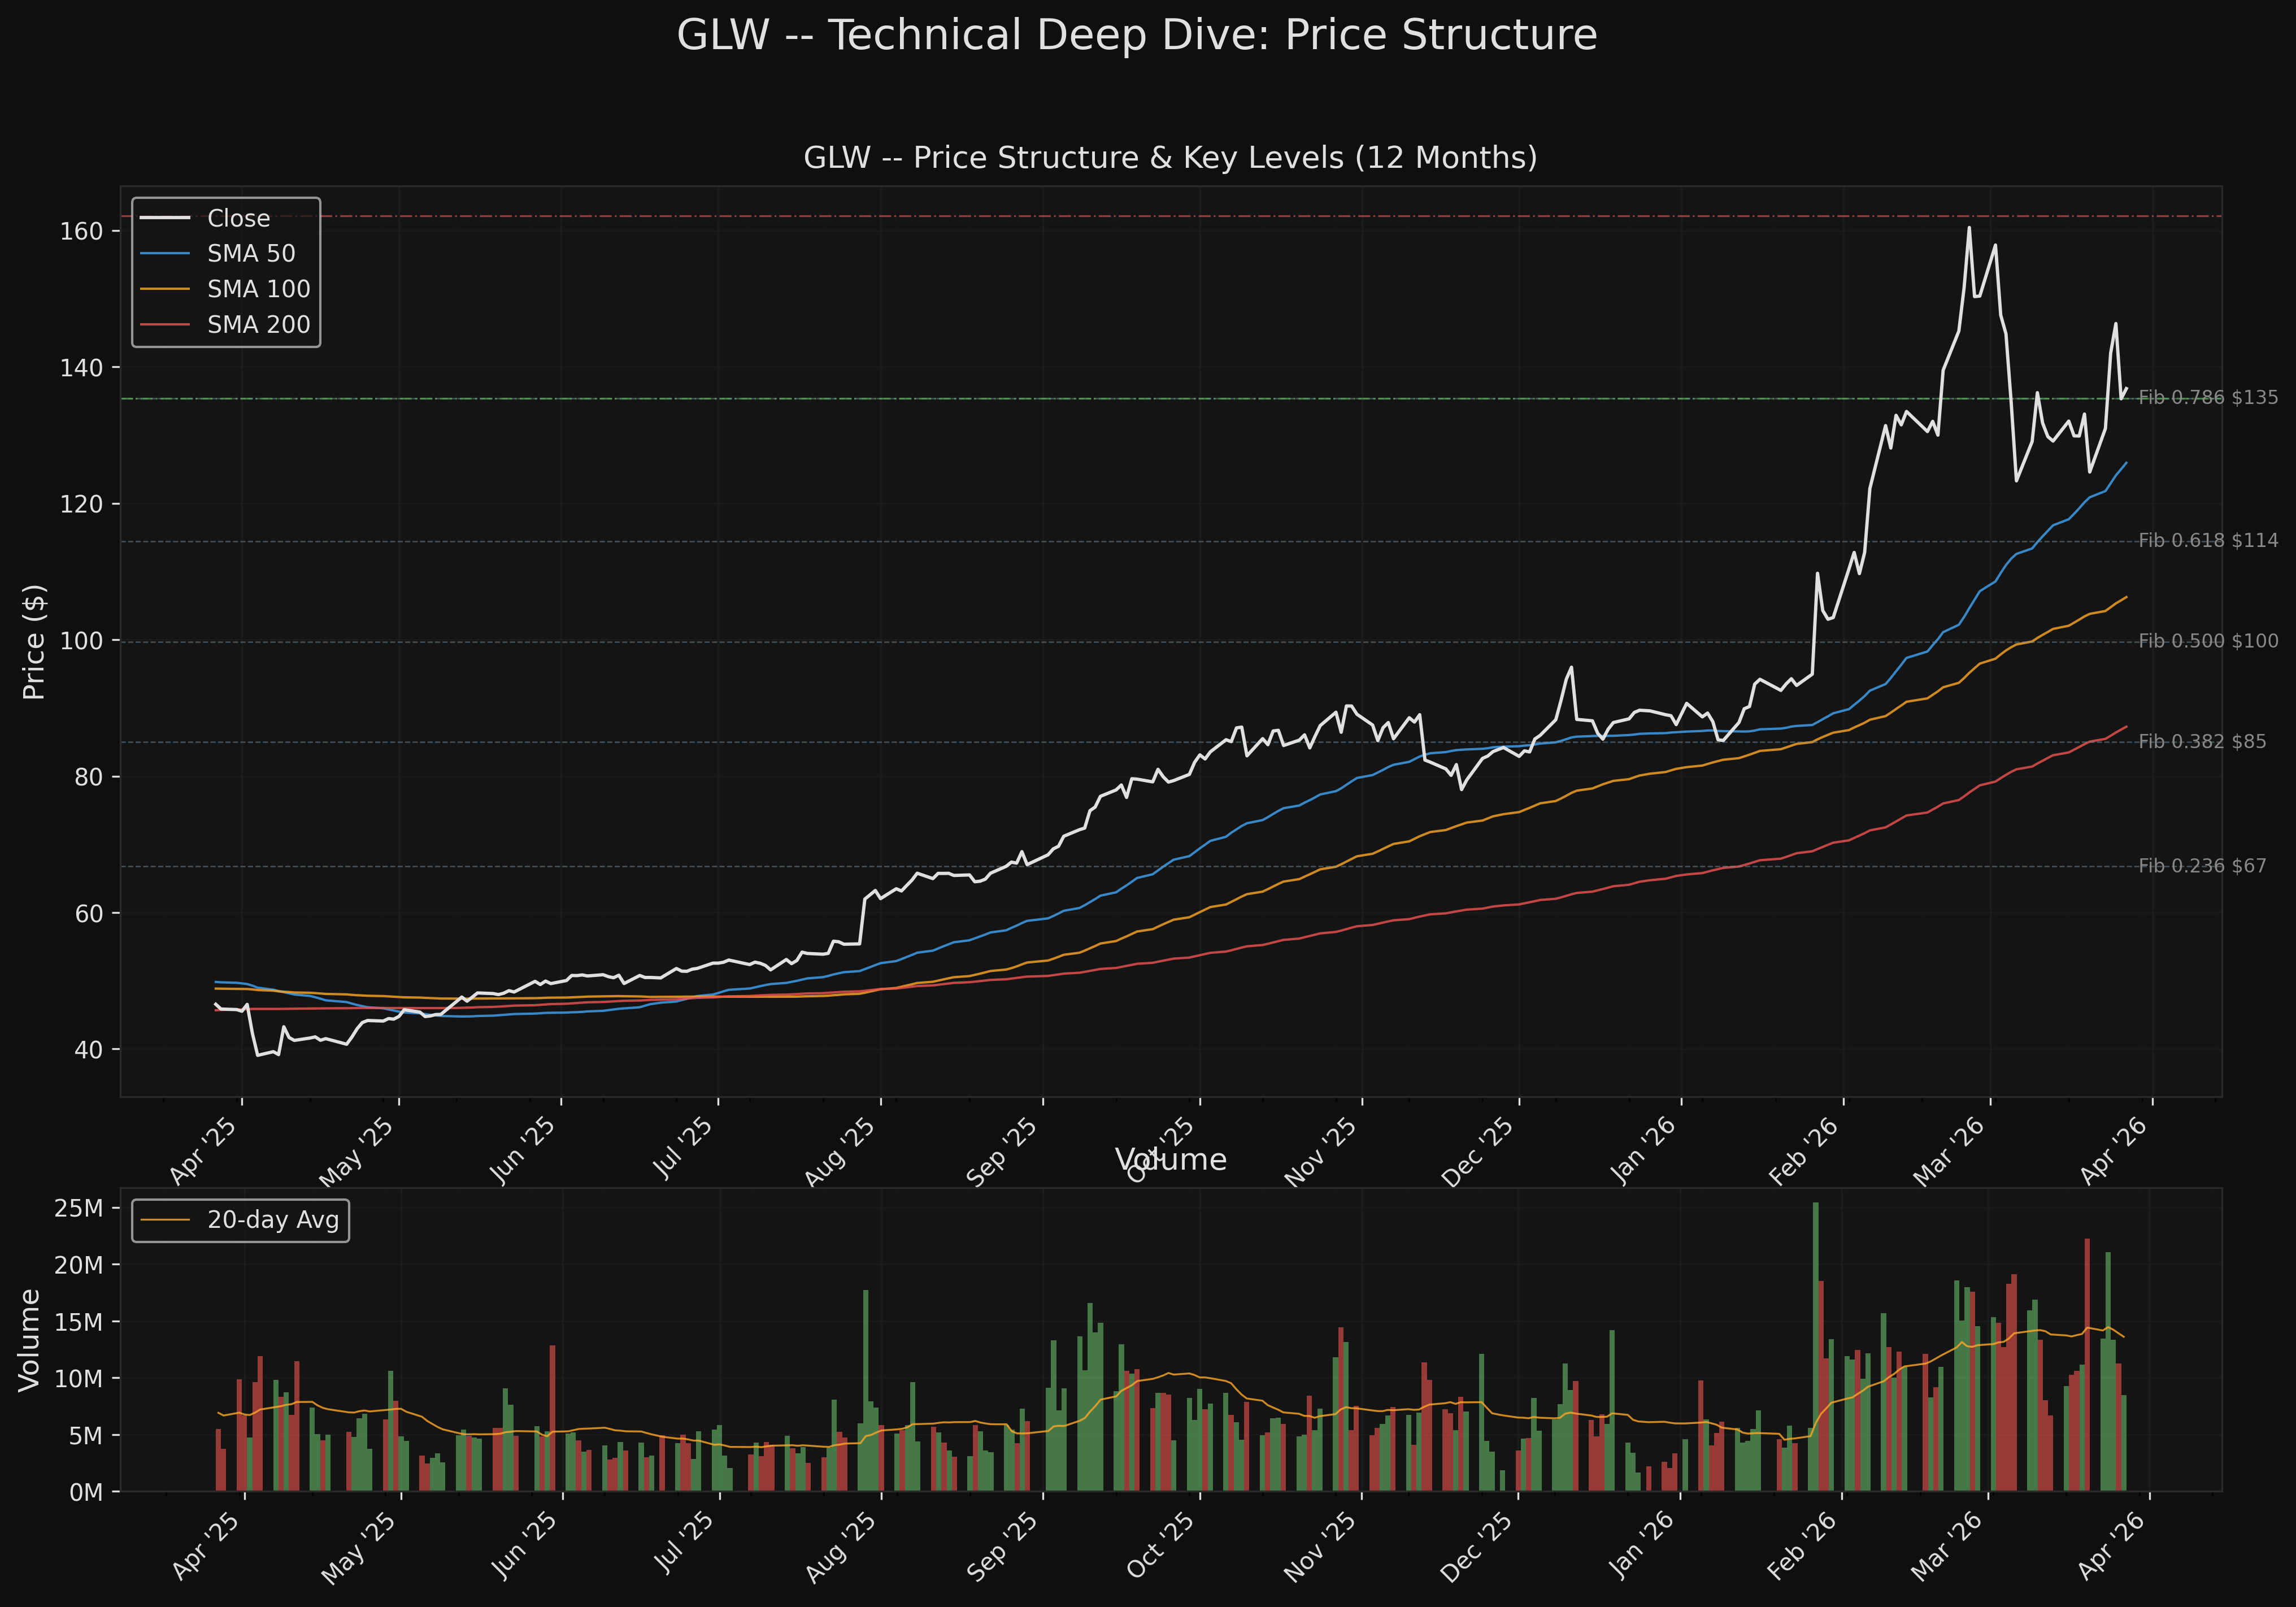 GLW price with 50/100/200 SMAs, Fibonacci retracement levels, and volume bars over the last 12 months. The January 27 earnings gap is clearly visible as the defining structural break, launching the stock from the $90s to a new regime above $100.
4. Market Structure
Wyckoff Phase Identification
GLW's market structure since the January 27 gap is best characterized as Phase C/D of a Markup -- the stock has moved sharply higher from a long accumulation base, experienced a sharp pullback (the March correction), and is now attempting to re-establish the uptrend.
Quantitative evidence:
| Pattern | Finding |
|---|---|
| Swing High Pattern | Higher Highs ($96.64 Dec 11 -> $162.10 Feb 25) |
| Swing Low Pattern | Higher Lows ($83.95 Jan 8 -> $91.01 Jan 23 -> $120.01 Mar 9 -> $123.90 Mar 19) |
| Gap Fill Test | Unfilled -- Jan 27 gap level at $94.95 never revisited (post-gap low $99.50) |
| Volume at Highs | Swing highs at 1.3-1.6x average volume -- institutional participation |
| Volume at Lows | Swing lows at 0.8-1.1x average volume -- selling on lighter volume |
The higher-lows sequence since January is the most important structural signal. Each pullback has been bought at a higher level: $84 -> $91 -> $120 -> $124. This pattern of rising support levels is the hallmark of an active markup phase.
The March correction tested but held the $120 level (0.618 Fibonacci area and round number support). The subsequent bounce to $150 and current consolidation at $137 maintains the higher-low structure. The key level to watch is $120 -- a break below would damage the markup thesis and suggest distribution.
Swing Point Analysis (Last 6 Months)
Swing Highs:
| Date | Price | Volume Ratio | Significance |
|---|---|---|---|
| 2025-12-11 | $96.64 | 1.28x | Pre-gap high |
| 2026-01-05 | $93.58 | 1.61x | Failed retest |
| 2026-02-25 | $162.10 | 1.41x | 52-week high |
| 2026-03-02 | $160.45 | 1.15x | Double-top attempt |
| 2026-03-25 | $150.25 | 1.00x | Bounce high |
Swing Lows:
| Date | Price | Volume Ratio | Significance |
|---|---|---|---|
| 2026-01-23 | $91.01 | 0.91x | Pre-gap support |
| 2026-03-09 | $120.01 | 1.13x | Correction bottom |
| 2026-03-19 | $123.90 | 0.81x | Higher low -- bullish |
The declining volume at the March 19 swing low ($123.90, 0.81x average) compared to the March 9 low ($120.01, 1.13x average) is constructive. Selling pressure diminished on the retest, which is characteristic of seller exhaustion in a markup phase.
5. Momentum Analysis
RSI (14-period)
| Metric | Value |
|---|---|
| Current RSI | 52.74 |
| 5-Day Ago | 44.90 |
| RSI Trend | Rising (+7.84 points over 5 days) |
| Zone | Neutral |
RSI at 52.7 is dead-center neutral, which is appropriate for a stock consolidating after a correction. The 5-day improvement from 44.9 to 52.7 shows momentum rebuilding from the oversold bounce. RSI has not reached overbought (>70) since the February run, and the neutral reading here gives room for a move in either direction without being extended.
MACD (12, 26, 9)
| Metric | Value |
|---|---|
| MACD Line | 2.1917 |
| Signal Line | 2.4054 |
| Histogram | -0.2137 |
| Last Cross | Bearish (2026-03-04) |
The MACD remains in positive territory (both line and signal above zero) but the MACD line is below the signal line, with a slightly negative histogram. This bearish crossover occurred on March 4, coinciding with the start of the correction. The histogram has been narrowing (becoming less negative), suggesting the bearish momentum is fading. A bullish cross of the MACD line above the signal line would confirm the next leg higher.
Stochastic (14, 3)
| Metric | Value |
|---|---|
| %K | 48.99 |
| %D | 62.24 |
| Signal | %K below %D -- still decelerating |
Stochastic is mid-range with %K below %D, indicating the short-term rate of change has not yet turned positive. This is consistent with a consolidation phase rather than an impulse move. A %K crossover above %D would provide a short-term buy signal.
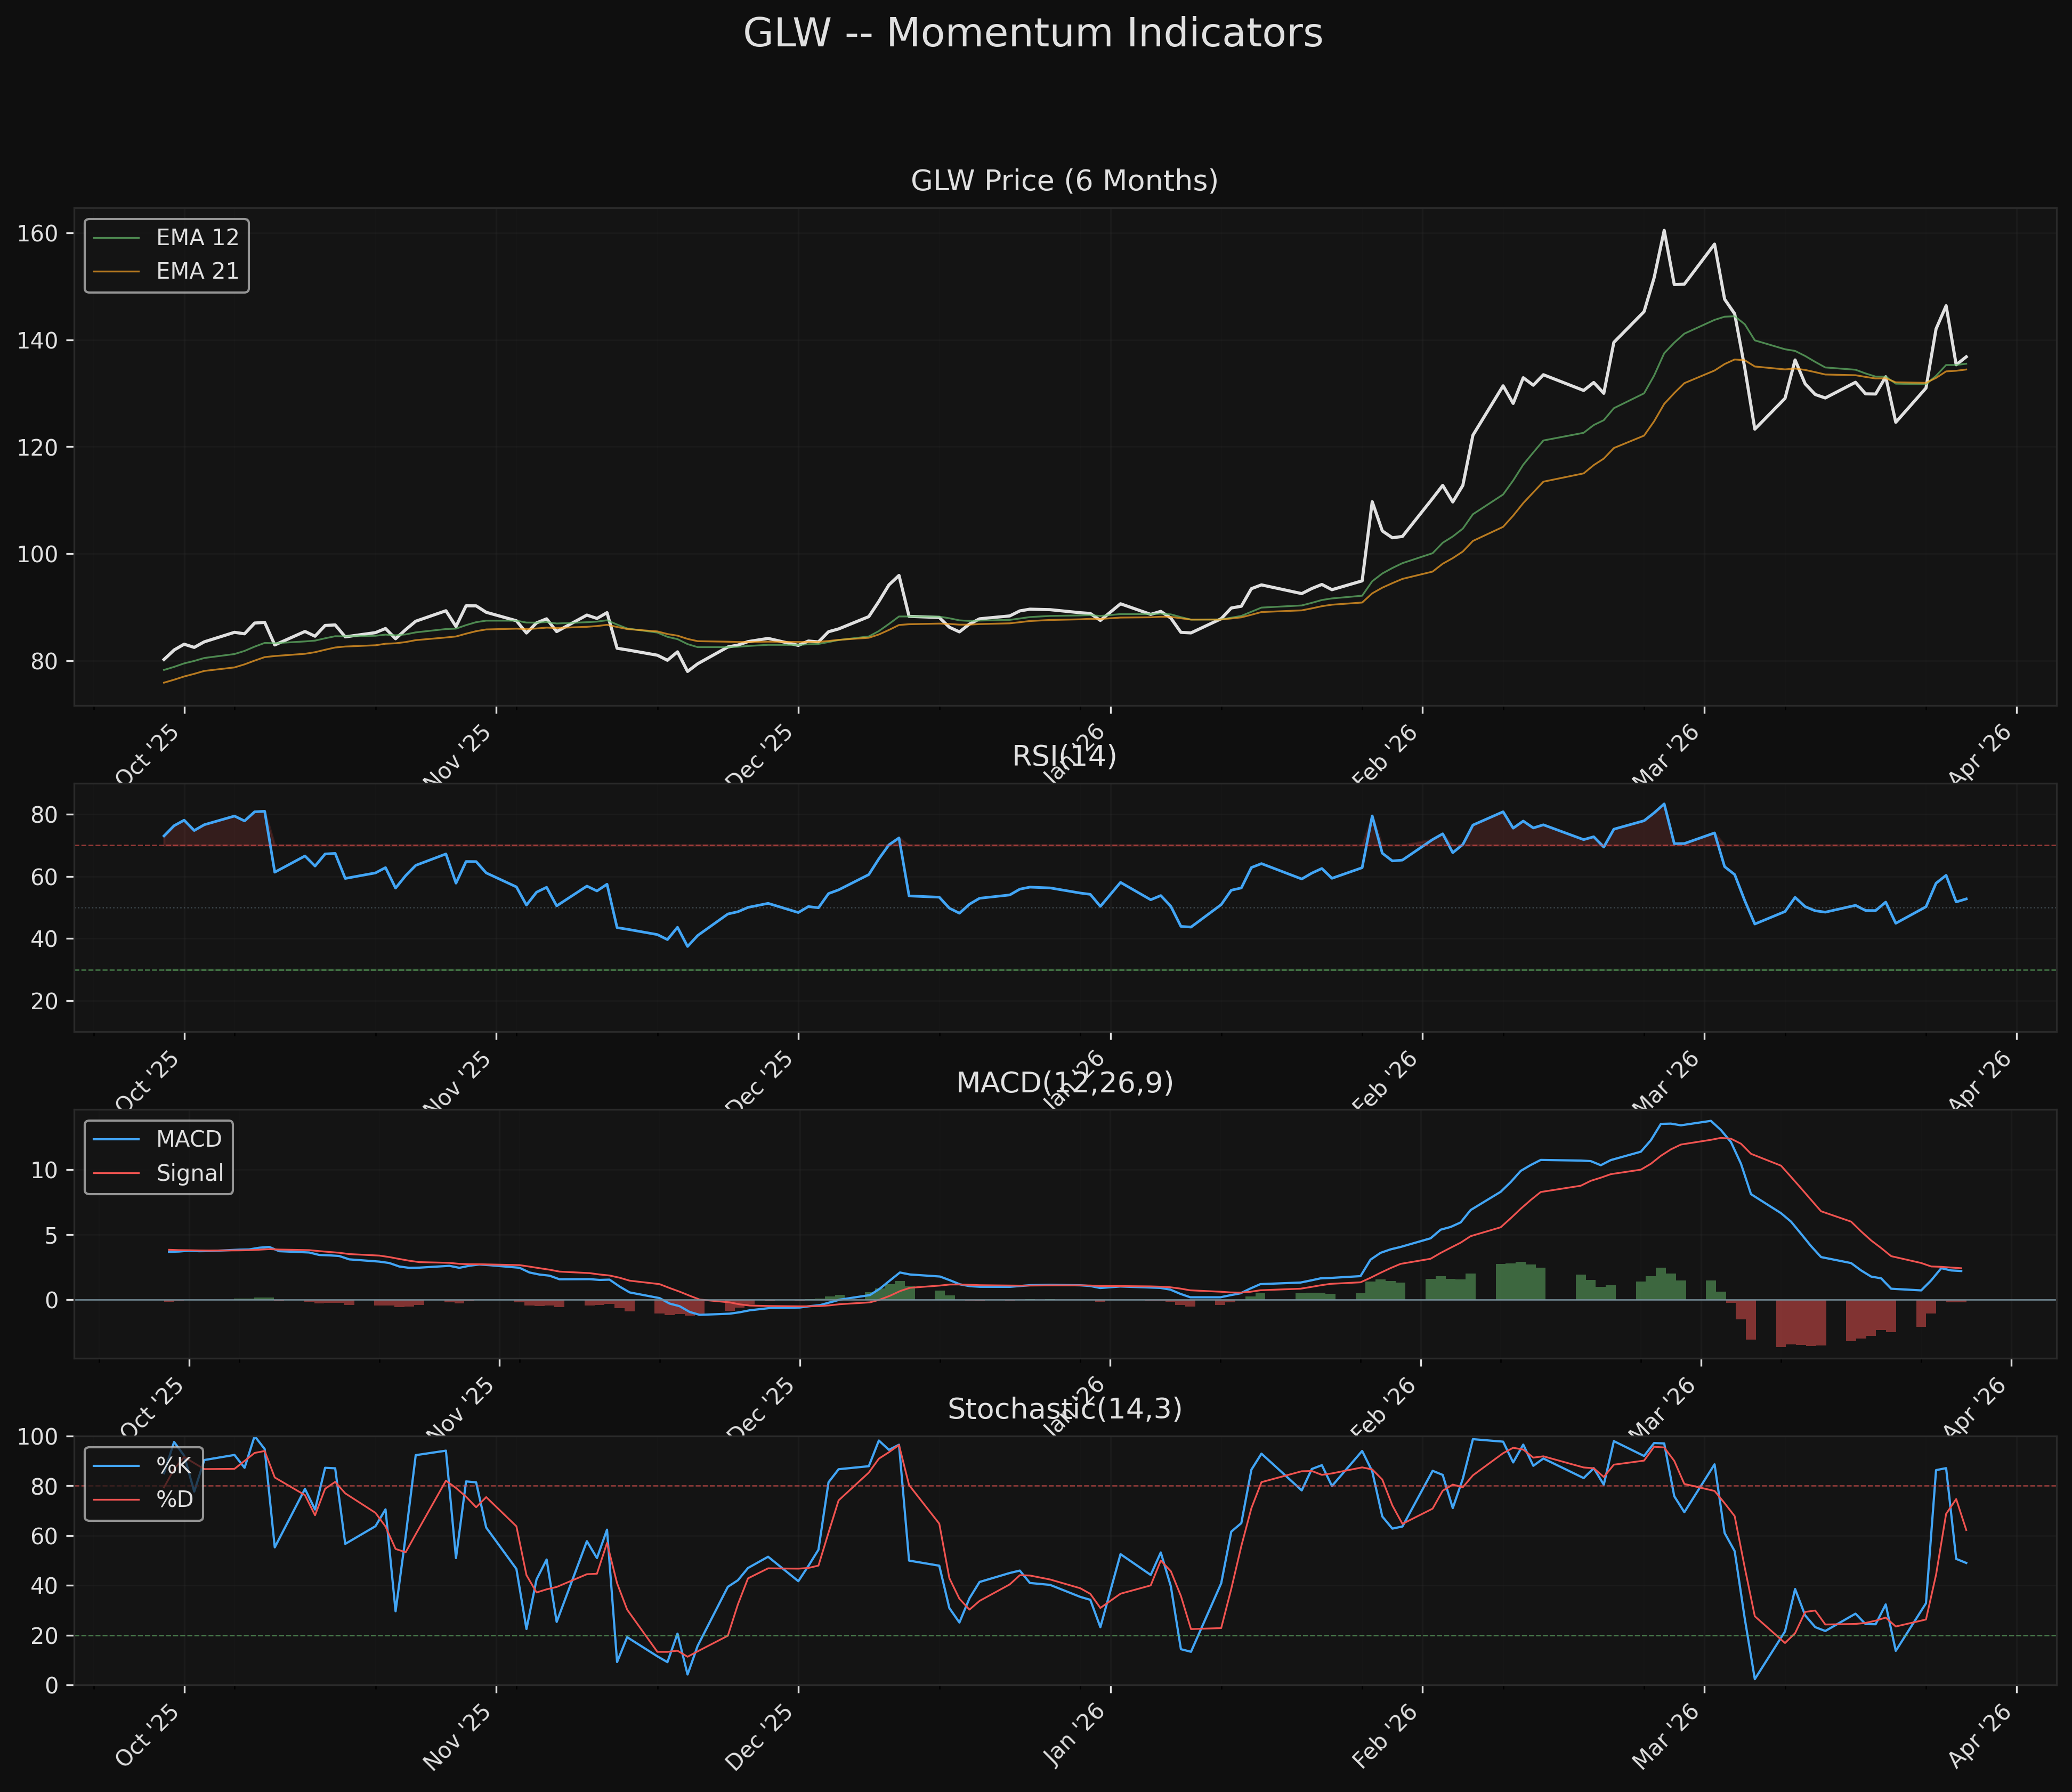 Four-panel momentum view: price with EMAs, RSI(14) recovering to neutral at 52.7, MACD histogram narrowing toward zero, and Stochastic %K at 49. All three oscillators are neutral, giving the stock room to move higher without being overbought.
6. Moving Average Analysis
Current MA Positioning
| Moving Average | Value | Price vs MA | 5-Day Slope |
|---|---|---|---|
| SMA 10 | $134.09 | +2.03% above | +2.72% |
| SMA 20 | $135.26 | +1.15% above | -2.40% |
| SMA 50 | $125.94 | +8.63% above | +4.18% |
| SMA 100 | $106.25 | +28.76% above | +2.37% |
| SMA 200 | $87.25 | +56.80% above | +2.57% |
| EMA 12 | $135.52 | +0.96% above | +2.82% |
| EMA 21 | $134.44 | +1.76% above | +1.81% |
| EMA 50 | $125.72 | +8.82% above | +2.27% |
Key Observations
EMA Stack: Bullish (12 > 21 > 50). This is the ideal trend-following configuration, with shorter-term averages above longer-term averages and all rising.
MA Slopes: All moving averages except the SMA 20 have positive 5-day slopes. The SMA 20 slope of -2.40% reflects the recent pullback from $150, but it remains above the SMA 50. The SMA 50 has the steepest positive slope (+4.18%), reflecting the powerful 3-month trend.
Price Proximity: The current price at $136.81 is sandwiched between the SMA 10/20/EMA 12/21 cluster ($134-136) and the March 25 bounce high at $150. The tight MA cluster provides immediate dynamic support. The wide gap between the SMA 50 ($126) and the SMA 20 ($135) reflects the recent volatility compression -- this gap should narrow as the stock consolidates.
No Death Cross Risk: The SMA 50 ($126) is well above the SMA 200 ($87), and both are rising. The golden cross occurred long ago and there is no near-term risk of a bearish cross.
7. Volume Analysis
Current Volume Metrics
| Metric | Value |
|---|---|
| Latest Volume | 8,489,682 |
| 20-Day Avg | 13,608,708 |
| 50-Day Avg | 12,437,435 |
| Volume Ratio (20d) | 0.62x |
| Up/Down Volume (20d) | 0.85 |
| Accumulation Days (20d) | 0 |
| Distribution Days (20d) | 1 |
| OBV Trend (20d) | Falling |
| A/D Line Trend (20d) | Falling |
Volume Profile by Price Zone (Since Jan 27)
| Zone | Bars | Avg Volume |
|---|---|---|
| $100-$120 | 8 | 14,370,309 |
| $120-$140 | 25 | 12,371,051 |
| $140-$160 | 9 | 15,886,127 |
Interpretation
Volume is the weakest component of the GLW technical picture. The up/down volume ratio of 0.85 means sellers have had more volume behind their moves than buyers over the last 20 sessions. OBV and the A/D line are both falling, and there have been zero accumulation days (>1.5x avg volume on up days) in the last 20 sessions, versus 1 distribution day.
However, context matters. The volume profile by price zone shows that the heaviest trading volume occurred in the $140-$160 zone (15.9M avg) and the $100-$120 zone (14.4M avg), with lighter volume in the current $120-$140 zone (12.4M avg). This suggests the correction from $160 to $120 attracted heavy volume (panic selling and institutional rotation), while the current consolidation at $137 is occurring on declining volume. Low-volume consolidation after a high-volume selloff is often a constructive pattern -- it suggests sellers are exhausting themselves rather than that buyers are absent.
The Jan 27 earnings gap was accompanied by 25.4M shares (4.2x the 20-day average), which is institutional-grade volume. This type of volume event typically sets the tone for months of subsequent price action. The fact that the gap has never been filled (post-gap low was $99.50 vs. gap level of $94.95) confirms the institutional buyers who drove the gap have not been proven wrong.
High-volume surge days (>2% gain, >1.5x avg vol) in last 2 months: - 2026-02-09: +7.56%, vol ratio 1.62x
Only one true accumulation surge day in the last 2 months, which is below what would be ideal for a bull case. The March 24 bounce (+14.0%) was on heavy volume (21.1M) but that was a single-day snap-back, not sustained buying.
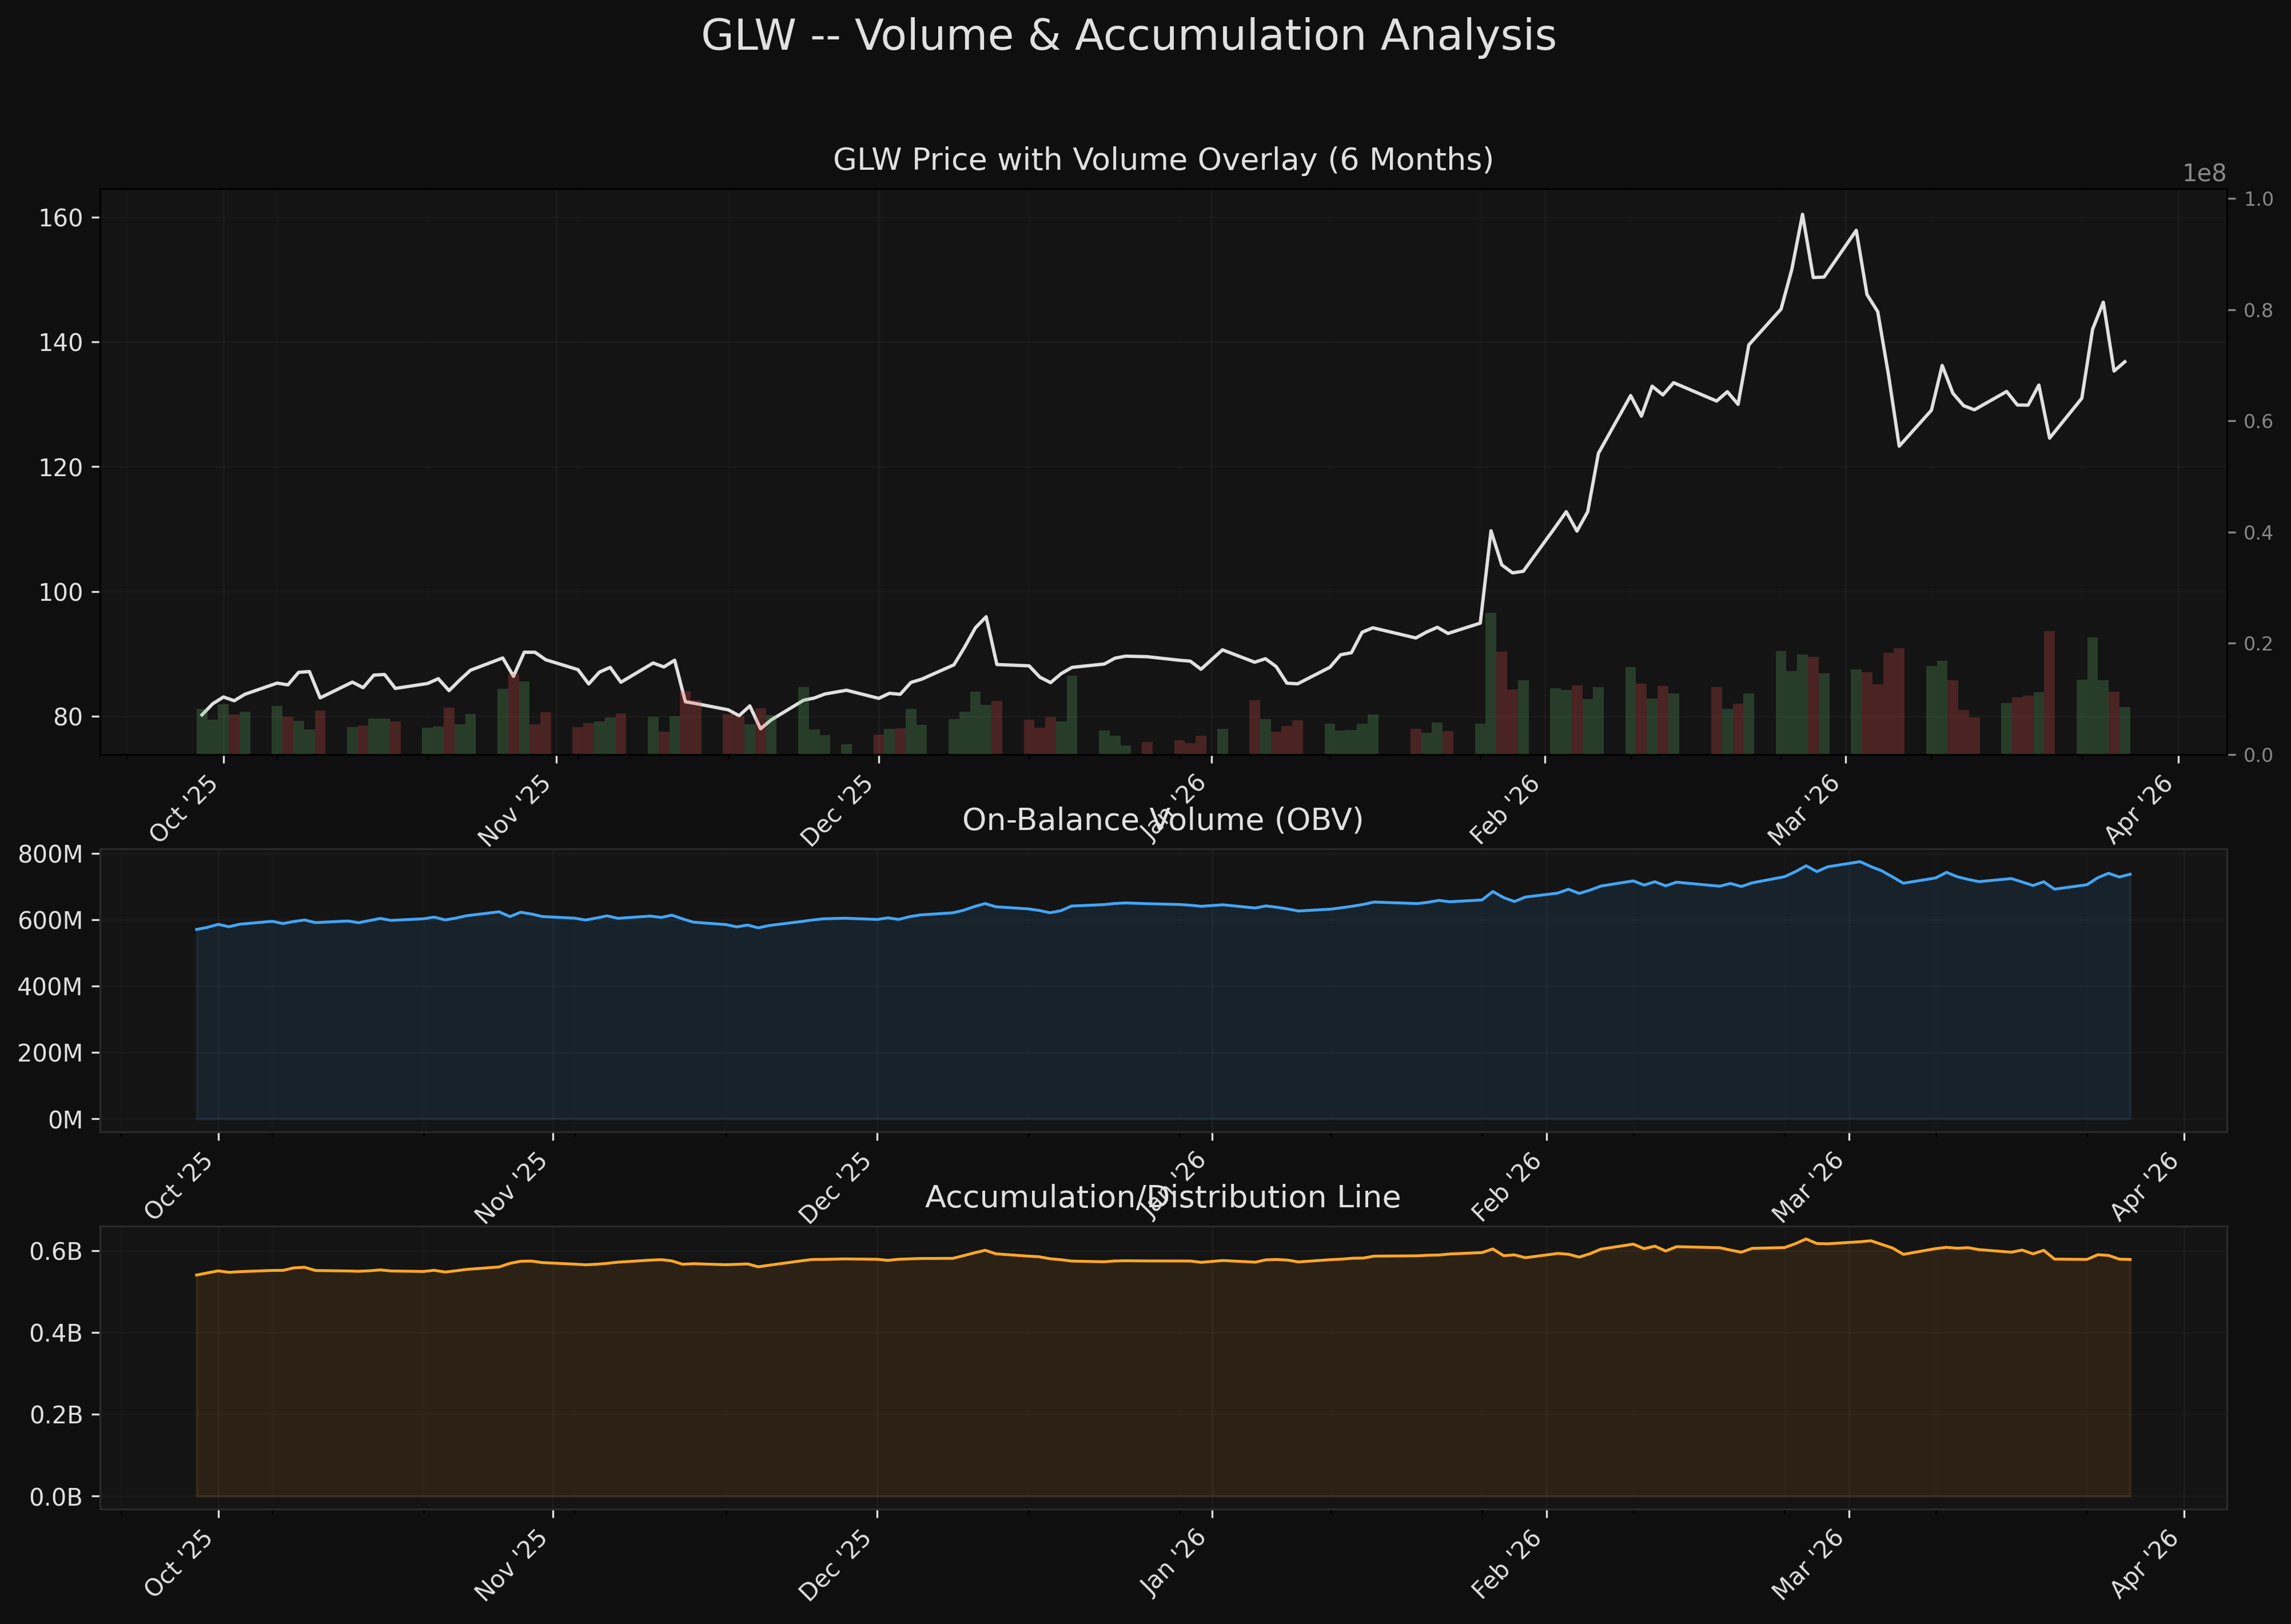 Volume with OBV and A/D line over 6 months. The January 27 volume spike is visible at center-left. Both OBV and A/D line peaked around the Feb 25 high and have been declining during the correction, consistent with distribution pressure.
8. Volatility Profile
Current Volatility Metrics
| Metric | Value | Context |
|---|---|---|
| ATR(14) | $8.53 | 6.24% of price |
| 20-Day HV (Ann.) | 79.33% | Well above typical equity HV of 20-30% |
| Bollinger Width | 25.33% | 71.8th percentile (1-year) |
| Bollinger %B | 0.5453 | Mid-band -- neutral positioning |
| ATR Trend (20d) | Expanding | Was 5.24%, now 6.24% |
Return Distribution (Last 12 Months)
| Statistic | Value |
|---|---|
| Mean Daily Return | +0.467% |
| Std Dev | 2.943% |
| Skewness | +0.457 |
| Kurtosis | 4.828 |
Interpretation
GLW's volatility profile is extreme for a large-cap equity. An ATR of 6.24% means the average daily range is $8.53 -- roughly $8.50 of movement per day on a $137 stock. For comparison, a typical S&P 500 component has ATR of 1.5-3.0% of price. GLW trades like a mid-cap tech stock or a moderately volatile cryptocurrency.
The positive skewness (+0.46) is mildly constructive -- it means the distribution of returns leans toward larger up-days than down-days, which is consistent with a stock in a markup phase. However, the excess kurtosis of 4.8 indicates fat tails -- extreme moves (both directions) occur far more often than a normal distribution would predict. The 15.6% single-day gap on January 27 is a prime example.
The Bollinger %B at 0.55 places the price roughly at the midpoint of the bands, which is neutral. After spending most of early March pressed against the lower band (during the selloff), the recovery to mid-band is healthy. The Bollinger Width at the 71.8th percentile is elevated but not extreme -- the bands are wide because of the recent volatility but have not reached peak expansion.
Position sizing implication: At 6.24% ATR, a traditional 1-ATR stop would represent a $8.53 loss per share. To risk 1% of a $100,000 portfolio ($1,000) with a 1-ATR stop, the maximum position size would be ~117 shares (~$16,000 or 16% of portfolio). This volatility demands conservative sizing.
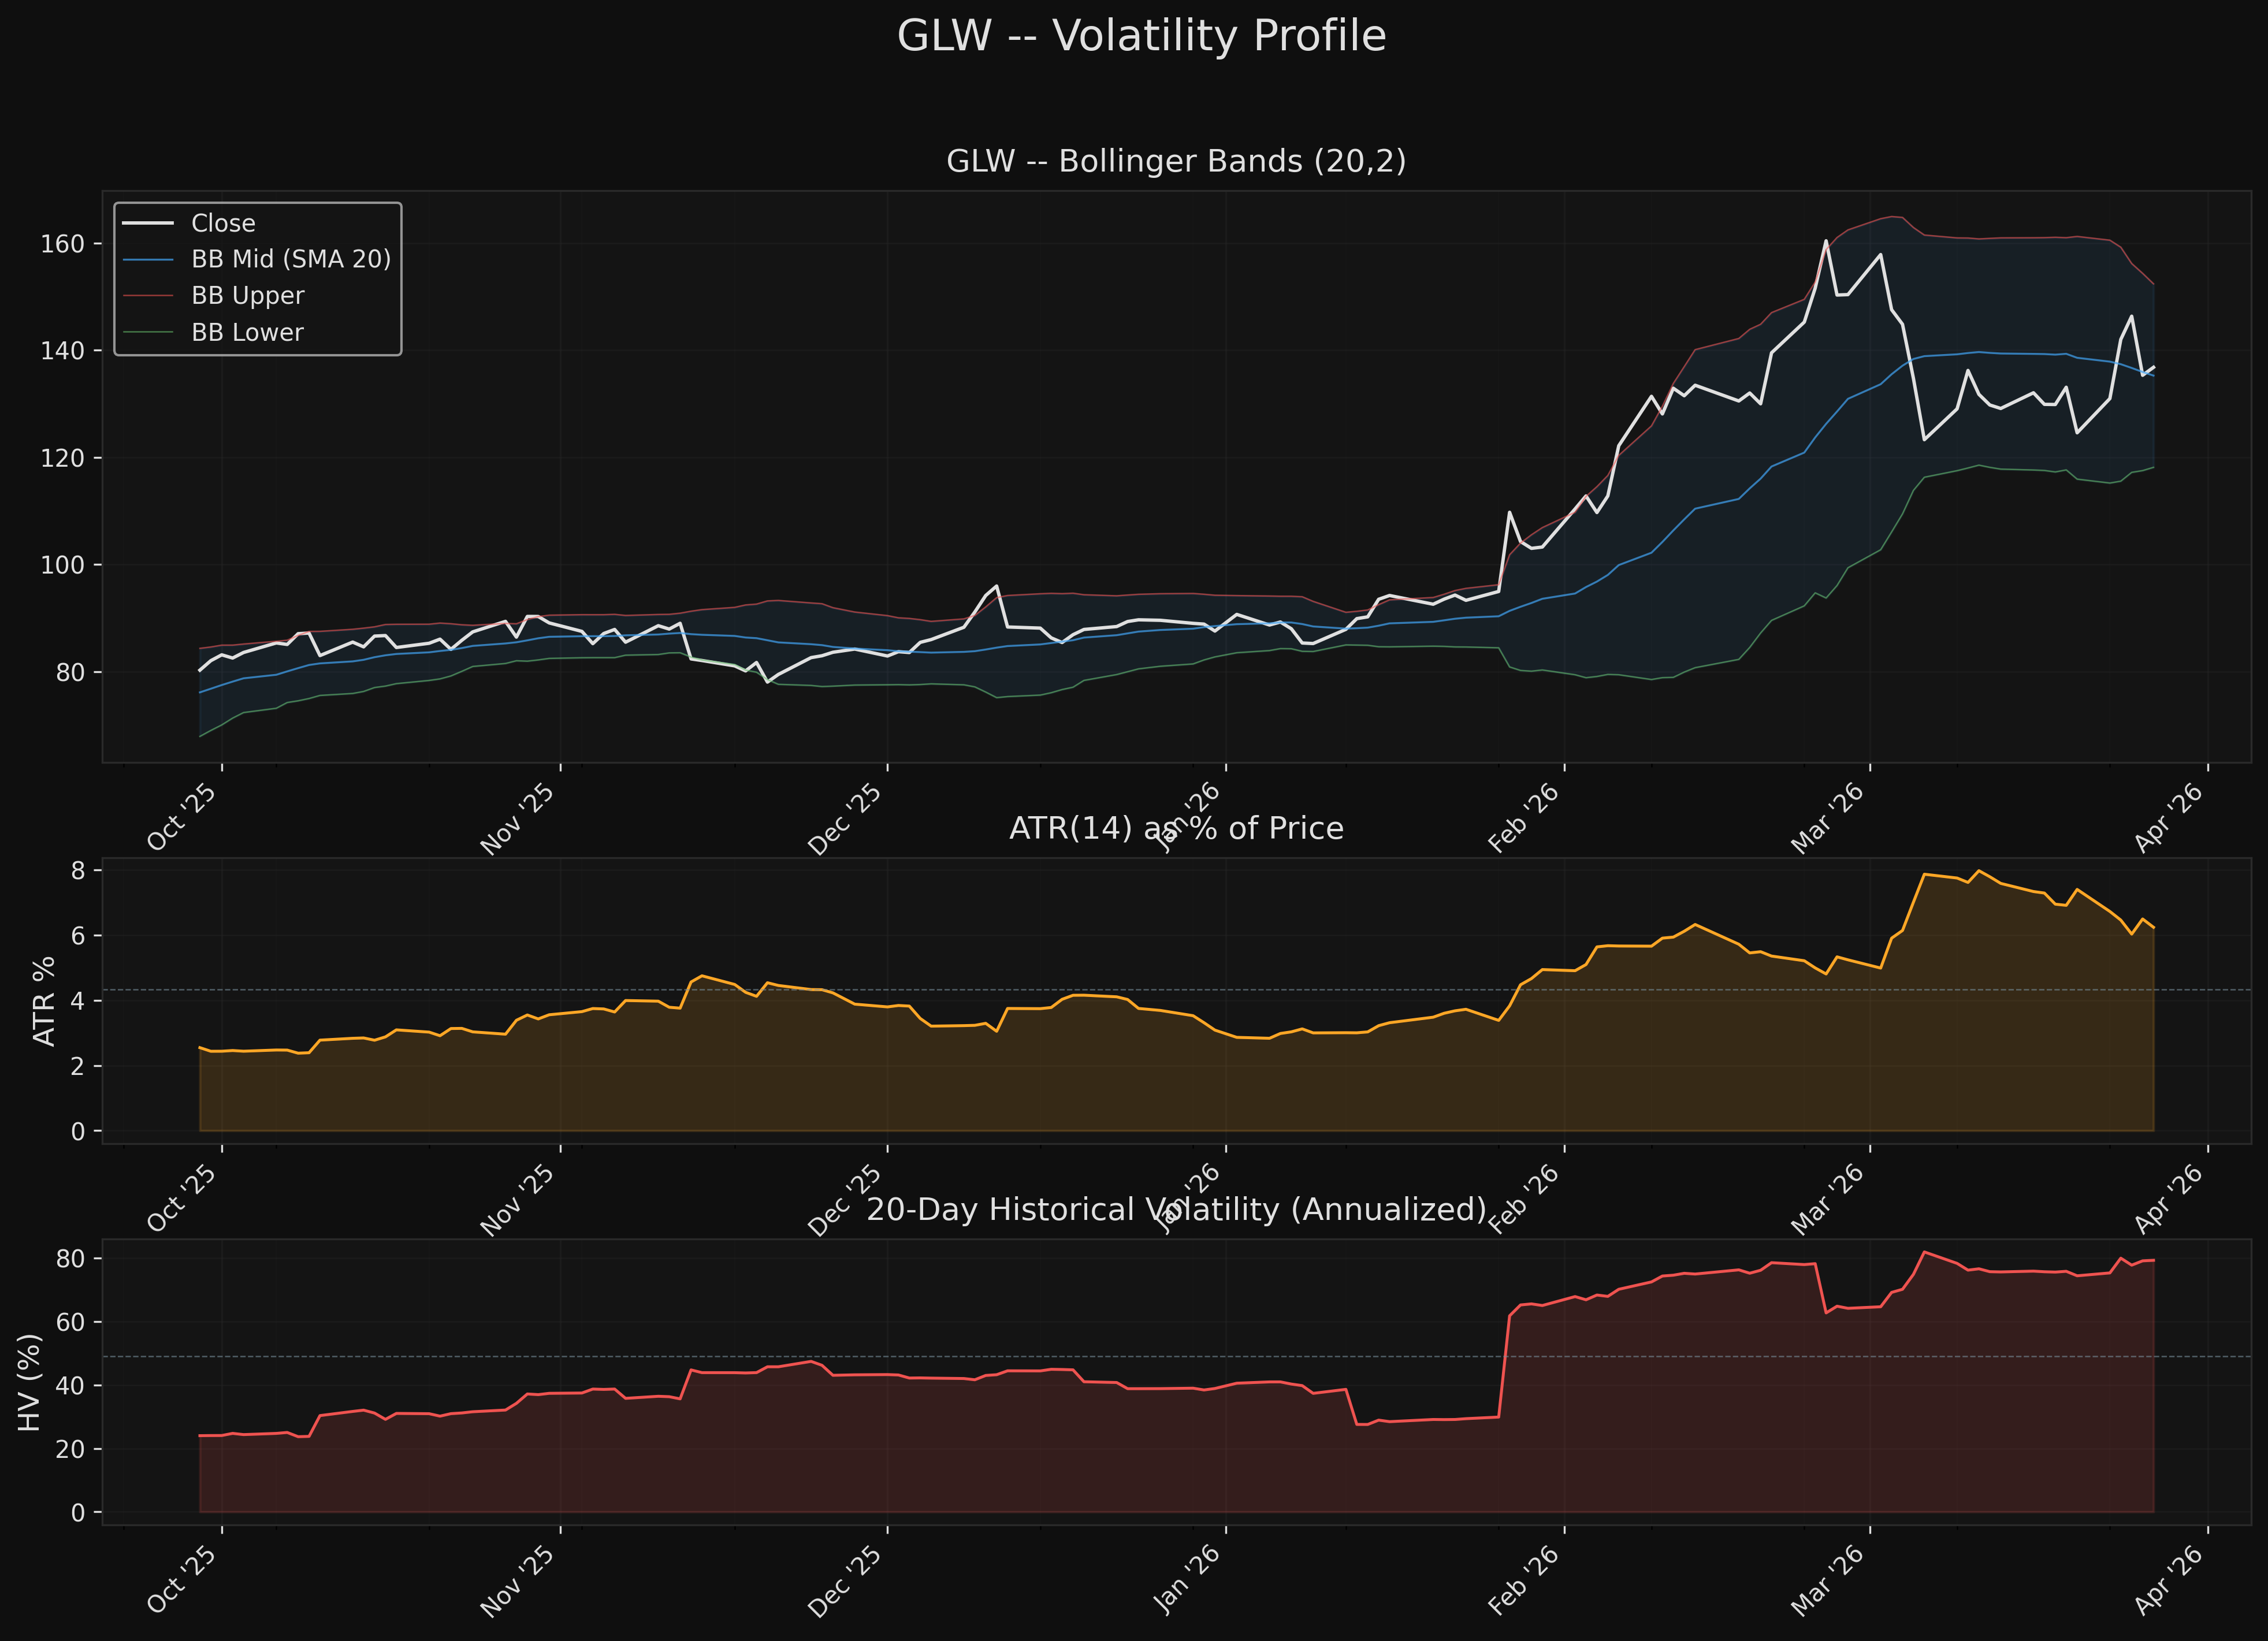 Bollinger Bands, ATR as % of price, and 20-day historical volatility. ATR has been expanding from 5.2% to 6.2% over the last 20 days, and HV remains near 80% annualized -- roughly 3x the level of a typical large-cap equity.
9. Entry Point Assessment
Zone 1: Pullback to MA Cluster (~$134-$136)
| Parameter | Value |
|---|---|
| Entry Range | $134.00 - $136.00 |
| Rationale | EMA 12 ($135.52), EMA 21 ($134.44), SMA 10 ($134.09) cluster |
| Stop Loss | $125.00 (below SMA 50 and EMA 50) |
| Target 1 | $150.25 (March 25 bounce high) |
| Target 2 | $162.10 (52-week high) |
| R:R to Target 1 | ~1.5:1 ($14 upside / $10 risk) |
| R:R to Target 2 | ~2.6:1 ($27 upside / $10 risk) |
| Confluence | 4 MAs + Fib 0.786 ($135.39) in tight cluster |
This is the highest-probability entry zone because multiple technical levels converge within a $2 range. The risk is that the stock is currently at $136.81 -- already inside this zone -- so there may not be a pullback opportunity. A limit order at $134-$135 on any intraday weakness would capture the zone.
Zone 2: Deep Pullback to SMA 50 (~$125-$126)
| Parameter | Value |
|---|---|
| Entry Range | $124.00 - $126.00 |
| Rationale | SMA 50 ($125.94), EMA 50 ($125.72), March 19 swing low area |
| Stop Loss | $119.00 (below March 9 swing low of $120.01) |
| Target 1 | $150.25 |
| Target 2 | $162.10 |
| R:R to Target 1 | ~3.6:1 ($25 upside / $7 risk) |
| R:R to Target 2 | ~5.4:1 ($37 upside / $7 risk) |
| Confluence | SMA 50 + EMA 50 + round number $125 |
This is the higher-reward zone but requires a meaningful pullback (8-9% decline from current levels). Given GLW's recent pattern of 15-25% corrections, this level could be reached during the next broad market selloff. The R:R is excellent here, and the stop at $119 is below a well-defined structural level.
Zone 3: Breakout Above $150 (Aggressive)
| Parameter | Value |
|---|---|
| Entry Trigger | Close above $150.25 on above-average volume |
| Rationale | March 25 bounce high, VWAP of $140-$162 zone |
| Stop Loss | $140.00 (below recent consolidation) |
| Target | $162.10 (52-week high) |
| R:R | ~1.2:1 ($12 upside / $10 risk) |
The breakout entry has the weakest R:R because the stop needs to be wide enough to survive GLW's volatility. This is only attractive if the volume confirmation is strong (>1.5x average) and momentum indicators have turned bullish (MACD cross + RSI >55).
10. Risk/Reward Framework
Scenario 1: Bullish -- Trend Resumes to New Highs
Trigger: MACD bullish crossover + RSI sustains above 55 + volume returns to 12M+ daily average.
| Parameter | Value |
|---|---|
| Entry | $136.81 (current) |
| Stop Loss | $125.00 (below SMA 50 cluster) |
| Target 1 | $150.25 (March 25 high) |
| Target 2 | $162.10 (52-week high) |
| Target 3 | $175.00 (measured move from correction) |
| Risk | $11.81 (8.6%) |
| Reward (T1) | $13.44 (9.8%) |
| Reward (T2) | $25.29 (18.5%) |
| R:R (T1) | 1.14:1 |
| R:R (T2) | 2.14:1 |
| Probability Est. | 45% |
The bullish case requires volume confirmation. Without it, the price can drift higher on the trend alone, but the risk of another sharp pullback remains elevated.
Scenario 2: Neutral -- Range Consolidation ($120-$150)
Trigger: RSI oscillates between 40-60, no clear MACD direction, volume stays below average.
| Parameter | Value |
|---|---|
| Expected Range | $120 - $150 |
| Duration | 4-8 weeks |
| Implication | Wait for breakout direction; set alerts at $120 and $150 |
This is actually the base case given current conditions. The stock has rallied sharply, corrected sharply, bounced, and is now digesting. A 4-8 week period of range-bound action between $120-$150 would be healthy, allowing the 50 SMA to catch up to price and volatility to compress.
Scenario 3: Bearish -- Correction Extends Below March Lows
Trigger: Break below $120 on expanding volume, SMA 50 rolls over, EMA stack breaks down.
| Parameter | Value |
|---|---|
| Trigger Level | Close below $120.00 |
| Next Support | $114.43 (Fib 0.618) |
| Deep Support | $99.70 (Fib 0.500 / gap fill area) |
| Risk from Current | $16.81 (12.3%) to gap fill |
| Probability Est. | 20% |
The bearish case would require either a deterioration of the AI-infrastructure thesis (negative earnings revision, sector rotation) or a broad market selloff that overwhelms GLW's relative strength. The January gap fill at ~$95 is the worst-case scenario -- a return there would mean the entire post-gap move has been unwound.
11. Key Levels Summary
| Level | Price | Type | Significance |
|---|---|---|---|
| 52-Week High | $162.10 | Resistance | Feb 25 peak; major overhead supply |
| March 2 High | $160.45 | Resistance | Confirmed the $162 ceiling |
| VWAP Upper Zone | $149.60 | Resistance | Volume-weighted avg of $140-$162 trading |
| March 25 High | $150.25 | Resistance | Most recent bounce high |
| Fib 0.786 | $135.39 | Support/Resistance | Near current price -- active pivot |
| Current Price | $136.81 | -- | -- |
| EMA 12 | $135.52 | Support | Immediate dynamic support |
| EMA 21 | $134.44 | Support | Short-term trend support |
| SMA 50 / EMA 50 | $125.72-$125.94 | Support | Key trend-defining level |
| March 19 Swing Low | $123.90 | Support | Higher low in structure |
| March 9 Swing Low | $120.01 | Support | Correction bottom |
| Fib 0.618 | $114.43 | Support | Deep correction target |
| SMA 100 | $106.25 | Support | Intermediate trend |
| Gap Fill Level | $94.95 | Support | Jan 27 pre-gap close; bull/bear line |
| SMA 200 | $87.25 | Support | Long-term trend |
12. Overall Technical Score
Weighted Composite Breakdown
| Component | Score | Weight | Contribution | Rationale |
|---|---|---|---|---|
| Trend Alignment | 10.0/10 | 25% | 2.50 | Above all MAs; all MAs rising; bullish EMA stack (12>21>50) |
| Momentum | 7.5/10 | 20% | 1.50 | RSI neutral at 52.7, rising; MACD positive but below signal; Stochastic mid-range |
| Volume Confirmation | 4.5/10 | 20% | 0.90 | OBV/AD falling; up/down ratio 0.85; zero accumulation days; sellers slightly dominant |
| Volatility Profile | 2.5/10 | 15% | 0.38 | ATR 6.24%, HV 79%; extremely elevated for a large-cap equity |
| Market Structure | 9.0/10 | 20% | 1.80 | HH/HL pattern; unfilled gap; higher-low sequence intact; strong RS vs SPY |
| OVERALL | 7.1/10 | 100% | 7.08 |
Bias: Bullish -- The trend structure and relative strength are dominant positives. The volume weakness and extreme volatility are meaningful negatives that prevent this from being a high-conviction setup. The stock has the potential for significant further upside but requires careful risk management due to the volatility regime.
13. Limitations
-
Extreme volatility distorts all oscillators. When a stock has 6%+ daily ATR, traditional RSI/MACD signals fire more frequently and with less reliability. The momentum readings should be interpreted as directional guides, not precise timing tools.
-
Post-rerate sample size. GLW has only been trading in its new regime ($100+) since January 27, roughly 43 trading days. All support/resistance levels above $100 have been tested 0-2 times. The March 9 low of $120 is a single data point -- it has not been retested. Statistical reliability of these levels is limited.
-
Gap dynamics. The January 27 gap created a discontinuous price structure. Traditional Fibonacci retracement from the 52-week low ($37.31) produces levels like $66.76 and $84.98 that are irrelevant to the current trading regime. The 0.786 level ($135.39) happens to coincide with current price only because the 52-week range is so extreme.
-
Volume data quality. The TV export data shows daily volumes that may differ slightly from exchange-reported figures due to pre/post-market inclusion or exclusion. Volume ratios and accumulation/distribution counts are directionally reliable but not exact.
-
SPY comparison window. The SPY data used for relative strength analysis (from main ohlcv file) extends through 2026-03-27 but uses a different source than the GLW TV export. Minor price discrepancies between sources do not affect the directional conclusions but may cause <=0.1% variance in exact relative performance figures.
-
No fundamental overlay. This analysis is purely technical. GLW's fundamental rerate from specialty glass to AI-infrastructure play (fiber optics, data center substrates) is driving the price action but is not quantified here. A deterioration of the AI capex theme would invalidate the technical setup regardless of chart patterns.
14. Relative Strength vs SPY
Performance Comparison
| Window | GLW | SPY | GLW Excess |
|---|---|---|---|
| 5 days | +9.82% | -2.23% | +12.05% |
| 10 days | +5.96% | -4.00% | +9.95% |
| 21 days | -8.98% | -7.76% | -1.22% |
| 63 days (3m) | +52.59% | -7.90% | +60.49% |
| Since Feb 19 (SPY peak) | +5.25% | -7.11% | +12.36% |
Relative Strength Ratio Analysis
The GLW/SPY ratio currently stands at 0.2158, which is at the 93.6th percentile of its 6-month range. The 6-month high of 0.2321 was reached on February 25 (the same day as GLW's 52-week price high). Despite the March correction pulling the ratio off its peak, it remains near the top of its range -- confirming that GLW has retained most of its relative strength gains even during the broader market weakness.
The ratio's 20-day trend is technically "deteriorating" (0.2158 vs. 0.2198 twenty days ago), but this is a minor pullback within a dominant uptrend. The GLW/SPY ratio has been above its 50-day SMA for the entire post-gap period, and the 20-day SMA remains above the 50-day SMA -- a bullish relative strength regime.
Correlation and Beta
| Metric | Value |
|---|---|
| 1-Year Beta | 1.347 |
| 1-Year Correlation | 0.546 |
| 20-Day Rolling Correlation | 0.557 |
| 60-Day Rolling Correlation | 0.497 |
The moderate correlation (0.55) and high beta (1.35) tell an important story. GLW moves in the same direction as SPY about 55% of the time, but when it does move with the market, it moves 35% more. However, this beta is somewhat misleading because it was calculated over a period that includes the January gap -- a GLW-specific event that inflated the beta estimate. The practical implication is that GLW has meaningful independent movement (driven by its AI-infrastructure narrative) but is not immune to broad market selloffs.
The Relative Strength Case for GLW
The user's thesis -- that GLW shows relative strength during SPY declines -- is strongly supported by the data. Since the approximate SPY peak around February 19:
- SPY has declined 7.1%
- GLW has gained 5.3%
- That is a 12.4 percentage point spread in GLW's favor
Over 3 months, the spread widens to 60.5 percentage points -- an extraordinary divergence. GLW has not only outperformed during the SPY decline; it has moved in the opposite direction on several key down days, suggesting a genuine decoupling from the broad market rather than just lower-beta defensiveness.
The March 24 session provides a telling example: SPY declined modestly while GLW surged 14% on 21M shares -- the kind of sector-specific buying pressure that indicates institutional rotation into the name regardless of market direction.
This relative strength profile is consistent with the "AI buildout" thesis. When investors are selling the broad market but maintaining or increasing positions in AI-infrastructure names, it creates the exact pattern visible in the GLW/SPY ratio: a rising ratio during a market decline.
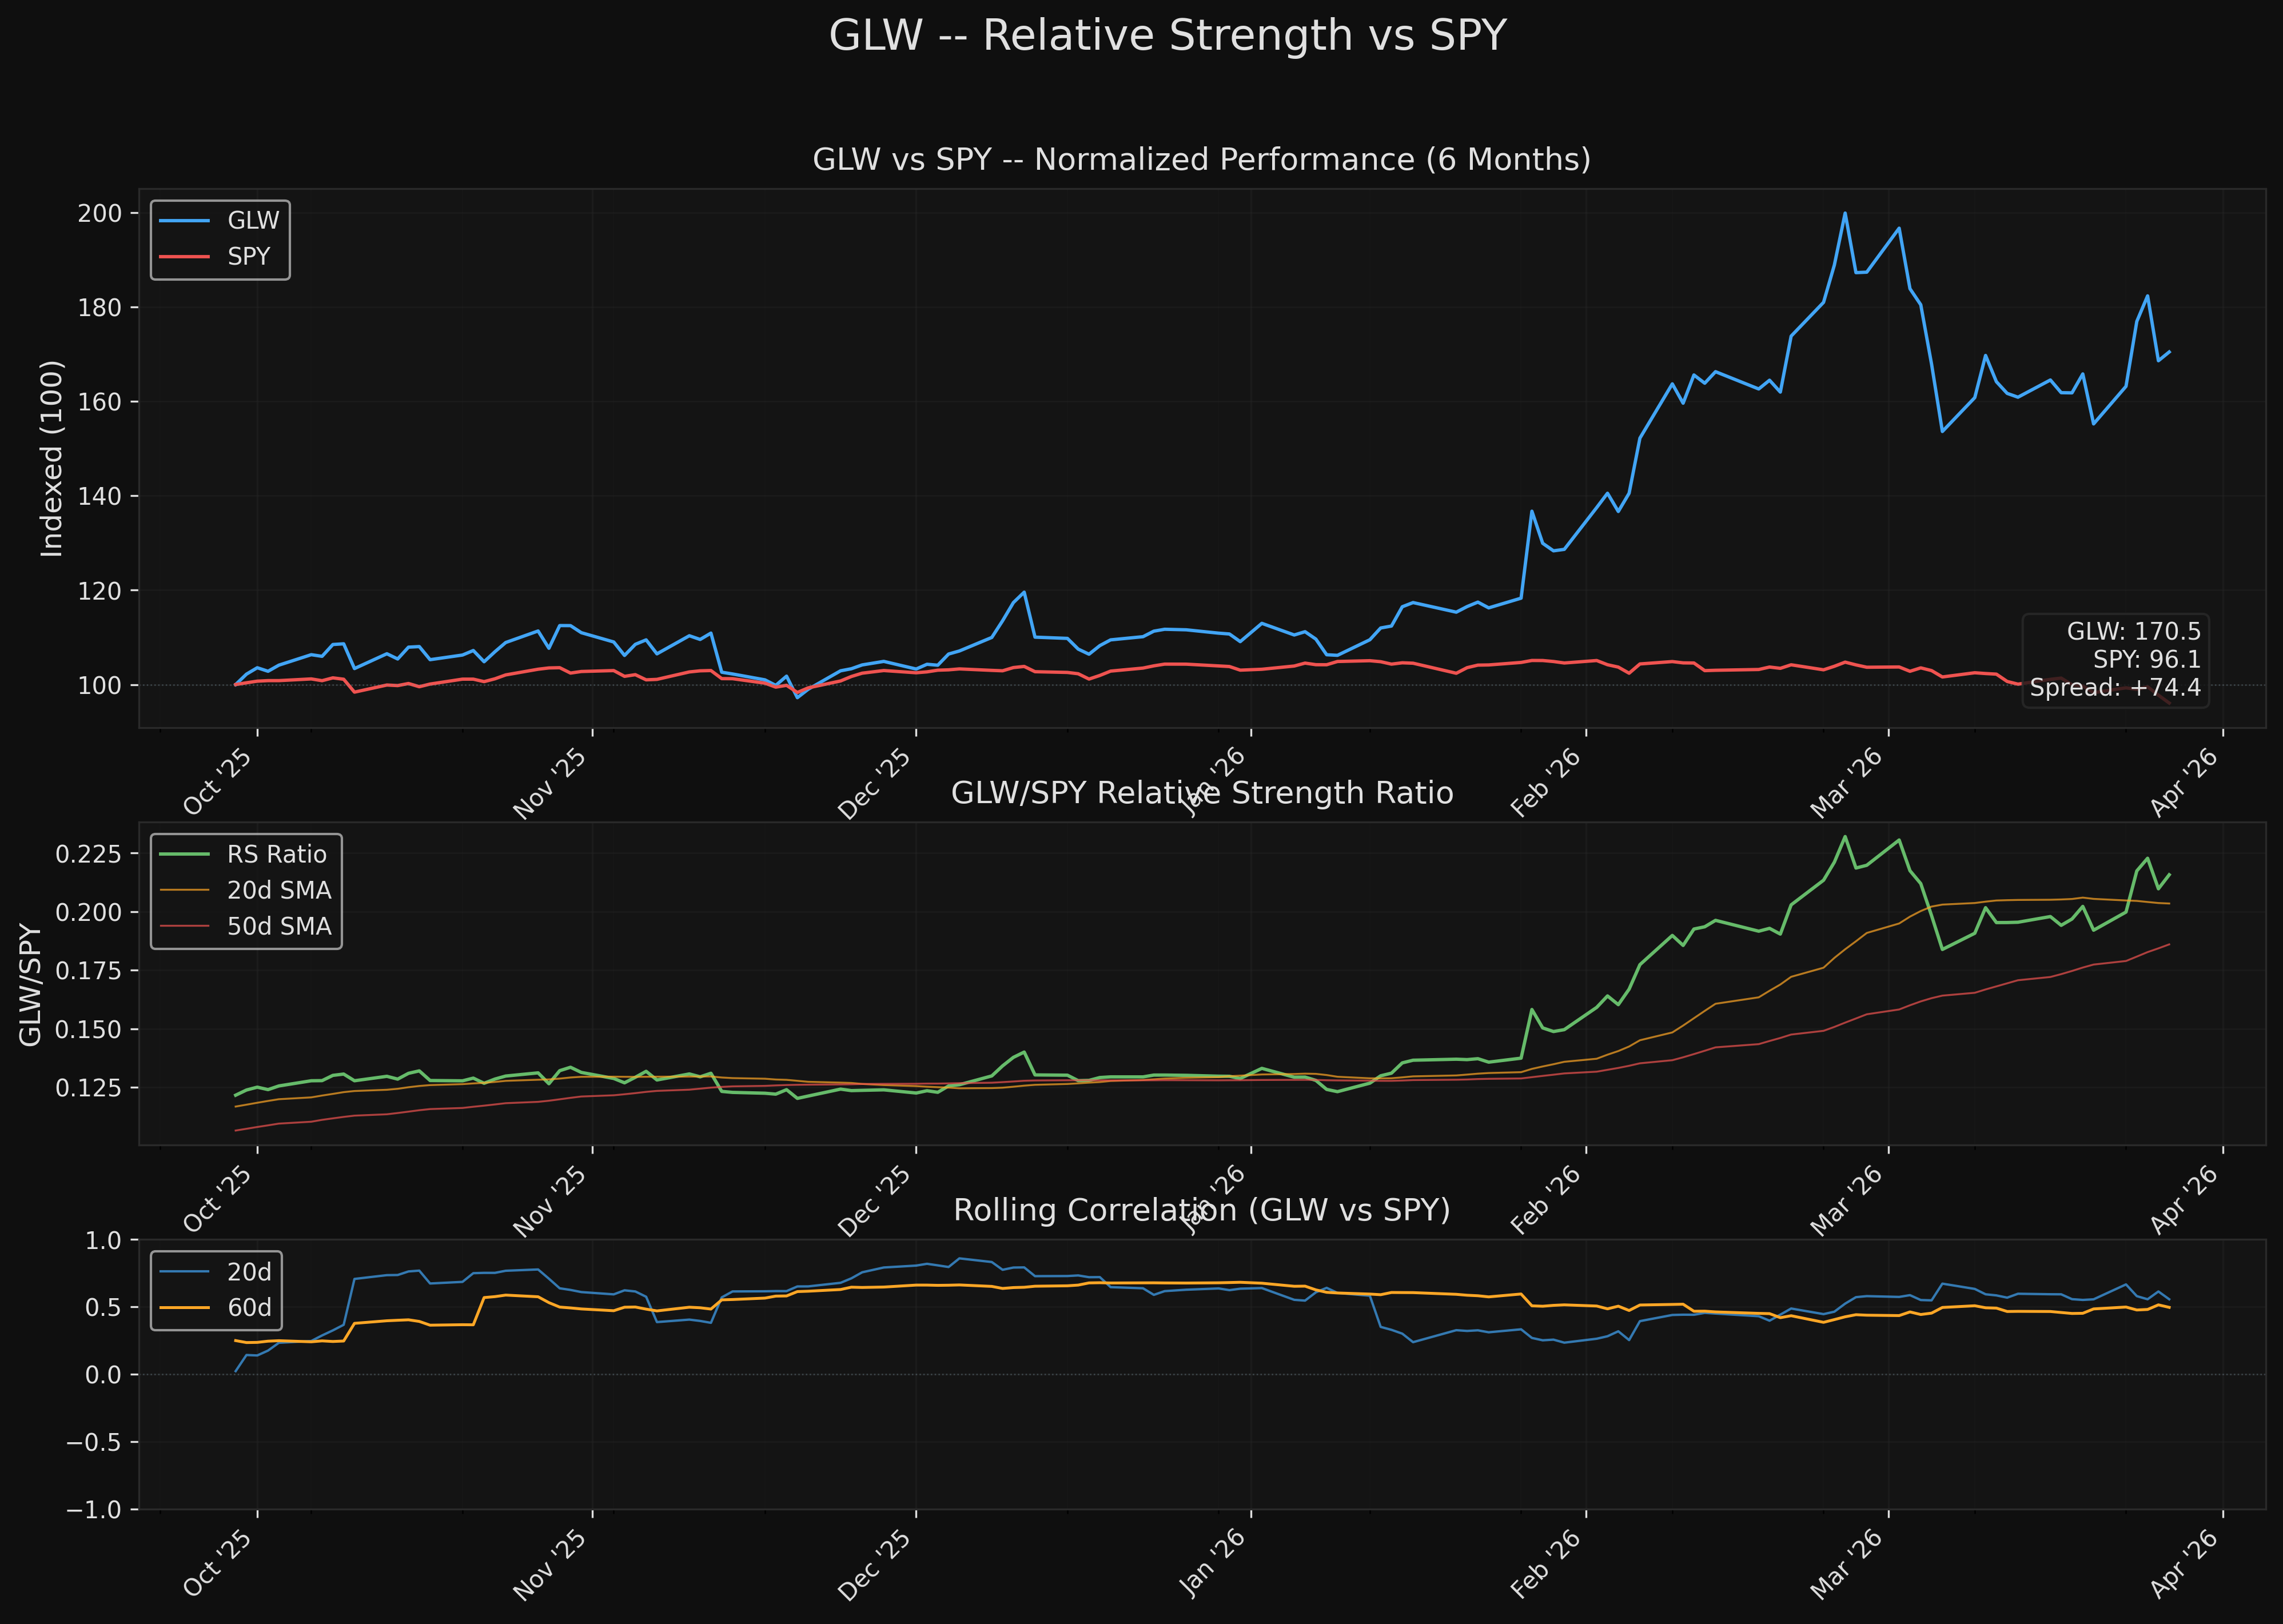 Top panel: Normalized 6-month performance (base 100) showing GLW dramatically outperforming SPY. Middle panel: GLW/SPY relative strength ratio, currently near 6-month highs. Bottom panel: Rolling correlation showing moderate and stable co-movement around 0.5.
Appendix A: Models & Configuration
Data Source
| Parameter | Value |
|---|---|
| Ticker | GLW |
| Source File | data-samples/ohlcv/tv-export/GLW.csv (TradingView export) |
| Date Range | 2006-05-12 to 2026-03-27 |
| Bar Count | 5,000 daily bars |
| Benchmark | SPY (from data-samples/ohlcv/SPY.csv, 2018-01-02 to 2026-03-27) |
| Analysis Focus | Last 12 months (52-week metrics), last 6 months (structure/momentum), last 20 days (volume) |
Indicator Configuration
| Indicator | Parameters | Library/Source |
|---|---|---|
| RSI | 14-period, Wilder smoothing (EWM alpha=1/14) | Custom (pandas ewm) |
| MACD | Fast=12, Slow=26, Signal=9 | Custom (pandas ewm) |
| Stochastic | %K=14, %D=3 (SMA smoothing) | Custom (pandas rolling) |
| SMA | 10, 20, 50, 100, 200 | pandas rolling |
| EMA | 12, 21, 50 | pandas ewm (span, adjust=False) |
| ATR | 14-period, True Range method | Custom (pandas rolling) |
| Bollinger Bands | 20-period SMA, 2 std dev | Custom (pandas rolling) |
| OBV | Cumulative on-balance volume | Custom |
| A/D Line | Money Flow Multiplier * Volume, cumulative | Custom |
| Historical Volatility | 20-day rolling std of returns * sqrt(252) | Custom (pandas rolling) |
| Relative Strength Ratio | GLW Close / SPY Close | Custom |
| Fibonacci Retracement | From 52-week low to 52-week high | Levels: 0, 0.236, 0.382, 0.5, 0.618, 0.786, 1.0 |
Scoring Methodology
| Component | Weight | Sub-Factors |
|---|---|---|
| Trend Alignment | 25% | Price vs SMA 50/100/200 (3x2pts), MA slopes 50/200 (2x2pts), EMA stack order (2pts) |
| Momentum | 20% | RSI zone (2.5pts), MACD position/histogram (2.5pts), Stochastic cross (2.5pts), RSI trend (2.5pts) |
| Volume Confirmation | 20% | Up/down ratio (2.5pts), OBV trend (2.5pts), Volume trend (2.5pts), Accum vs Dist days (2.5pts) |
| Volatility Profile | 15% | ATR % level (2.5pts), BB width percentile (2.5pts), HV level (2.5pts), ATR trend (2.5pts) |
| Market Structure | 20% | HH/HL pattern (3pts), Price vs Fib levels (2pts), RS vs SPY (2.5pts), Gap analysis (2.5pts) |
Script
Analysis script: analysis/quant-research/scripts/GLW-technical-2026-03-28.py
Supplementary script: analysis/quant-research/scripts/GLW-technical-2026-03-28-supplement.py
Charts