GLW
Conviction 4GLW -- Combined Deep Dive Assessment
Date: 2026-03-28 Asset Class: Equity Ticker: GLW (Corning Inc.)
Fundamental Summary
| Metric | Value |
|---|---|
| Overall Score | 58.25/100 |
| Verdict | CAUTION |
| Red Flags | 1 HIGH, 4 MEDIUM |
The Market Analyst scored GLW at 58.25/100 with a CAUTION verdict. Earnings quality is the standout strength (78/100): revenue +19.1% YoY, operating income +101%, FCF +45%, four consecutive GAAP beats, and 20.2% core operating margin in Q4 2025. The weakness is valuation (35/100) -- trailing PE 74.8x and EV/FCF 89x are extreme for a specialty industrial, though the ~14% pullback from $157.97 improved the score from 28/100 at the February analysis. One HIGH red flag: reversion to 30x trailing PE implies ~$55 stock. Four MEDIUM flags: stock 5.2% above analyst consensus mean ($130), C-suite cluster selling $30M+ near ATH in Feb 2026, GAAP/Core EPS divergence of 37.7%, and worst 1M peer performance (-8.8% vs CIEN +17.7%).
AI Buildout Exposure: $3.2B direct hyperscaler/enterprise fiber revenue (+61% YoY) = 20% of total revenue. Full Optical segment ($6.3B, 40% of revenue) is the indirect beneficiary. The $6B Meta deal provides contracted demand visibility. Springboard Plan targets $5.75B incremental annualized sales by end 2026. BofA sizes the optical opportunity at $10.3B by 2030. This is the most credible AI infrastructure picks-and-shovels story in the materials sector.
Defensive Characteristics: GLW is NOT defensively positioned (beta 1.02). Recent outperformance was driven by AI theme enthusiasm and fundamental execution, not counter-cyclical demand. The Meta contract provides near-term earnings certainty, but an AI capex pullback would disproportionately hurt GLW.
Technical Summary
| Metric | Value |
|---|---|
| Overall Score | 7.1/10 |
| Bias | Bullish |
| Red Flags | 3 MEDIUM |
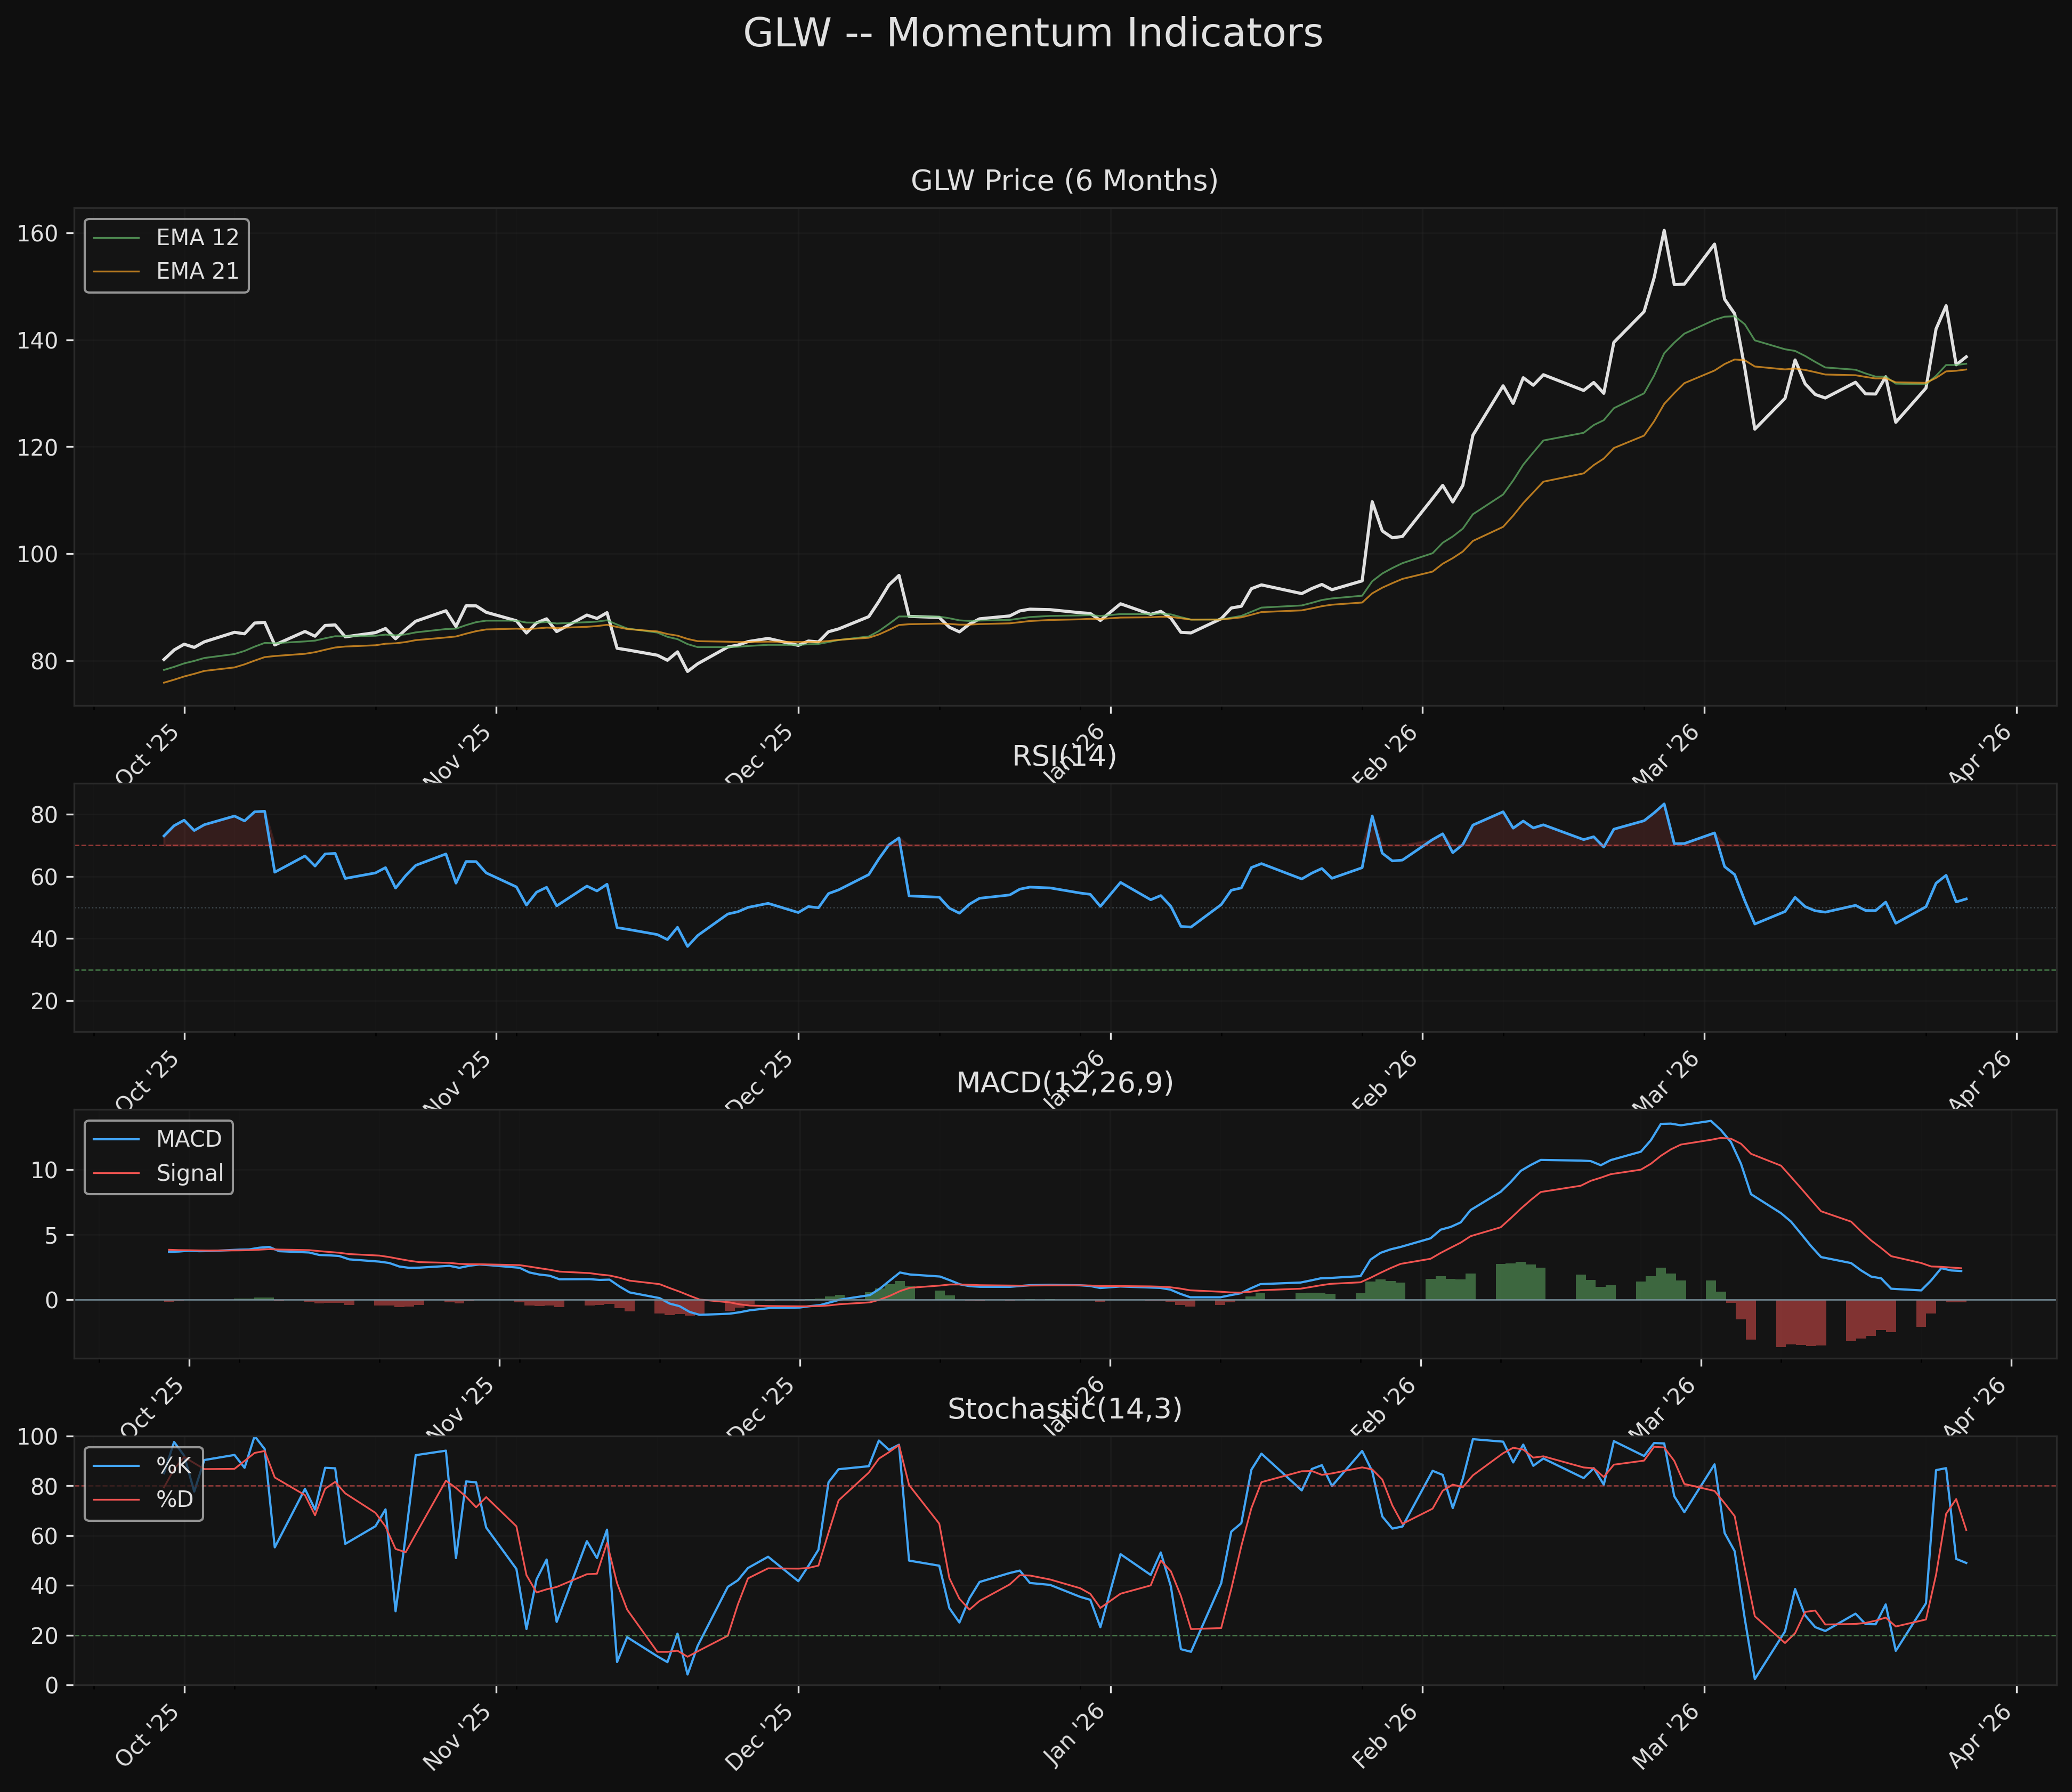
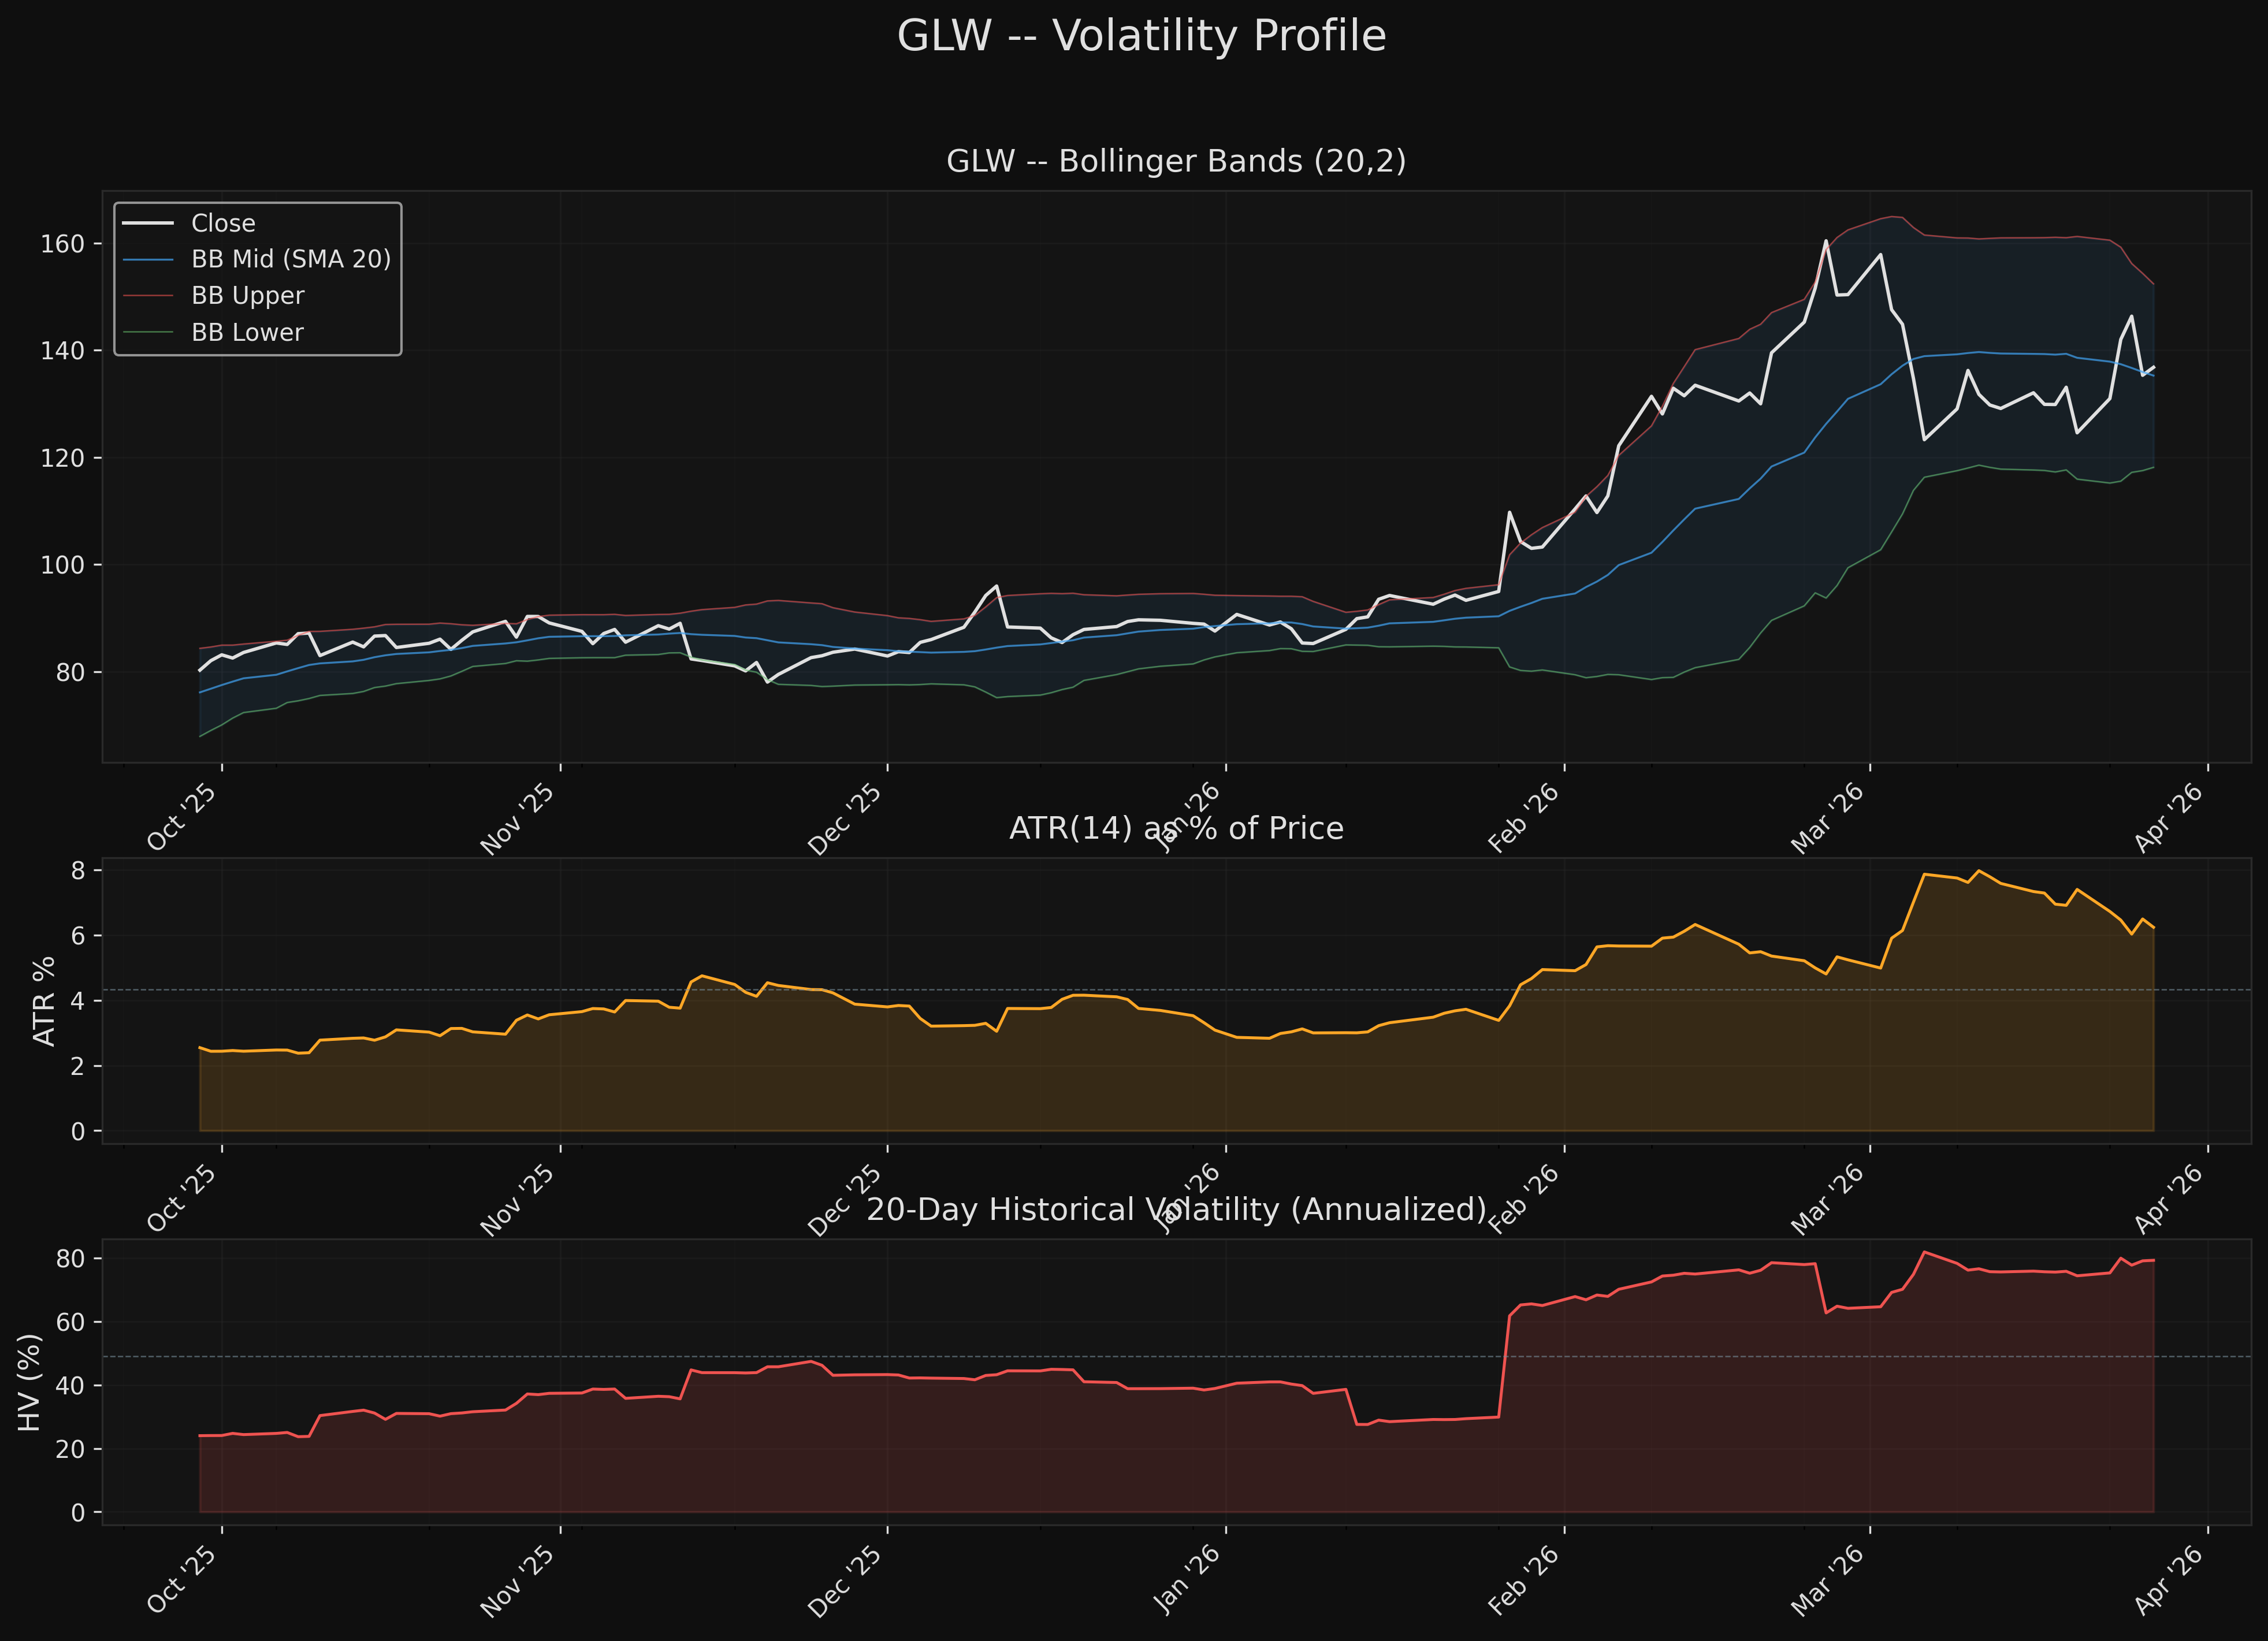
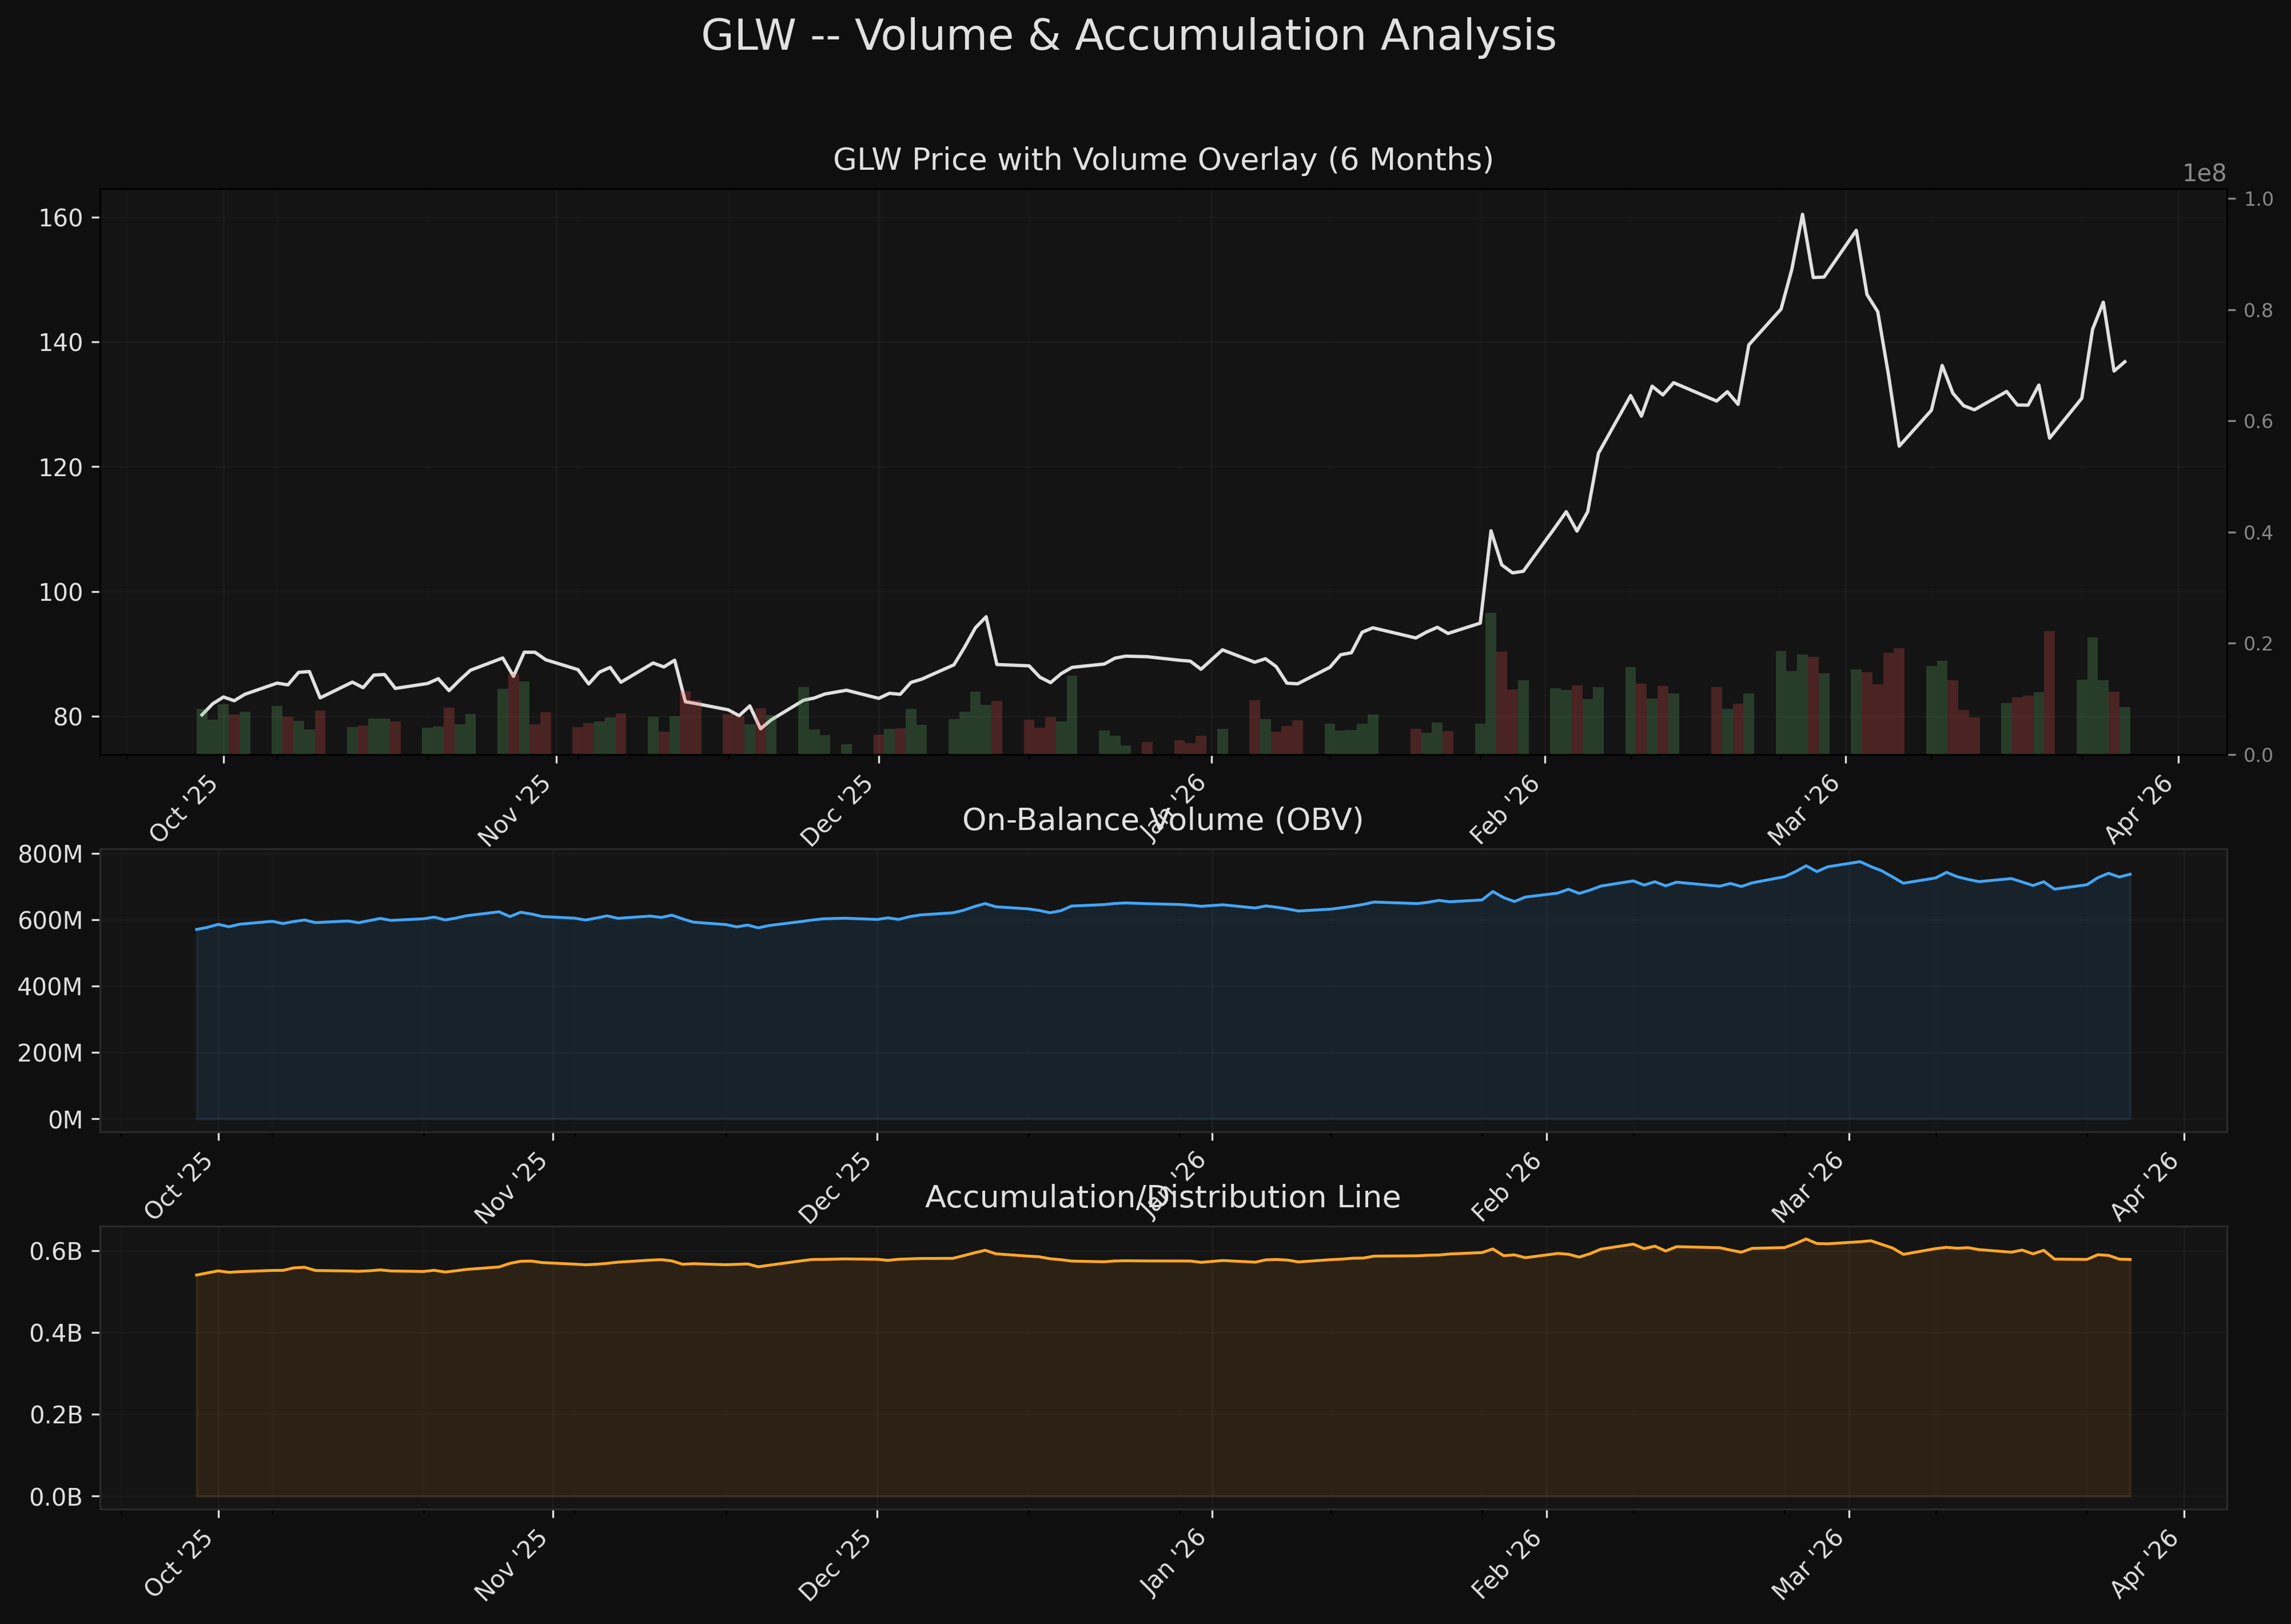
The Quant Researcher scored GLW at 7.1/10 with a Bullish bias. Trend Alignment (10.0/10) is perfect -- above all MAs with a bullish EMA stack (12 > 21 > 50) and all MAs rising. Market Structure (9.0/10) shows a textbook markup phase: higher highs ($96.64 -> $162.10) and higher lows ($83.95 -> $91.01 -> $120.01 -> $123.90), with the January 27 earnings gap ($94.95 to $109.74, +15.6% on 4.2x volume) never filled. The weakest components are Volume Confirmation (4.5/10) -- OBV and A/D line both falling, up/down volume ratio 0.85, zero accumulation days in 20 sessions -- and Volatility Profile (2.5/10) -- ATR 6.24% of price, HV 79% annualized, 25% drawdown in 8 trading days during March.
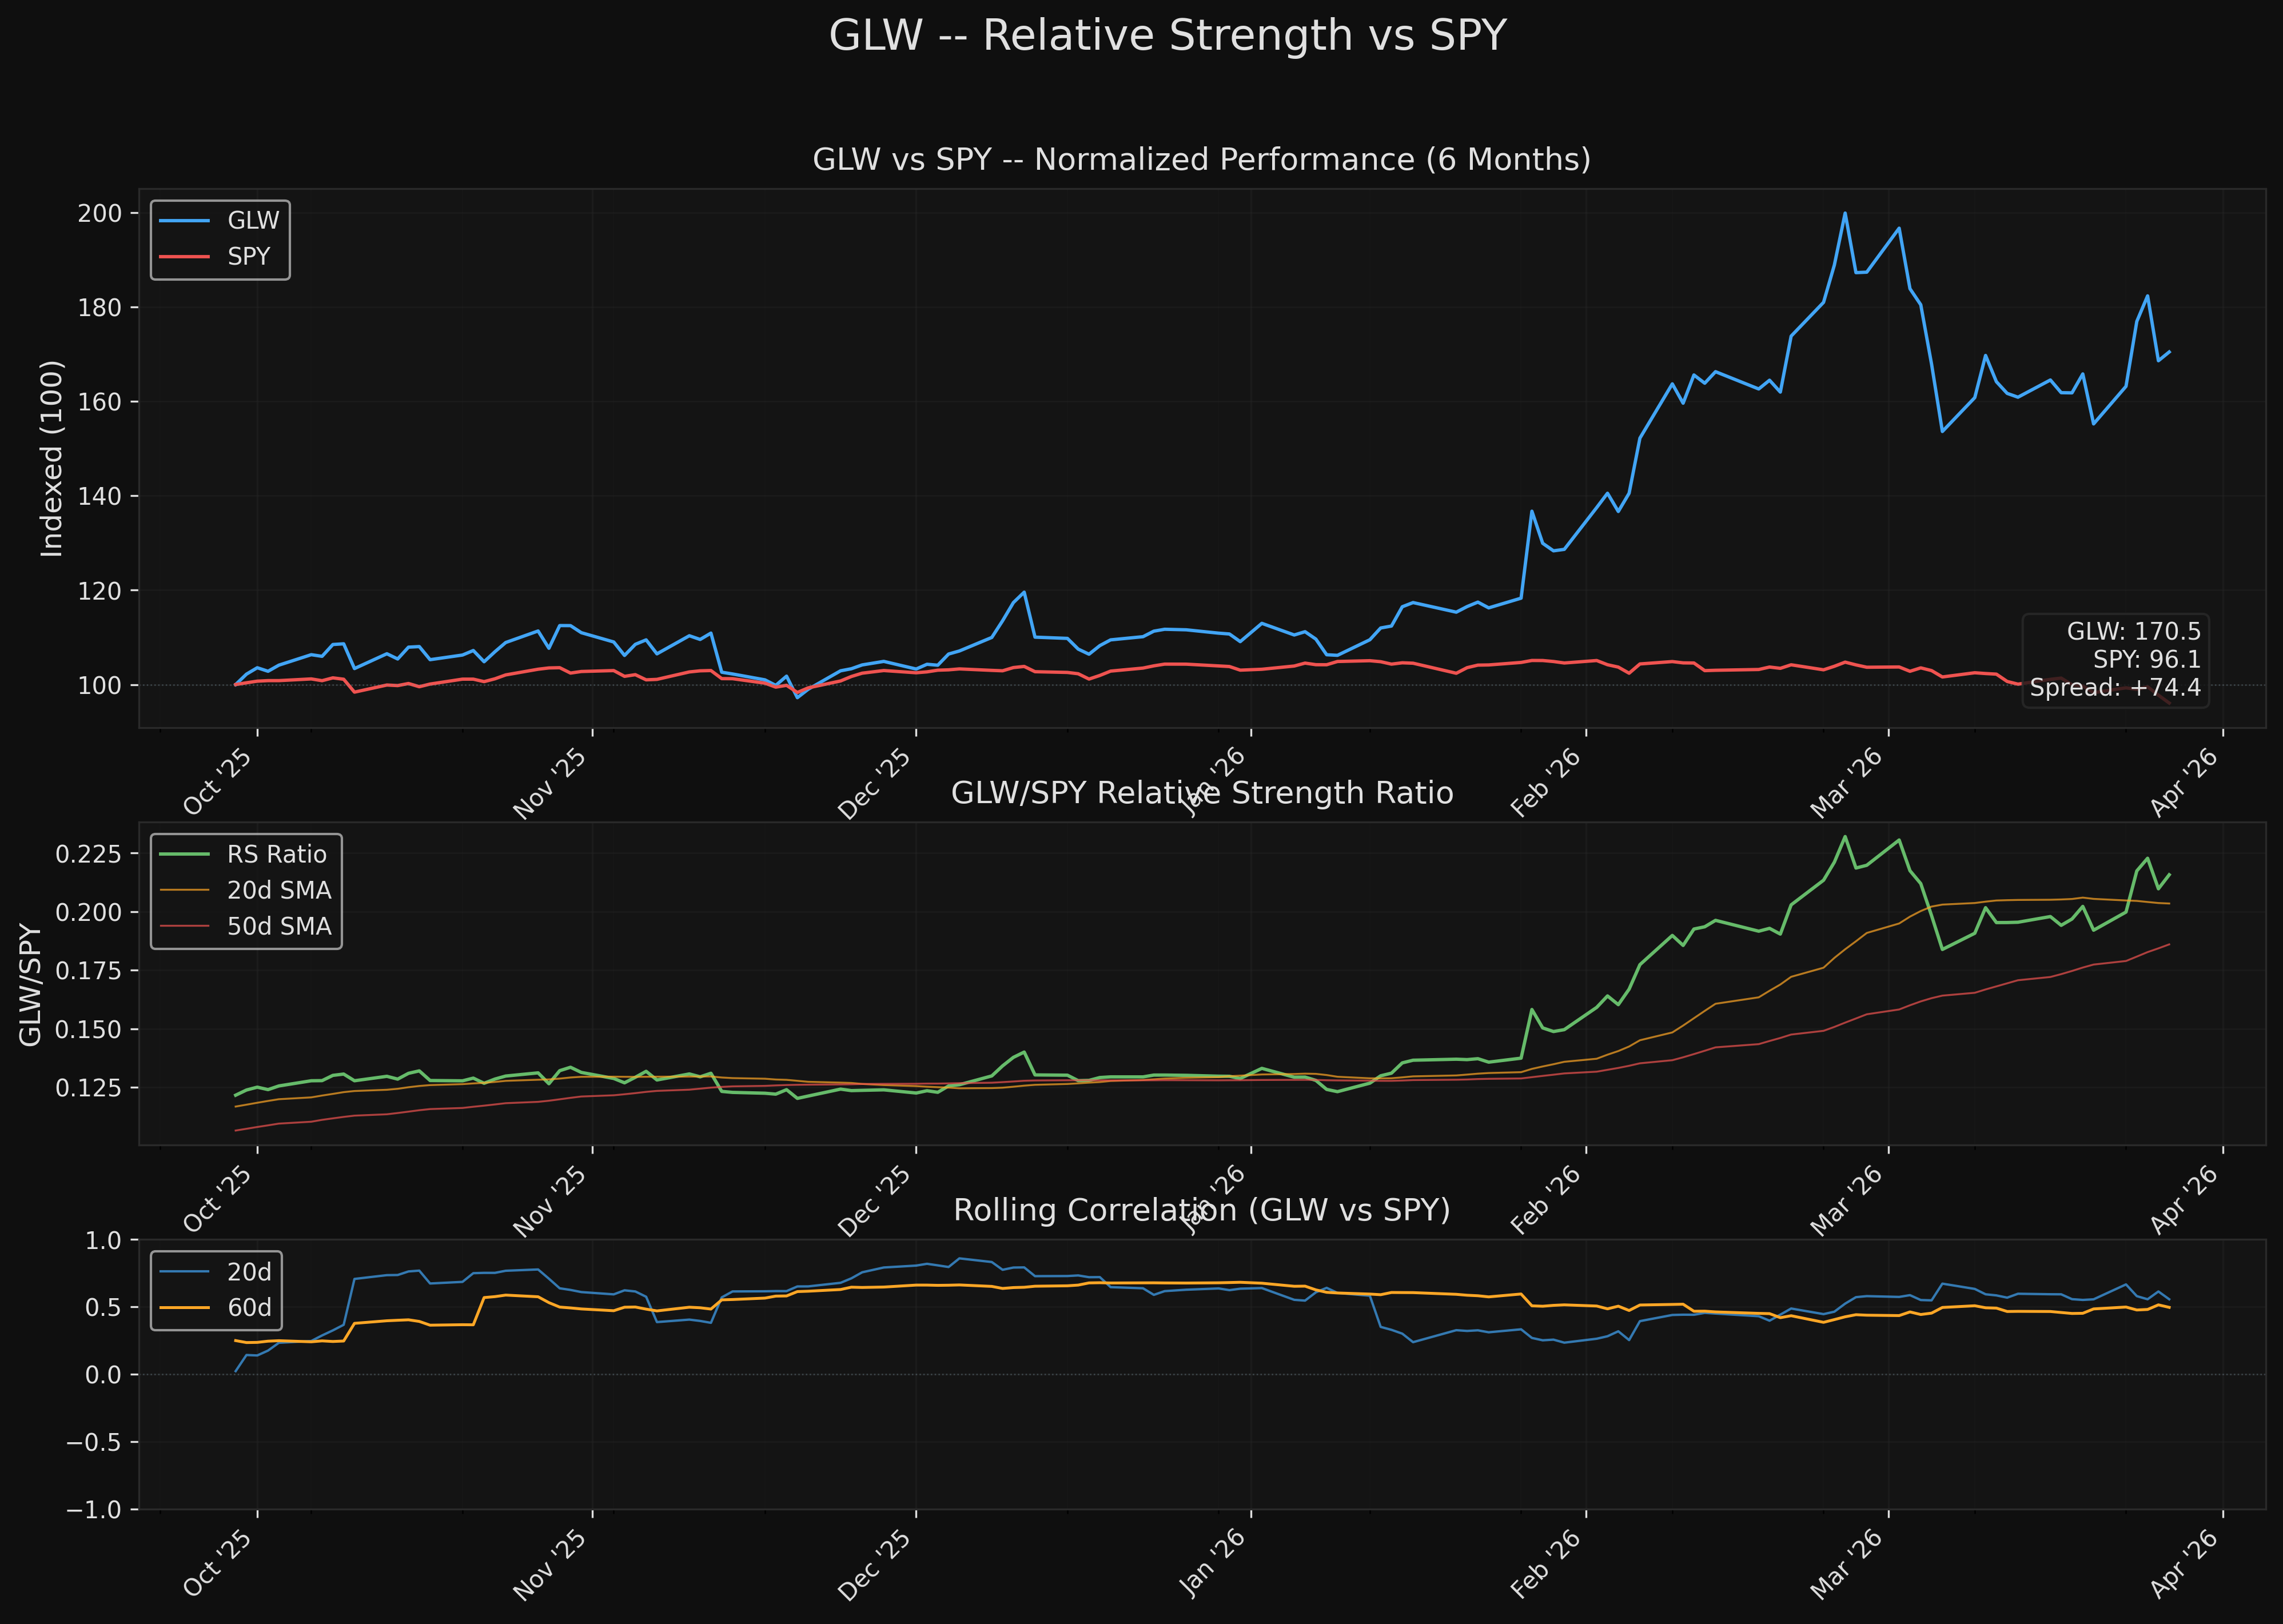
Relative Strength vs SPY: Over 3 months, GLW outperformed SPY by +60.5 percentage points (+52.6% vs -7.9%). Since the SPY peak around Feb 19, GLW gained +5.3% while SPY lost -7.1% (12.4pp spread). The GLW/SPY ratio sits at the 93.6th percentile of its 6-month range.
PARTIAL AGREEMENT Assessment
Fundamental-Technical Alignment: PARTIAL-BULL
Both analyses independently confirm the bullish structural thesis but diverge on timing and entry:
-
AI buildout thesis -- ALIGNED. Fundamentals quantify $3.2B direct AI revenue (+61% YoY) with contracted Meta demand. Technicals confirm the thesis via a 15.6% earnings gap that has never filled and sustained markup structure since January. Both agree the rerate from specialty industrial to AI infrastructure backbone is structurally real.
-
Relative strength -- ALIGNED. Fundamentals explain the "why" (contracted demand, Springboard execution, fiber supply sold out through 2026). Technicals measure the "what" (60.5pp outperformance vs SPY over 3 months, ratio at 93.6th percentile). Both confirm GLW is one of the strongest large-cap names in the market.
-
Current entry -- DISAGREEMENT. Fundamentals say CAUTION: stock is 5.2% above analyst consensus mean ($130), expected value calculation implies $134 (2% below current price), and the ideal entry is $120-130. Technicals show the stock sitting inside a 4-MA support cluster ($134-136) with R:R of 2.1:1 to the 52-week high -- tradeable, but not ideal. Both agree that $125-126 (SMA 50 area) or $120 (March swing low) would be superior entries.
-
Volume concern -- ALIGNED. Fundamentals note momentum rotation away from GLW toward CIEN and COHR. Technicals independently confirm: zero accumulation days in 20 sessions, falling OBV/AD, up/down volume ratio of 0.85. The trend is being maintained by structure, not fresh buying pressure.
Where they agree most: AI buildout is a durable multi-year theme; GLW's relative strength is real and earned; but the stock is not cheap and the trend needs volume confirmation to sustain.
Where they disagree: Fundamentals weight valuation risk more heavily (CAUTION at 58.25/100). Technicals weight trend structure more heavily (Bullish at 7.1/10). The disconnect is about what matters more -- price versus momentum.
Key Levels
| Level | Price | Source |
|---|---|---|
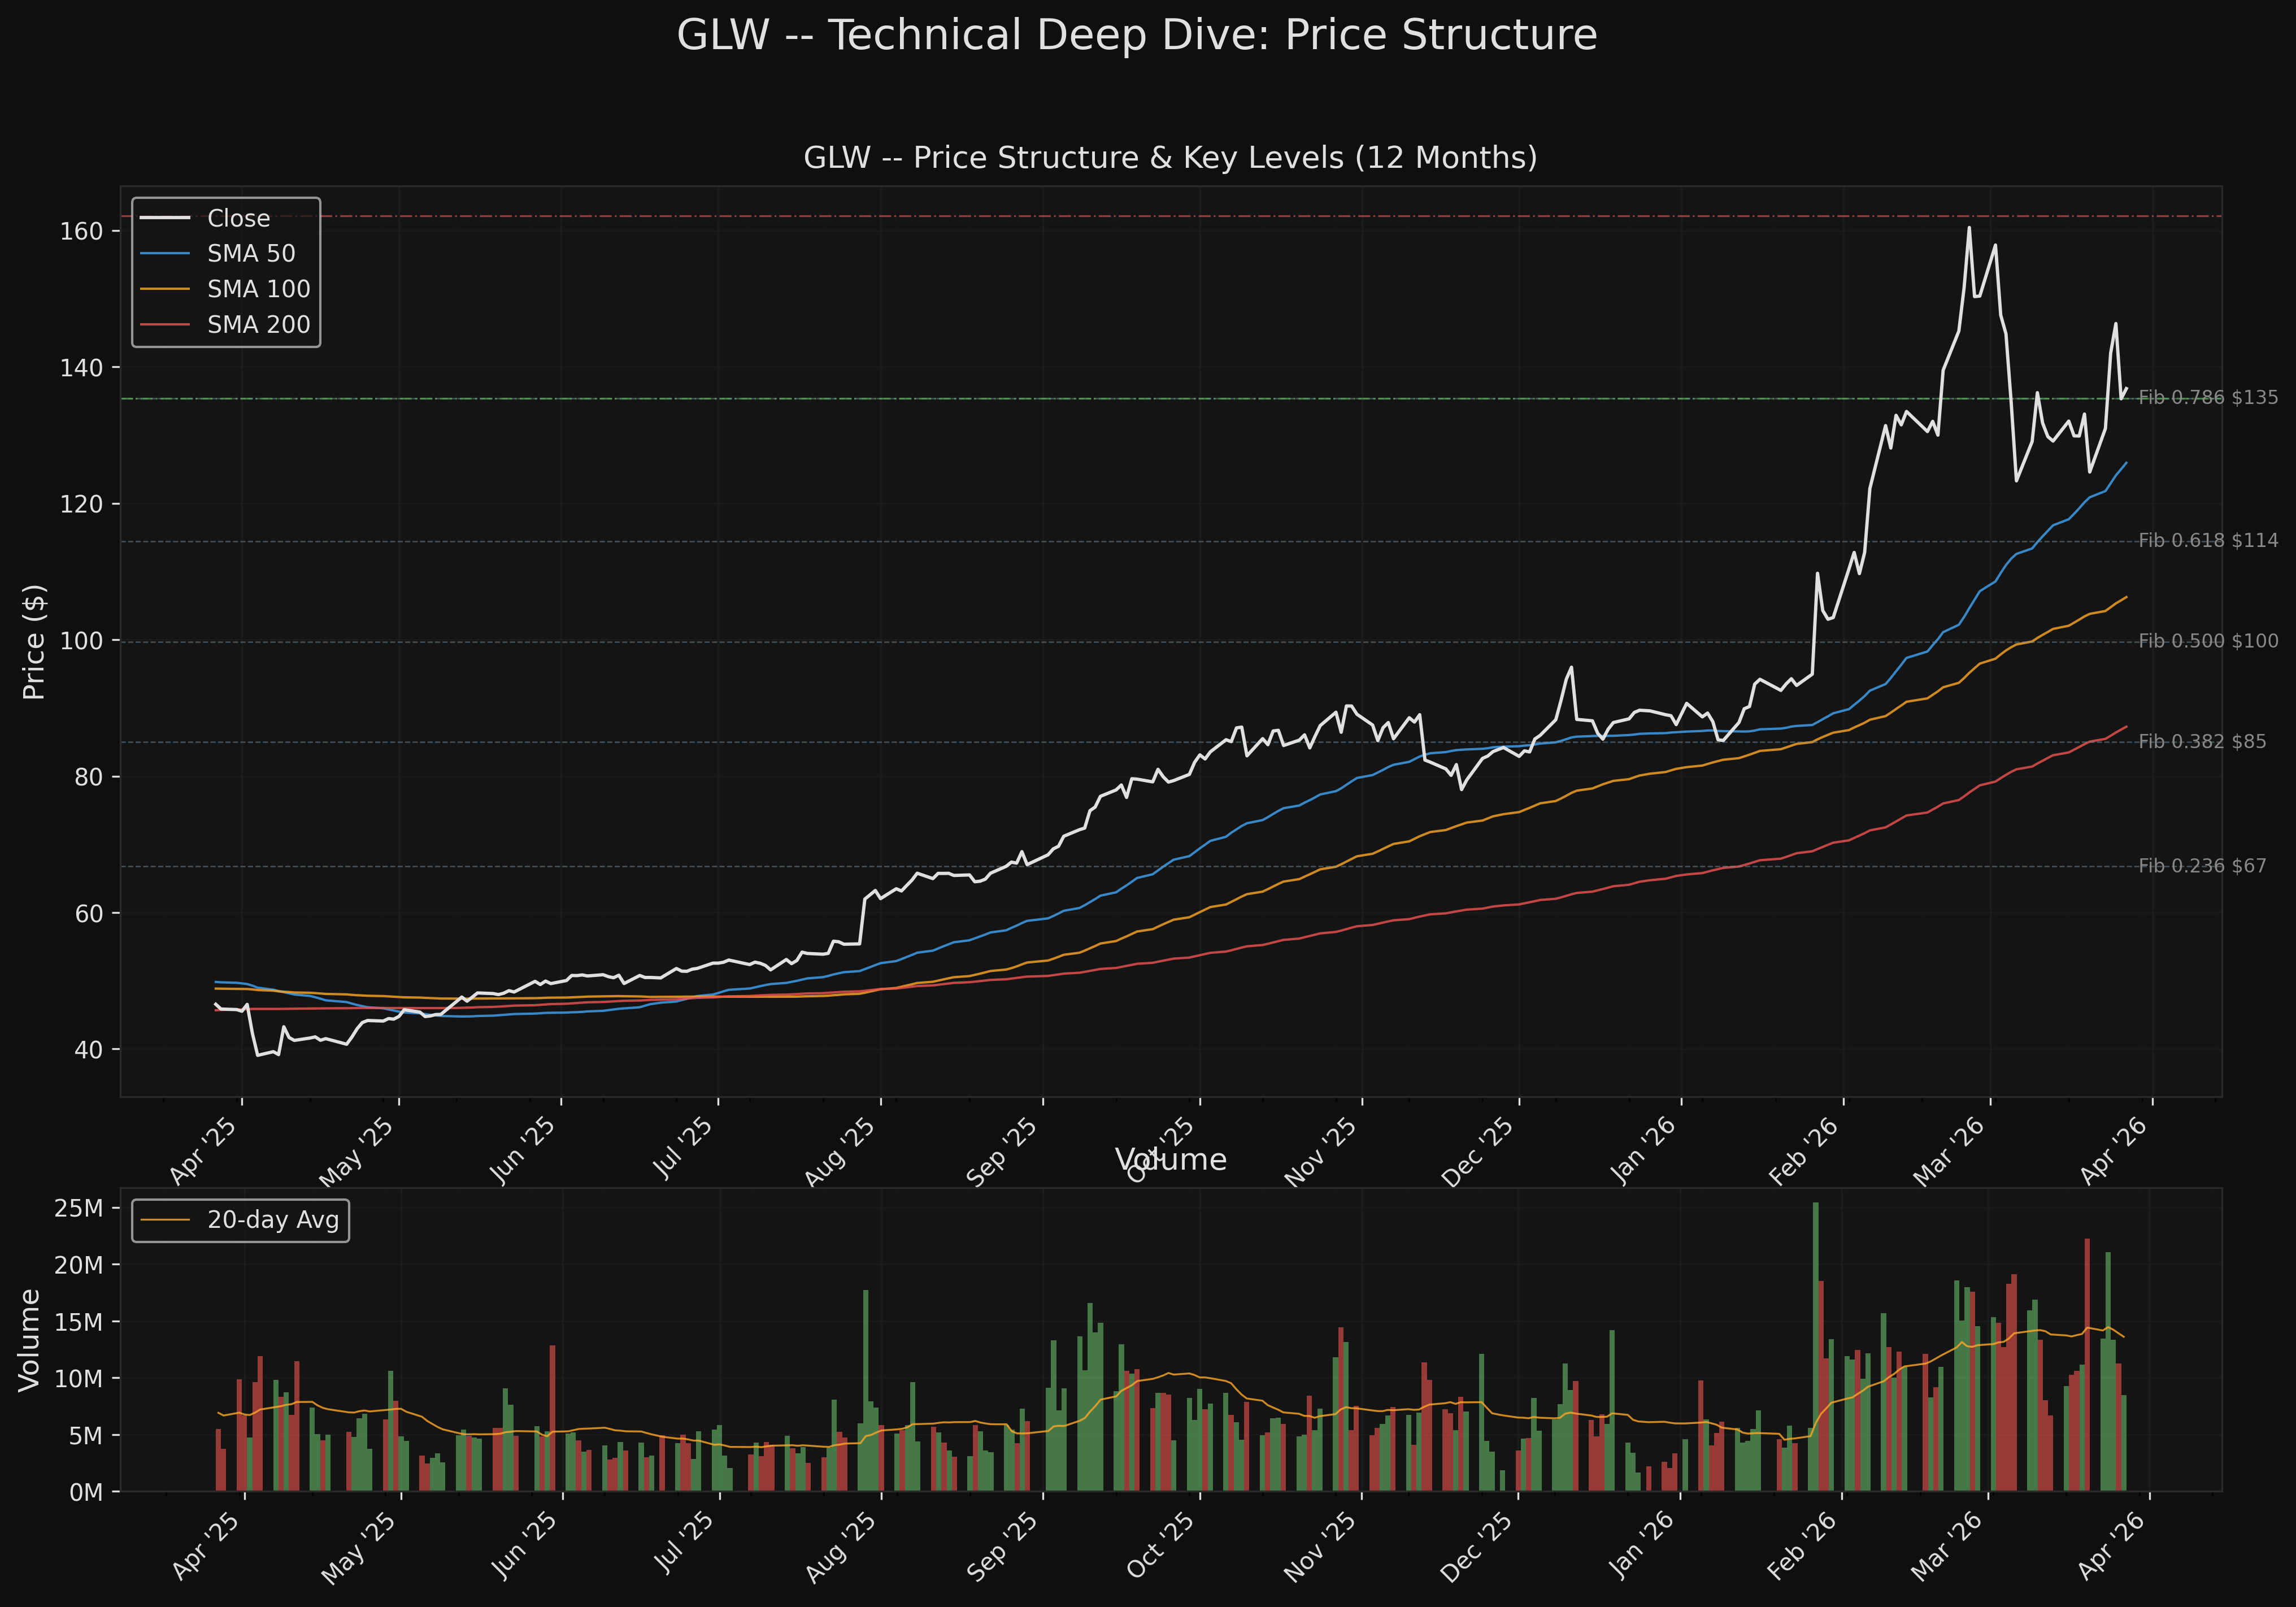
| Resistance 2 (52wk High) | $162.10 | Technical: Feb 25 peak |
| Resistance 1 | $150.25 | Technical: Mar 25 bounce high |
| Current Price | $136.81 | -- |
| Support 1 (MA Cluster) | $134-136 | Technical: EMA 12/21, SMA 10/20 |
| Support 2 (SMA 50) | $125.94 | Technical + Fundamental: analyst consensus zone |
| Support 3 (Swing Low) | $120.01 | Technical: March 9 correction bottom |
| Support 4 (Gap Fill) | $94.95 | Technical: Jan 27 pre-gap close (bull/bear line) |
Risk/Reward Framework
Scenario 1: Pullback to SMA 50 Entry (Preferred)
- Entry: $125-126 (SMA 50 / EMA 50 cluster)
- Stop: $119.00 (below March 9 swing low)
- Target 1: $150.25 (March bounce high)
- Target 2: $162.10 (52-week high)
- R:R: 3.6:1 to T1, 5.4:1 to T2
- Probability: Moderate -- requires 8-9% pullback, but GLW has shown 15-25% corrections are routine
Scenario 2: Current Level Entry (Aggressive)
- Entry: $136.81 (current)
- Stop: $125.00 (below SMA 50)
- Target 1: $150.25 (March bounce high)
- Target 2: $162.10 (52-week high)
- R:R: 1.1:1 to T1, 2.1:1 to T2
- Probability: Moderate-High -- trend structure supports, but volume weakness is a concern
Scenario 3: Breakout Above $150 (Momentum)
- Entry: $150.25+ on above-average volume
- Stop: $140.00 (below consolidation range)
- Target: $175.00 (measured move)
- R:R: 2.4:1
- Probability: Lower near-term -- requires volume confirmation and MACD bullish cross
Catalyst Timeline
| When | Event | Expected Impact | What to Watch |
|---|---|---|---|
| Late Apr / Early May 2026 | Q1 2026 Earnings (date conflicted: Apr 28 vs May 5) | +/-8-12% | Core EPS vs $0.66-0.70 guidance; Optical segment growth rate |
| Ongoing | Additional hyperscaler anchor deals | +5-10% if announced | Management hinted at pipeline on Jan 28 call |
| Ongoing | AI capex news flow | -10-20% if negative | Any hyperscaler capex reduction is primary tail risk |
| H1 2026 | Meta deal manufacturing ramp | +3-5% confirmation | Hickory NC capacity expansion progress |
Data quality note: Q1 earnings date is conflicted (Apr 28 per yfinance vs May 5 per TipRanks/Nasdaq). Verify at investor.corning.com before date-dependent decisions.
Conviction Assessment
| Component | Value | Rationale |
|---|---|---|
| Fund-Tech Agreement | 0.6 | Partial alignment -- both bullish on thesis, disagree on entry timing/valuation |
| Catalyst Density | 0.6 | Moderate -- Q1 earnings in ~4 weeks, Meta ramp ongoing, no imminent binary catalyst |
| Data Quality | 0.9 | Large-cap with full analyst coverage, 13 analysts, deep institutional ownership data |
| Risk/Reward Asymmetry | 0.65 | 2.1:1 R:R at current level to 52wk high; 3.6:1 at SMA 50 pullback entry |
| Red Flag Severity | 0.7 | 1 HIGH + 7 MEDIUM total (4 fundamental, 3 technical), all structural/disclosed |
Conviction Score: 4 (Above Average) Weighted Score: 68.0/100 Position Sizing: 75% of target position
Actionable Framework
Preferred approach: Set limit orders at $125-126 (SMA 50 zone) for a 3.6:1 R:R entry. Stop at $119 below the March 9 structural low. This level aligns with both the fundamental analyst consensus range ($120-130) and the most significant technical support.
If entering at current levels ($136-137): Size at 50-60% of target to account for the elevated volatility (ATR 6.24%) and suboptimal R:R. Stop at $125 below the SMA 50 cluster. Add to the position on a successful retest of $125 support or a volume-confirmed breakout above $150.
Position sizing constraint: At 6.24% ATR, a 1-ATR stop requires small position sizes. For a $100K portfolio risking 1% per trade ($1,000), max position is ~117 shares (~$16,000 / 16% of portfolio). This volatility demands conservative sizing regardless of conviction.
What would change the thesis: - Bullish escalation: New hyperscaler deal announcement, Q1 earnings beat with Springboard upgrade, or volume-confirmed breakout above $150 - Bearish: Break below $120 on expanding volume (damages higher-low structure), AI capex reduction announcement, or Q1 earnings miss - CRITICAL: A close below $94.95 (gap fill) would invalidate the entire post-January rerate thesis
Relative Strength Context (User Focus Area)
GLW's relative strength during the SPY decline is real and quantifiable but not defensive in nature:
- +60.5pp outperformance vs SPY over 3 months -- one of the widest spreads in the large-cap universe
- GLW/SPY ratio at 93.6th percentile of 6-month range -- near peak relative strength
- The driver is AI theme enthusiasm, not defensive characteristics (beta 1.02, cyclical business)
- The Meta contract provides a floor of earnings certainty that pure-growth AI names lack, which may explain the relative resilience
- Risk: If the SPY decline shifts from broad rotation to AI-specific capex concerns, GLW would NOT be spared -- 40% of revenue is Optical/AI-exposed
The stock is showing relative strength despite being cyclical because the market is pricing contracted AI demand as recession-resistant. Whether that proves correct depends entirely on whether hyperscaler capex plans hold through any economic slowdown.
Charts