GLD — Technical Summary
Conviction 5GLD -- Technical Analysis Deep Dive
===========================================================
  GLD -- Technical Analysis                   2026-03-02
  Asset Class: Equity (Gold ETF)
  Price: $487.20  |  52wk: $265.07 - $509.70
===========================================================

  OVERALL SCORE: 8.3/10      BIAS: Bullish

  COMPONENT SCORES
  -----------------------------------------------------------
  Trend Alignment         10.0/10  wt 25%  Perfect bull stack, all MAs rising
  Momentum                 7.5/10  wt 20%  MACD bullish, RSI divergence warning
  Volume Confirmation      9.0/10  wt 20%  OBV confirming, A/D accumulation
  Volatility Profile       3.5/10  wt 15%  Elevated HV, negative skew, near BB top
  Market Structure         10.0/10  wt 20%  Markup phase, 3/3 HH and HL

  KEY LEVELS
  -----------------------------------------------------------
  Resistance 2:  $509.70   52-week / all-time high
  Resistance 1:  $500.00   Psychological round number
  Current Price: $487.20
  Support 1:     $462.81   SMA(20), pullback magnet
  Support 2:     $440.68   SMA(50), trend support

  RED FLAGS                                    (3 found)
  -----------------------------------------------------------
  MEDIUM  Bearish RSI divergence (30-day)      [Momentum]
  MEDIUM  Stochastic in overbought zone        [Momentum]
  MEDIUM  Elevated volatility regime           [Volatility]

===========================================================
2. Executive Summary
GLD (SPDR Gold Shares) is in a powerful secular uptrend, having gained +83.9% over the past 252 trading days and +22.3% year-to-date in 2026. The ETF trades at $487.20, just 4.4% below its all-time high of $509.70 set on January 29, 2026.
The technical picture is strongly bullish on a structural basis: price maintains a perfect bull stack above all key moving averages (20/50/100/200 SMA), the 6-month Wyckoff analysis shows a textbook Markup phase with 3 of 3 higher highs and 3 of 3 higher lows, and volume indicators (OBV, A/D line) confirm the trend.
The primary concern is the volatility profile. The 20-day historical volatility stands at 40.92% annualized (versus a 252-day figure of 25.57%), the return distribution shows meaningful negative skewness (-1.23) and excess kurtosis (8.39), and the Bollinger Band position at 91% signals near-term overextension. The stochastic oscillator is in overbought territory (%K=90.12), and a 30-day bearish RSI divergence is developing (price rising while RSI trends lower).
This is a high-conviction uptrend with near-term overbought conditions. The ideal approach is to own this trend but manage entries through pullbacks to the SMA(20) or SMA(50) rather than chasing at current levels.
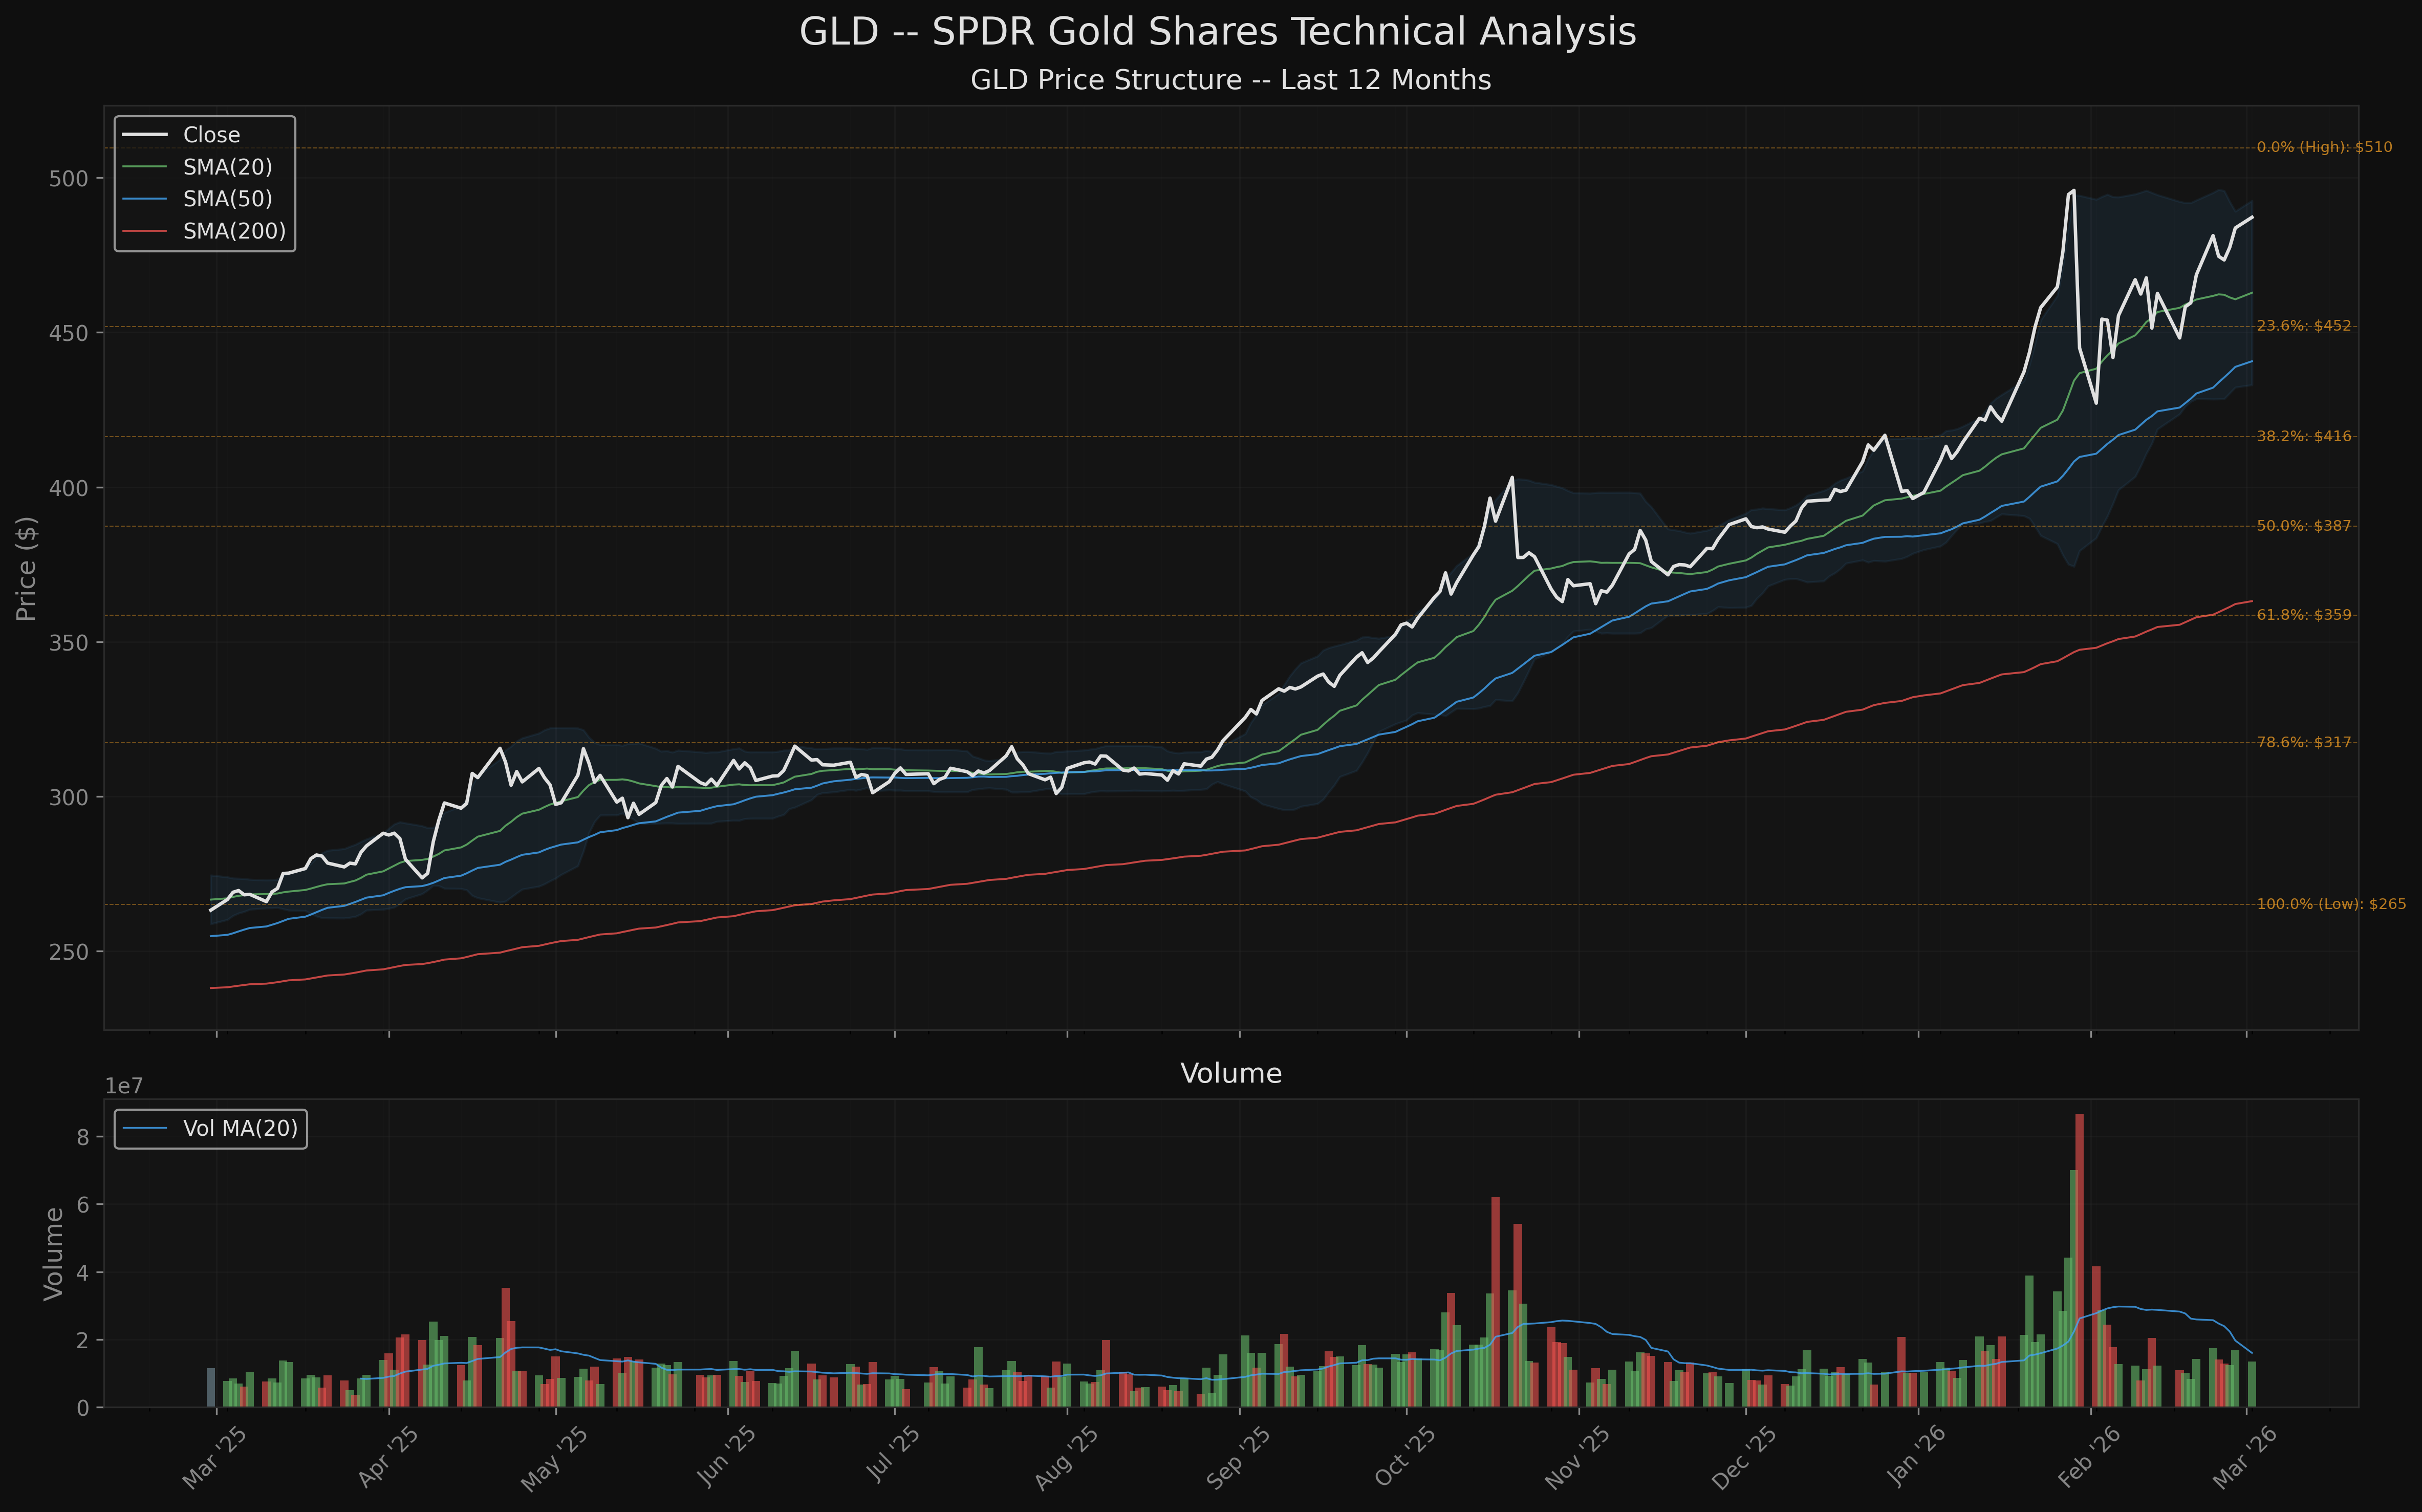
3. Price Structure
52-Week Range
| Metric | Value | Date |
|---|---|---|
| 52-Week High | $509.70 | 2026-01-29 |
| 52-Week Low | $265.07 | 2025-03-03 |
| Current Price | $487.20 | 2026-03-02 |
| Range Position | 90.8% | -- |
| Distance from ATH | -4.41% | -- |
GLD sits in the upper decile of its 52-week range, having nearly doubled from its March 2025 low. The 244.63-point range ($265.07 to $509.70) reflects an extraordinary 92.3% expansion over the past year.
Fibonacci Retracement (52-Week)
| Level | Price |
|---|---|
| 0.0% (High) | $509.70 |
| 23.6% | $451.97 |
| 38.2% | $416.25 |
| 50.0% | $387.39 |
| 61.8% | $358.52 |
| 78.6% | $317.42 |
| 100.0% (Low) | $265.07 |
Current price ($487.20) sits well above the 23.6% retracement at $451.97, indicating the uptrend has not yet corrected meaningfully on the 52-week timeframe.
Recent Performance
| Period | Return |
|---|---|
| 5-day | +1.23% |
| 10-day | +5.31% |
| 20-day | +9.50% |
| 60-day | +25.81% |
| 90-day | +20.85% |
| 252-day | +83.90% |
| YTD | +22.33% |
All timeframes show positive returns, with acceleration over the past 60 days (+25.81%). The 252-day return of +83.90% represents the strongest annual performance for GLD in its history as an ETF.
Max Drawdown
The deepest drawdown over the past 12 months was -13.87%, with the trough occurring on 2026-02-02. The current drawdown from the 52-week high is -4.41%, indicating a recovery rally is underway.
4. Market Structure
Wyckoff Phase: Markup (Phase D/E)
The 6-month swing analysis provides unambiguous evidence of a Markup phase:
Swing Analysis (4 segments over 6 months):
| Segment | High | Low |
|---|---|---|
| 1 (Sep-Oct) | $378.86 | $314.64 |
| 2 (Oct-Nov) | $403.30 | $360.12 |
| 3 (Nov-Dec) | $425.74 | $380.46 |
| 4 (Jan-Mar) | $509.70 | $417.04 |
- Higher highs: 3/3 -- Each successive segment established a new high above the prior segment.
- Higher lows: 3/3 -- Each successive segment's low was above the prior segment's low.
- Lower highs: 0/3 -- No segment failed to exceed its predecessor.
- Lower lows: 0/3 -- No segment violated its predecessor's support.
Trend Slope: $1.14/day annualized to approximately 72.9%. This is an extremely steep slope by GLD standards and reflects both the absolute price move and the acceleration in the trend.
Volume Confirmation: The second half of the 6-month window showed +1.0% higher average volume than the first half -- modest but positive confirmation. Volume has not dried up during the advance.
Wyckoff Interpretation: This is a textbook Markup phase with clean structure. The absence of any lower highs or lower lows across four non-overlapping segments demonstrates strong buyer control. The risk in Markup phases is that they eventually transition to Distribution -- current evidence does not yet show distribution characteristics.
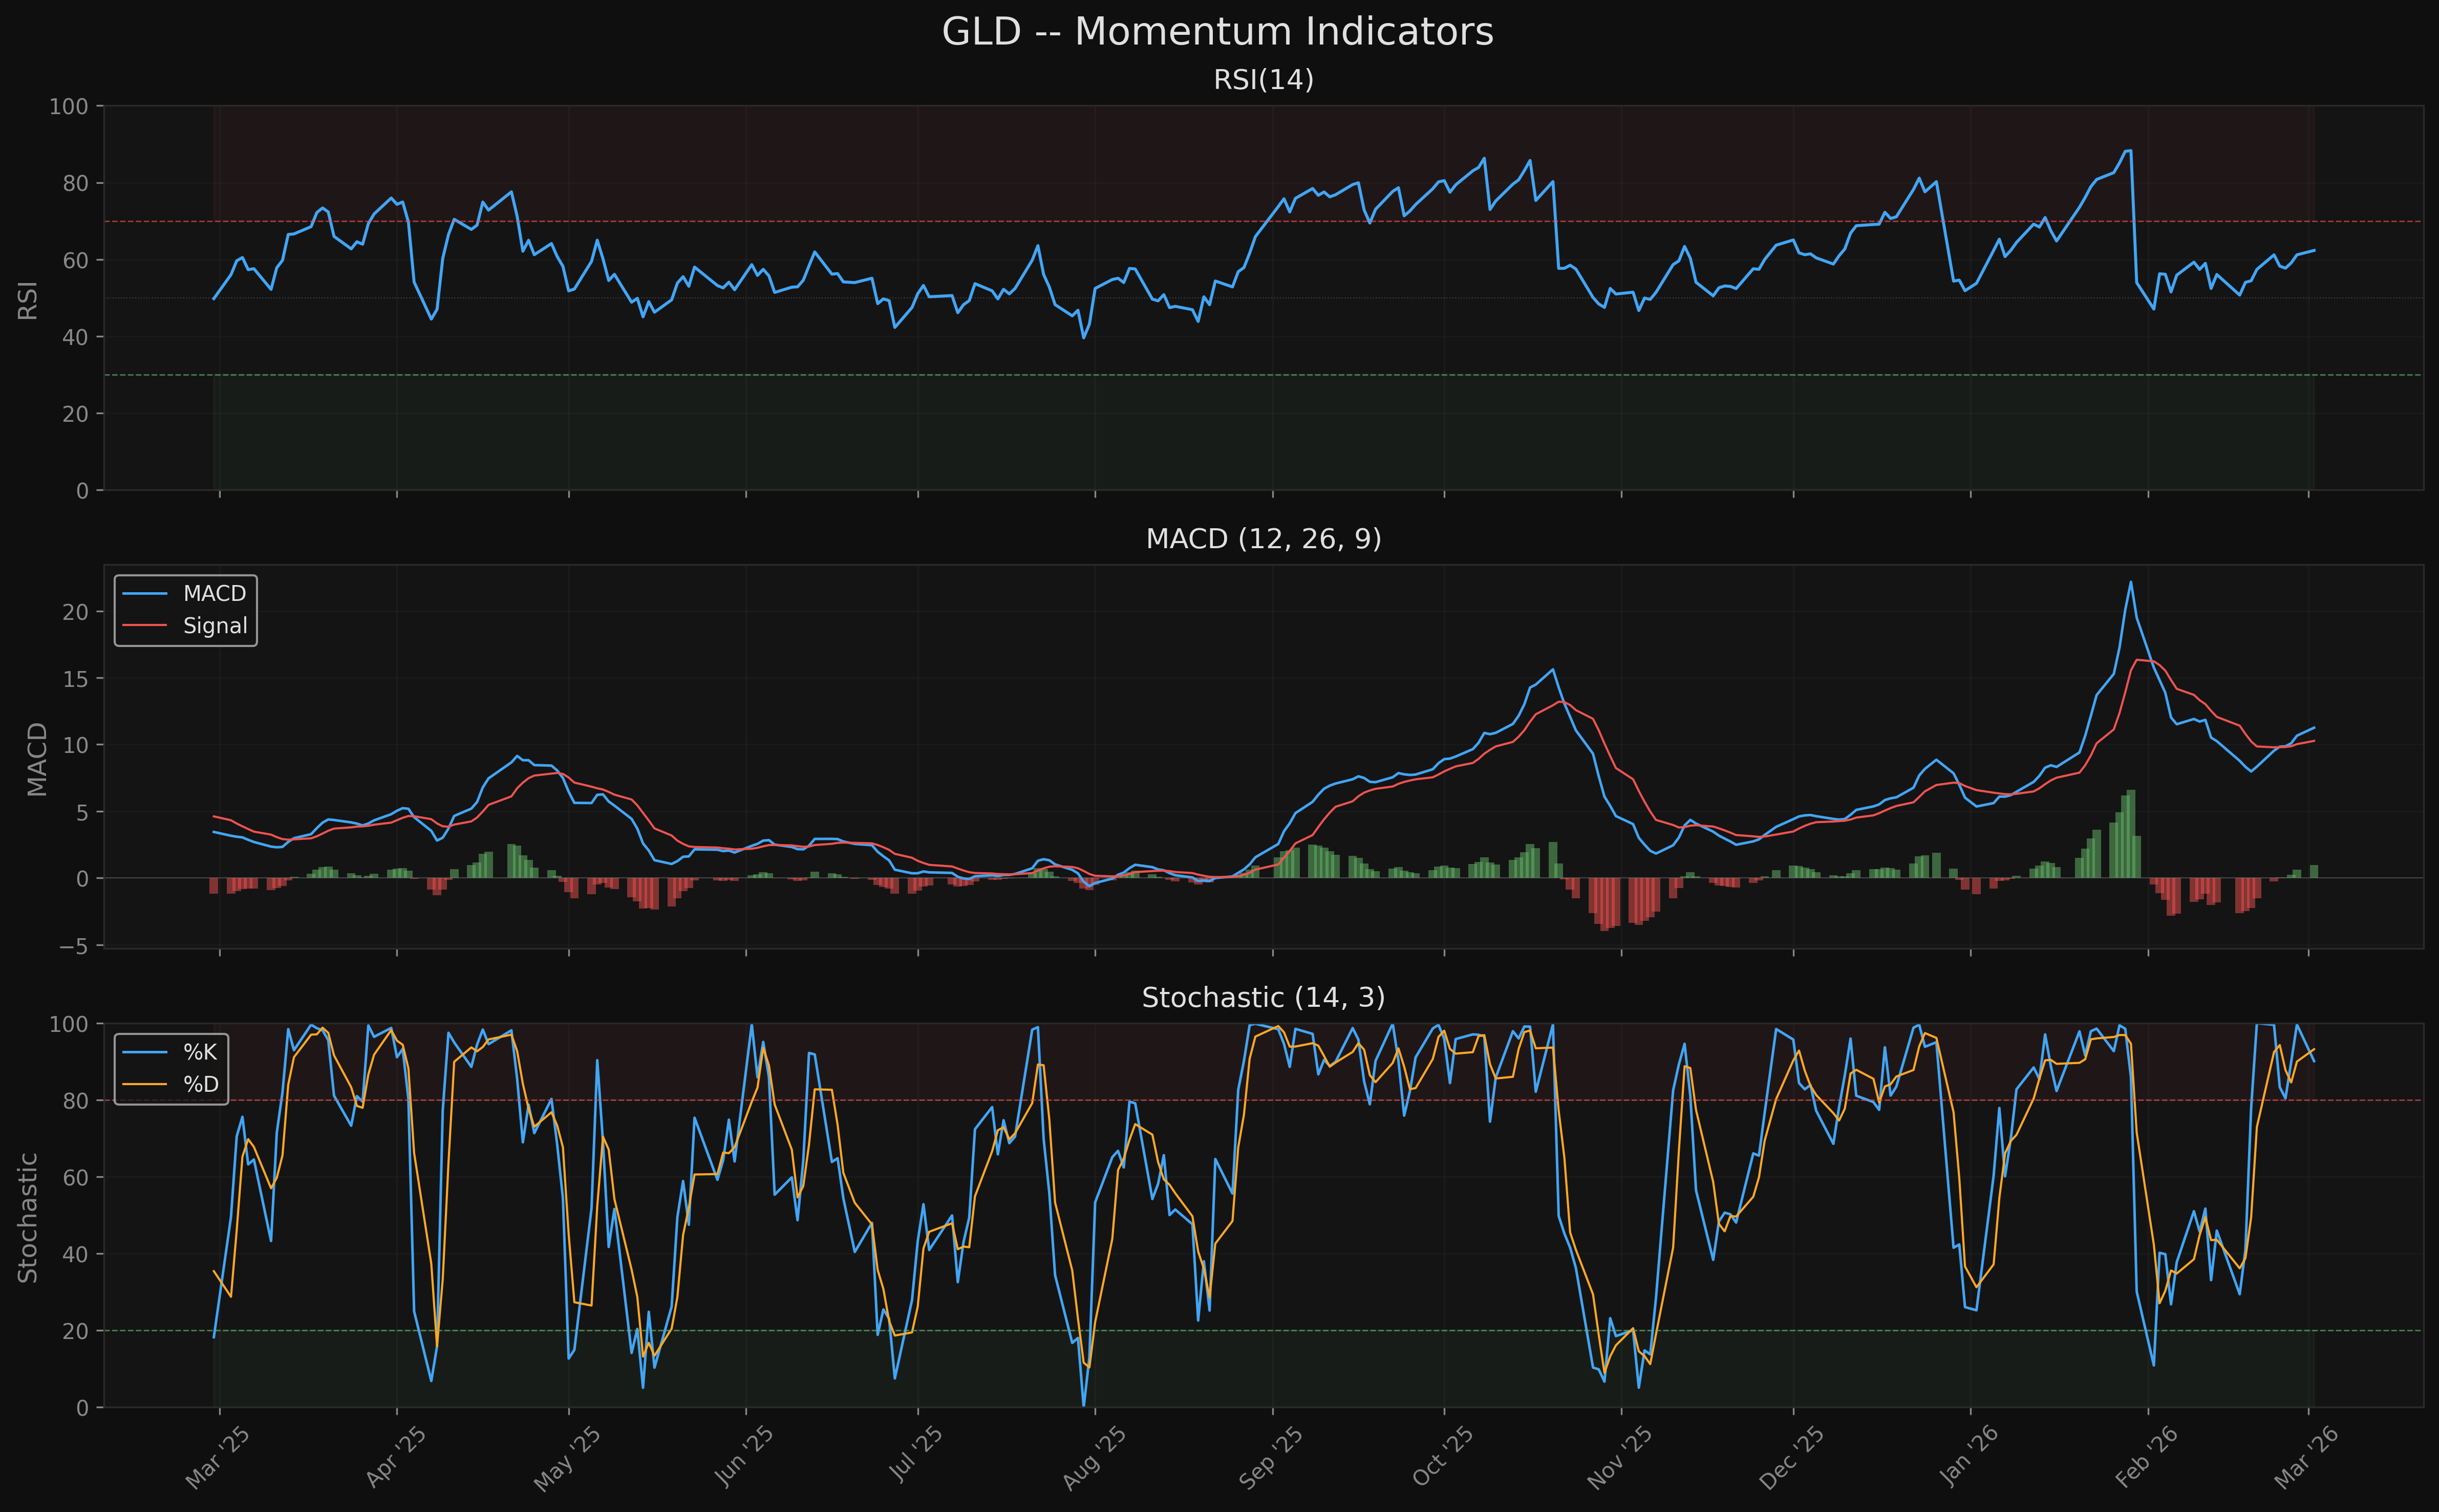
5. Momentum Analysis
RSI (14-period)
| Metric | Value |
|---|---|
| Current RSI(14) | 62.31 |
| 5 days ago | 61.16 |
| 20-day average | 56.34 |
RSI at 62.31 is in the healthy bullish zone (50-70) but not overheated. The 20-day average of 56.34 has been trending higher, consistent with the uptrend.
RSI Divergence (30-day): Bearish. Over the past 30 trading days, price has risen while RSI has trended lower. This is a classic bearish divergence signal, suggesting the rally's internal momentum is weakening even as price makes new highs. Divergences of this nature on a 30-day window are a cautionary signal but not an immediate reversal trigger -- they often precede consolidation rather than sharp reversals in strong trends.
MACD (12, 26, 9)
| Metric | Value |
|---|---|
| MACD Line | 11.2562 |
| Signal Line | 10.2710 |
| Histogram | 0.9852 |
| Position | Bullish (MACD > Signal) |
| Last Cross | Bullish, 2026-02-24 (6 days ago) |
| Histogram Trend | Expanding |
MACD is bullish with a recent crossover just 6 days ago and an expanding histogram. This is a favorable near-term signal -- the bullish crossover is fresh, suggesting the current rally leg has room to run. MACD values are well above zero, confirming the intermediate-term uptrend.
Stochastic (14, 3)
| Metric | Value |
|---|---|
| %K | 90.12 |
| %D | 93.22 |
| Position | %K < %D (Bearish cross) |
| Zone | Overbought (>80) |
The stochastic oscillator is deep in overbought territory. The %K line at 90.12 has crossed below %D at 93.22, forming a bearish crossover within the overbought zone. In strong uptrends, the stochastic can remain overbought for extended periods, but this configuration suggests the near-term rally is mature and a pullback is likely before the next leg higher.
Momentum Summary
Momentum is mixed at the indicator level. MACD is freshly bullish with an expanding histogram (positive), but the stochastic is overbought with a bearish cross (negative), and a 30-day RSI divergence is developing (cautionary). The overall reading is bullish with near-term exhaustion risk.
6. Moving Average Analysis
Current Positioning
| Moving Average | Value | Price Distance | 20-Day Slope |
|---|---|---|---|
| SMA(20) | $462.81 | +5.27% | +5.95% |
| EMA(20) | $465.94 | +4.56% | -- |
| SMA(50) | $440.68 | +10.56% | +7.55% |
| EMA(50) | $443.62 | +9.83% | -- |
| SMA(100) | $410.02 | +18.82% | +6.11% |
| EMA(100) | $414.74 | +17.47% | -- |
| SMA(200) | $363.15 | +34.16% | +4.53% |
| EMA(200) | $375.18 | +29.85% | -- |
MA Stack Order
Price($487.20) > EMA20($465.94) > SMA50($440.68) > SMA100($410.02) > SMA200($363.15)
This is a perfect bullish stack. All moving averages are properly ordered from shortest to longest, and price sits above all of them. Every moving average has a positive 20-day slope, confirming the trend is accelerating rather than decelerating.
Key Crosses
- Golden Cross: Active. SMA(50) crossed above SMA(200) on 2023-12-04. This golden cross has been in effect for over 2 years, reflecting the long-duration bull market in gold.
Slope Analysis
All moving average slopes are positive and increasing: - SMA(20) slope at +5.95% over 20 days is the steepest, reflecting the recent acceleration - SMA(200) slope at +4.53% over 20 days confirms the long-term trend is healthy
Distance from MAs
Price is +5.27% above SMA(20) and +34.16% above SMA(200). The distance from SMA(200) is notably wide and suggests mean reversion risk on a secular basis, though gold can sustain extreme deviations from long-term averages during structural repricing events (as seen in 2020 and again in 2024-2026).
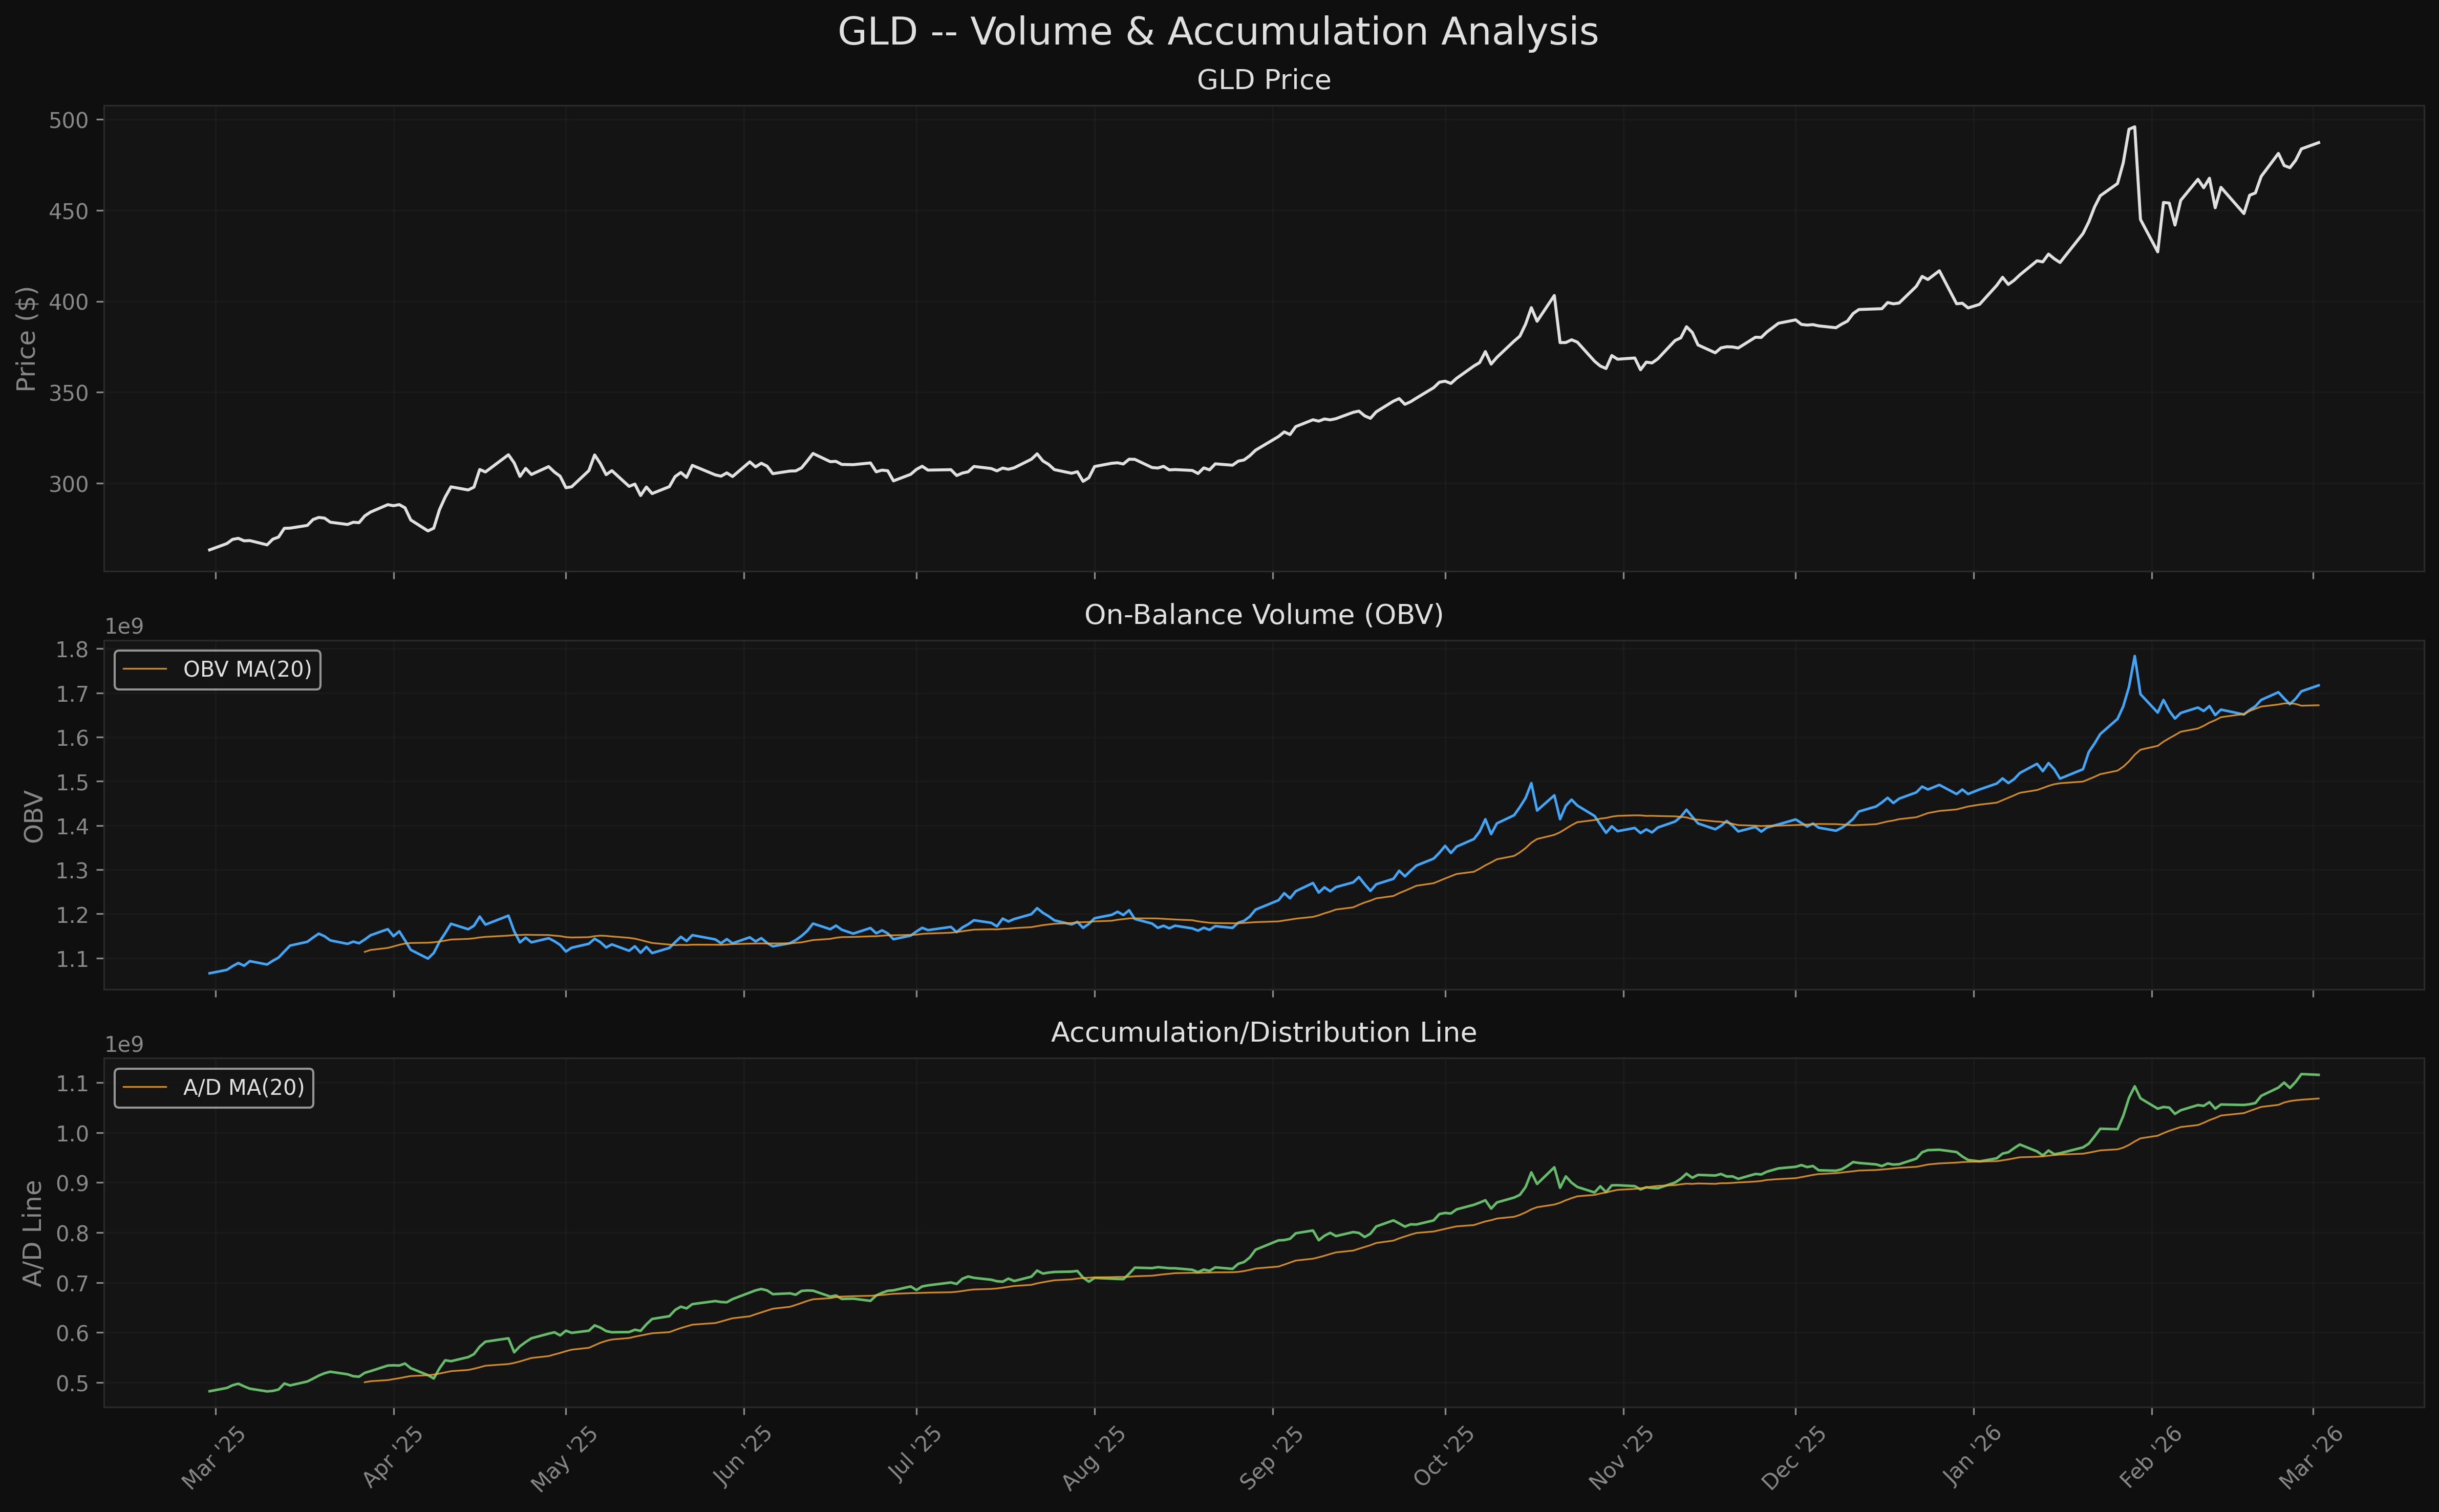
7. Volume Analysis
Volume Statistics
| Metric | Value |
|---|---|
| Current Volume | 13,512,982 |
| 20-Day Average | 16,024,674 |
| 50-Day Average | 19,246,692 |
| Volume Ratio (Current/20d) | 0.84x |
| 20d MA Volume Slope (60d) | +47.2% |
Current volume is below the 20-day average (0.84x), but the 60-day volume slope of +47.2% indicates that overall participation has been increasing significantly over the past two months. This is consistent with a rally attracting broader interest.
On-Balance Volume (OBV)
OBV is rising, with the current reading at 1,717,171,582 versus 1,697,078,300 twenty days ago. Over the past 60 days, OBV slope confirms the price trend -- this is a "Confirming" signal with no divergence.
Accumulation/Distribution Line
The A/D line trend over the past 20 days is "Accumulation," indicating that more volume is occurring on up-close days at favorable price locations. This supports the thesis that institutional money is flowing into GLD.
Up/Down Volume Ratio
The 20-day up/down volume ratio stands at 1.13, meaning there is 13% more volume on up days than down days. While positive, this is modest -- strong rallies typically show ratios above 1.5. This suggests the rally is steady rather than euphoric.
Volume Assessment
Volume indicators broadly confirm the uptrend. OBV confirms, A/D shows accumulation, and the 60-day volume trend is sharply higher. The only mild concern is the below-average current day volume and a modest up/down ratio, but these are not disqualifying signals.
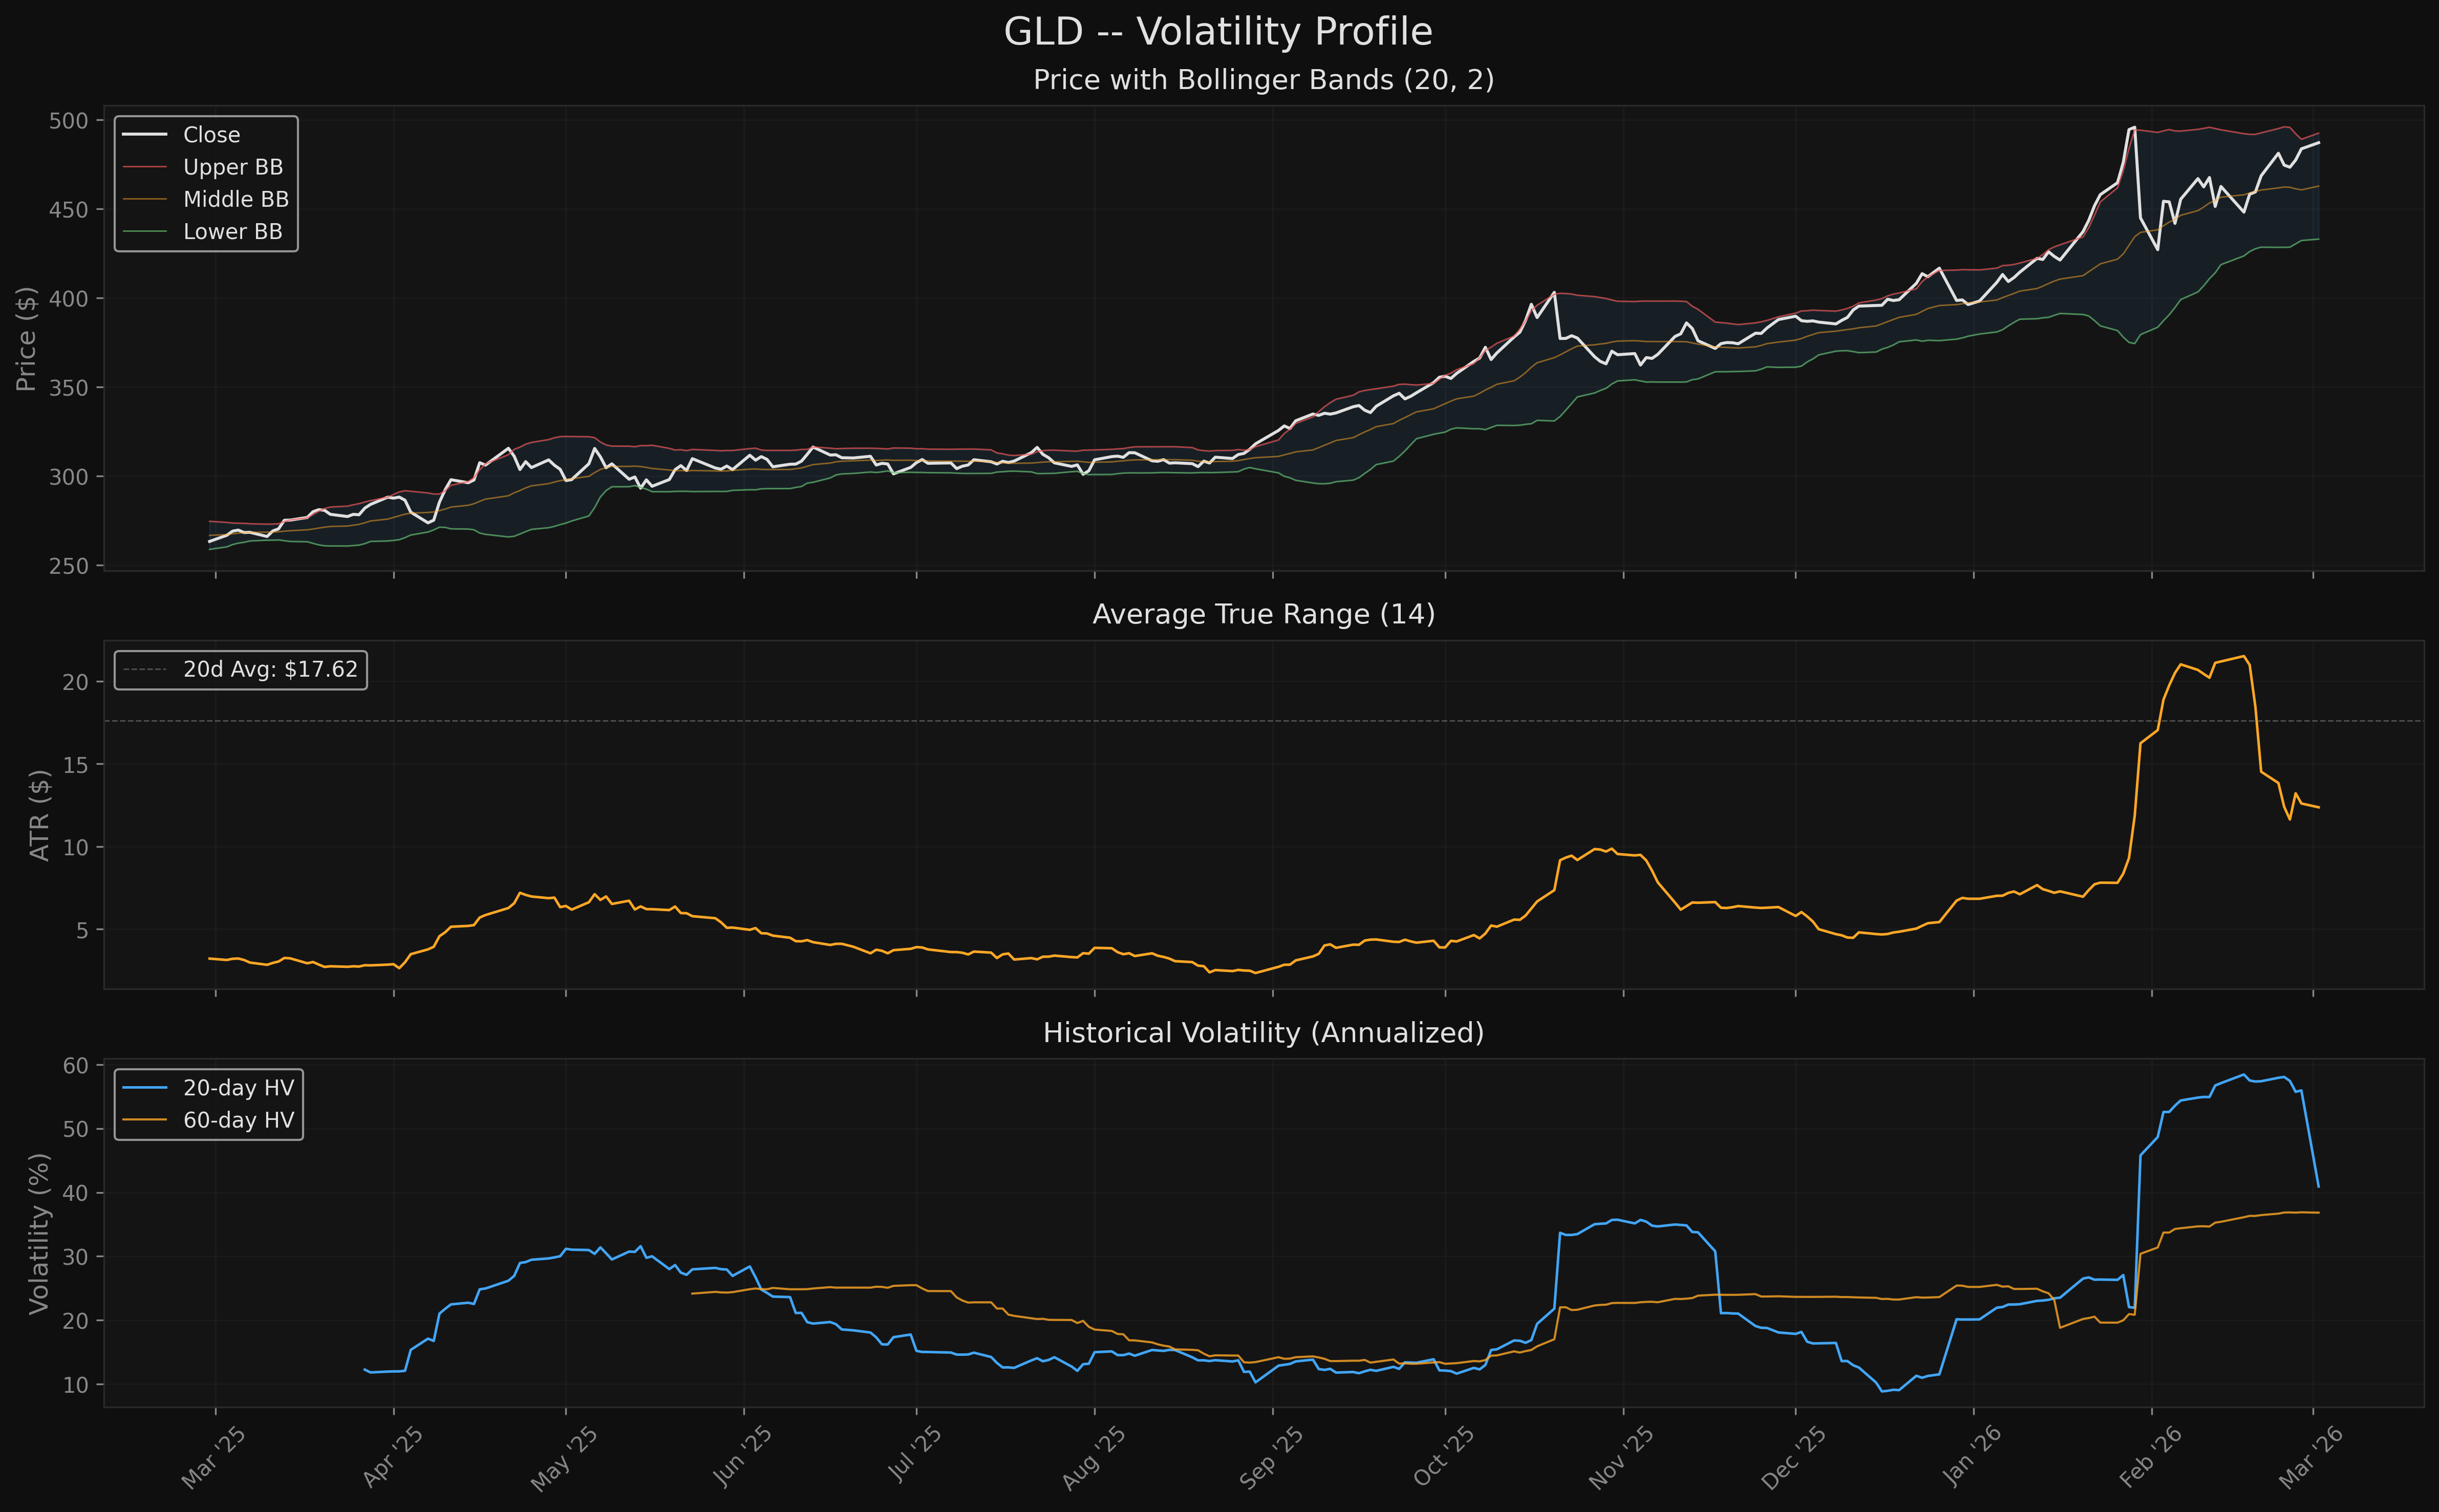
8. Volatility Profile
Average True Range (ATR)
| Metric | Value |
|---|---|
| ATR(14) | $12.37 |
| ATR as % of Price | 2.54% |
| 20-Day ATR Average | $17.62 |
| ATR Percentile (1yr) | 92nd |
The current ATR of $12.37 represents 2.54% of price. The 20-day ATR average is higher at $17.62 due to the sharp Feb 26 intraday swing (high of $477.83, low of $442.04 -- a 7.5% intraday range). The 1-year ATR percentile at 92nd indicates GLD is experiencing historically elevated short-term volatility.
Bollinger Bands (20, 2)
| Band | Value |
|---|---|
| Upper | $492.57 |
| Middle (SMA20) | $462.81 |
| Lower | $433.05 |
| Width | 12.86% |
| %B Position | 91.0% |
The %B position of 91.0% means price is near the upper Bollinger Band, indicating the rally is stretched relative to its 20-day mean. Band width at 12.86% is wide, reflecting the elevated volatility environment.
Historical Volatility (Annualized)
| Window | HV |
|---|---|
| 20-day | 40.92% |
| 60-day | 36.82% |
| 252-day | 25.57% |
The 20-day HV at 40.92% is 60% above the 252-day HV of 25.57%, confirming an elevated short-term volatility regime. For context, gold (via GLD) has historically traded with annualized volatility in the 12-18% range during quiet periods, making the current 40.92% reading exceptionally high.
Return Distribution (1-Year)
| Statistic | Value |
|---|---|
| Skewness | -1.2343 |
| Excess Kurtosis | 8.3855 |
| Mean Daily Return | +0.2551% |
| Max Daily Gain | +6.36% |
| Max Daily Loss | -10.27% |
The return distribution is notably left-skewed (-1.23) with very high kurtosis (8.39). This means: - Large negative returns are more frequent and severe than large positive returns - Tail events are much more common than a normal distribution would predict - The max daily loss (-10.27%) is 1.6x the max daily gain (+6.36%)
This is a distribution that rewards trend-following but demands strict risk management. The fat left tail means drawdowns can be sudden and sharp.
Volatility Regime
Elevated. The 20-day HV exceeds the 252-day HV by more than 30%, placing GLD in an elevated volatility regime. This is consistent with the large intraday swings observed in late February 2026 (including the Feb 26 flash crash and recovery). Elevated volatility regimes in gold tend to persist for 2-4 weeks before mean-reverting.
9. Entry Point Assessment
Confluence Zones (Ranked by Risk/Reward)
Zone 1: SMA(20) Pullback -- $458 to $467 (Best R:R) - SMA(20) at $462.81 has been reliable support in this uptrend - EMA(20) at $465.94 adds confluence - 23.6% Fibonacci retracement of the 52-week range sits at $451.97, nearby - R:R to $500 target: approximately 1:3.5 with stop at $440 - This is the primary accumulation zone for new positions
Zone 2: Current Level Breakout -- $483 to $492 (Moderate R:R) - Recent price action shows support at $483.28 (today's low) - Feb 27 low at $479.11 acts as near-term support - Risk: extended from SMA(20), limited room to ATH - R:R to $509.70 target: approximately 1:1.5 with stop at $462 - Acceptable for adds to existing positions, not ideal for new entries
Zone 3: SMA(50) Deep Pullback -- $435 to $445 (Highest R:R, Lower Probability) - SMA(50) at $440.68 would represent a healthy correction - Feb 26 intraday low of $442.04 proved buyers defend this level aggressively - R:R to $500 target: approximately 1:5 with stop at $415 - Requires patience; would only trigger on a significant macro shock
Entry Ranking
- Zone 1 (SMA20 pullback) -- Best balance of probability and reward
- Zone 3 (SMA50 deep pullback) -- Best absolute R:R but lower probability
- Zone 2 (Current levels) -- Acceptable only as a trend continuation add
10. Risk/Reward Framework
Scenario 1: Trend Continuation to ATH (Base Case)
- Entry: $465.00 (SMA20 pullback)
- Stop Loss: $440.00 (below SMA50)
- Target 1: $500.00 (psychological resistance)
- Target 2: $509.70 (ATH)
- Risk: $25.00 (5.4%)
- Reward (T1): $35.00 (7.5%)
- Reward (T2): $44.70 (9.6%)
- R:R (T1): 1:1.4
- R:R (T2): 1:1.8
- Assessment: Favorable. The trend is strong, and pullbacks to SMA(20) have consistently found buyers. The primary risk is a macro shock that violates SMA(50).
Scenario 2: Breakout Above ATH (Bull Case)
- Entry: $510.00 (confirmed break above $509.70)
- Stop Loss: $490.00 (below breakout zone)
- Target 1: $528.00 (127.2% Fibonacci extension)
- Target 2: $551.00 (161.8% Fibonacci extension)
- Risk: $20.00 (3.9%)
- Reward (T1): $18.00 (3.5%)
- Reward (T2): $41.00 (8.0%)
- R:R (T1): 1:0.9
- R:R (T2): 1:2.1
- Assessment: Wait for confirmed breakout with volume. R:R to T1 is marginal, but T2 offers 2:1. The Fibonacci extension targets of $528 and $551 are derived from the recent swing (high $509.70, low $442.04, range $67.66).
Scenario 3: Mean Reversion Correction (Bear Case)
- Trigger: Failure to hold SMA(20) at $462.81
- Target 1: SMA(50) at $440.68 (-9.5% from current)
- Target 2: SMA(100) at $410.02 (-15.8% from current)
- Stop Trigger: Close below SMA(50) for 3 consecutive days
- Assessment: This scenario requires a catalyst (macro shock, real rate spike, USD strength). The max drawdown over the past year was -13.87%, so a correction to SMA(100) is plausible but would be a deep pullback by recent standards.
11. Key Levels Summary
| Level | Price | Type | Description |
|---|---|---|---|
| Fib Extension 161.8% | $551.45 | Resistance | Fibonacci extension target |
| Fib Extension 127.2% | $528.06 | Resistance | Fibonacci extension target |
| ATH / 52wk High | $509.70 | Resistance | All-time high (Jan 29, 2026) |
| Round Number | $500.00 | Resistance | Psychological level |
| Upper BB | $492.57 | Resistance | Bollinger Band ceiling |
| Current Price | $487.20 | -- | -- |
| 5-Day Low | $483.28 | Support | Recent intraday support |
| Feb 27 Low | $479.11 | Support | Near-term support |
| EMA(20) | $465.94 | Support | Short-term trend support |
| SMA(20) | $462.81 | Support | Primary pullback level |
| Fib 23.6% | $451.97 | Support | Fibonacci retracement |
| SMA(50) | $440.68 | Support | Intermediate trend support |
| Feb 26 Intraday Low | $442.04 | Support | Flash crash recovery level |
| Fib 38.2% | $416.25 | Support | Deep retracement |
| SMA(100) | $410.02 | Support | Long-term trend support |
| Fib 50% | $387.39 | Support | Major retracement |
| SMA(200) | $363.15 | Support | Secular trend support |
12. Overall Technical Score
Weighted Composite Breakdown
| Component | Score | Weight | Weighted |
|---|---|---|---|
| Trend Alignment | 10.0 | 25% | 2.50 |
| Momentum | 7.5 | 20% | 1.50 |
| Volume Confirmation | 9.0 | 20% | 1.80 |
| Volatility Profile | 3.5 | 15% | 0.53 |
| Market Structure | 10.0 | 20% | 2.00 |
| OVERALL | 8.3 | 100% | 8.33 |
Component Detail
Trend Alignment (10.0/10): Perfect score. Price is above all key moving averages (SMA 20/50/100/200), all MAs are rising, the bull stack is intact (price > EMA20 > SMA50 > SMA100 > SMA200), and the golden cross has been active since December 2023. There is no aspect of the trend that is not bullish.
Momentum (7.5/10): Strong but with caveats. RSI at 62.31 is in the healthy bullish zone. MACD just completed a bullish crossover with expanding histogram. However, the stochastic is overbought with a bearish cross, and a 30-day bearish RSI divergence is developing. The divergence deducts meaningfully from the score.
Volume Confirmation (9.0/10): Near-perfect. OBV confirms the trend with no divergence. The A/D line shows accumulation. The 60-day volume slope is +47.2%, showing increasing participation. The only minor deduction is the modest up/down volume ratio (1.13 versus the ideal 1.5+).
Volatility Profile (3.5/10): The weakest component by a significant margin. The 20-day HV at 40.92% is elevated (more than 60% above the 252-day figure). Bollinger Band %B at 91% signals overextension. The return distribution is left-skewed (-1.23) with fat tails (kurtosis 8.39). The ATR is at the 92nd percentile on a 1-year basis. This does not mean the trend is broken -- it means the risk per unit of position is high and the distribution of outcomes is unfavorable for new entries at current levels.
Market Structure (10.0/10): Perfect score. The Wyckoff analysis shows 3 of 3 higher highs and 3 of 3 higher lows across the 6-month window. The trend slope is steep and positive. Price sits at 90.8% of its 52-week range. The current drawdown from the high is only -4.41%. This is as clean a Markup phase as the data can produce.
13. Limitations
-
GLD is an ETF, not gold itself. GLD tracks gold spot price via futures and physical holdings. Tracking error, expense ratios, and fund flows can create divergences between GLD and gold, particularly during periods of extreme demand for physical delivery.
-
Elevated volatility distorts indicators. The Feb 26 intraday crash (high $477.83, low $442.04 -- a 7.5% range) has inflated ATR, Bollinger Band width, and historical volatility readings. These may mean-revert quickly, which would improve the volatility score without any change in trend.
-
Macro sensitivity. Gold prices are driven by real interest rates, USD strength, central bank buying, and geopolitical risk. Technical analysis alone cannot capture sudden shifts in these macro drivers. The 2025-2026 gold rally has been fueled by central bank purchases and geopolitical uncertainty -- any change in these drivers could invalidate the technical picture.
-
Negative skewness risk. The -1.23 skewness and 8.39 kurtosis in the 1-year return distribution mean that standard risk metrics (standard deviation, Value-at-Risk assuming normality) understate the true tail risk. The max daily loss of -10.27% is a concrete reminder.
-
Sample size for Wyckoff. The 4-segment swing analysis uses only 6 months of data (approximately 126 bars). While the evidence is clear (3/3 HH and HL), longer consolidation patterns can only be identified with multi-year analysis.
-
Distance from moving averages. Price is 34.16% above SMA(200) and 10.56% above SMA(50). These are extreme extensions. While the trend can persist, mean reversion risk is elevated relative to more modestly stretched markets.
-
Volume data quality. ETF volume does not fully capture gold market activity, which also occurs in futures markets (COMEX), OTC markets, and physical markets globally. GLD volume is a useful but incomplete proxy for gold demand.
Charts
All charts saved to /Users/mikeruthruff/git/signals/analysis/quant-research/charts/:
gld_price_structure.png-- Price with MAs, Fibonacci levels, Bollinger Bands, and volumegld_momentum.png-- RSI, MACD, and Stochastic subplotsgld_volume_accumulation.png-- Price reference with OBV and A/D linegld_volatility.png-- Bollinger Bands, ATR, and historical volatility
Analysis Script
/Users/mikeruthruff/git/signals/analysis/quant-research/scripts/GLD-technical-2026-03-02.py
Charts