GLD
Conviction 5GLD — Combined Deep Dive Assessment
Date: 2026-03-02 Asset Class: Equity (Physical Gold ETF) Ticker: GLD (SPDR Gold Shares)
Fundamental Summary
| Metric | Value |
|---|---|
| Overall Score | 72.1/100 |
| Verdict | GO |
| Red Flags | 2 MEDIUM |
The Market Analyst scored GLD at 72.1/100 with a GO verdict, adapted for ETF structure. Key strengths: world's largest gold ETF ($174-183B AUM), exceptional liquidity (~$8.5B/day), dual custodians (HSBC + JPMorgan) with 100% allocated gold, and record institutional inflows (8 consecutive months of North American inflows, 3,069 institutional holders). Two MEDIUM red flags identified: (1) expense ratio of 0.40% is 4x the cheapest peer GLDM (0.10%), creating a structural 30bp/yr drag, and (2) gold RSI ~74 after +84% 1Y run with spot price exceeding most institutional 2026 targets (JPM $4,753, MS $4,400, UBS $5,000).
Technical Summary
| Metric | Value |
|---|---|
| Overall Score | 8.3/10 |
| Bias | Bullish |
| Red Flags | 3 MEDIUM |
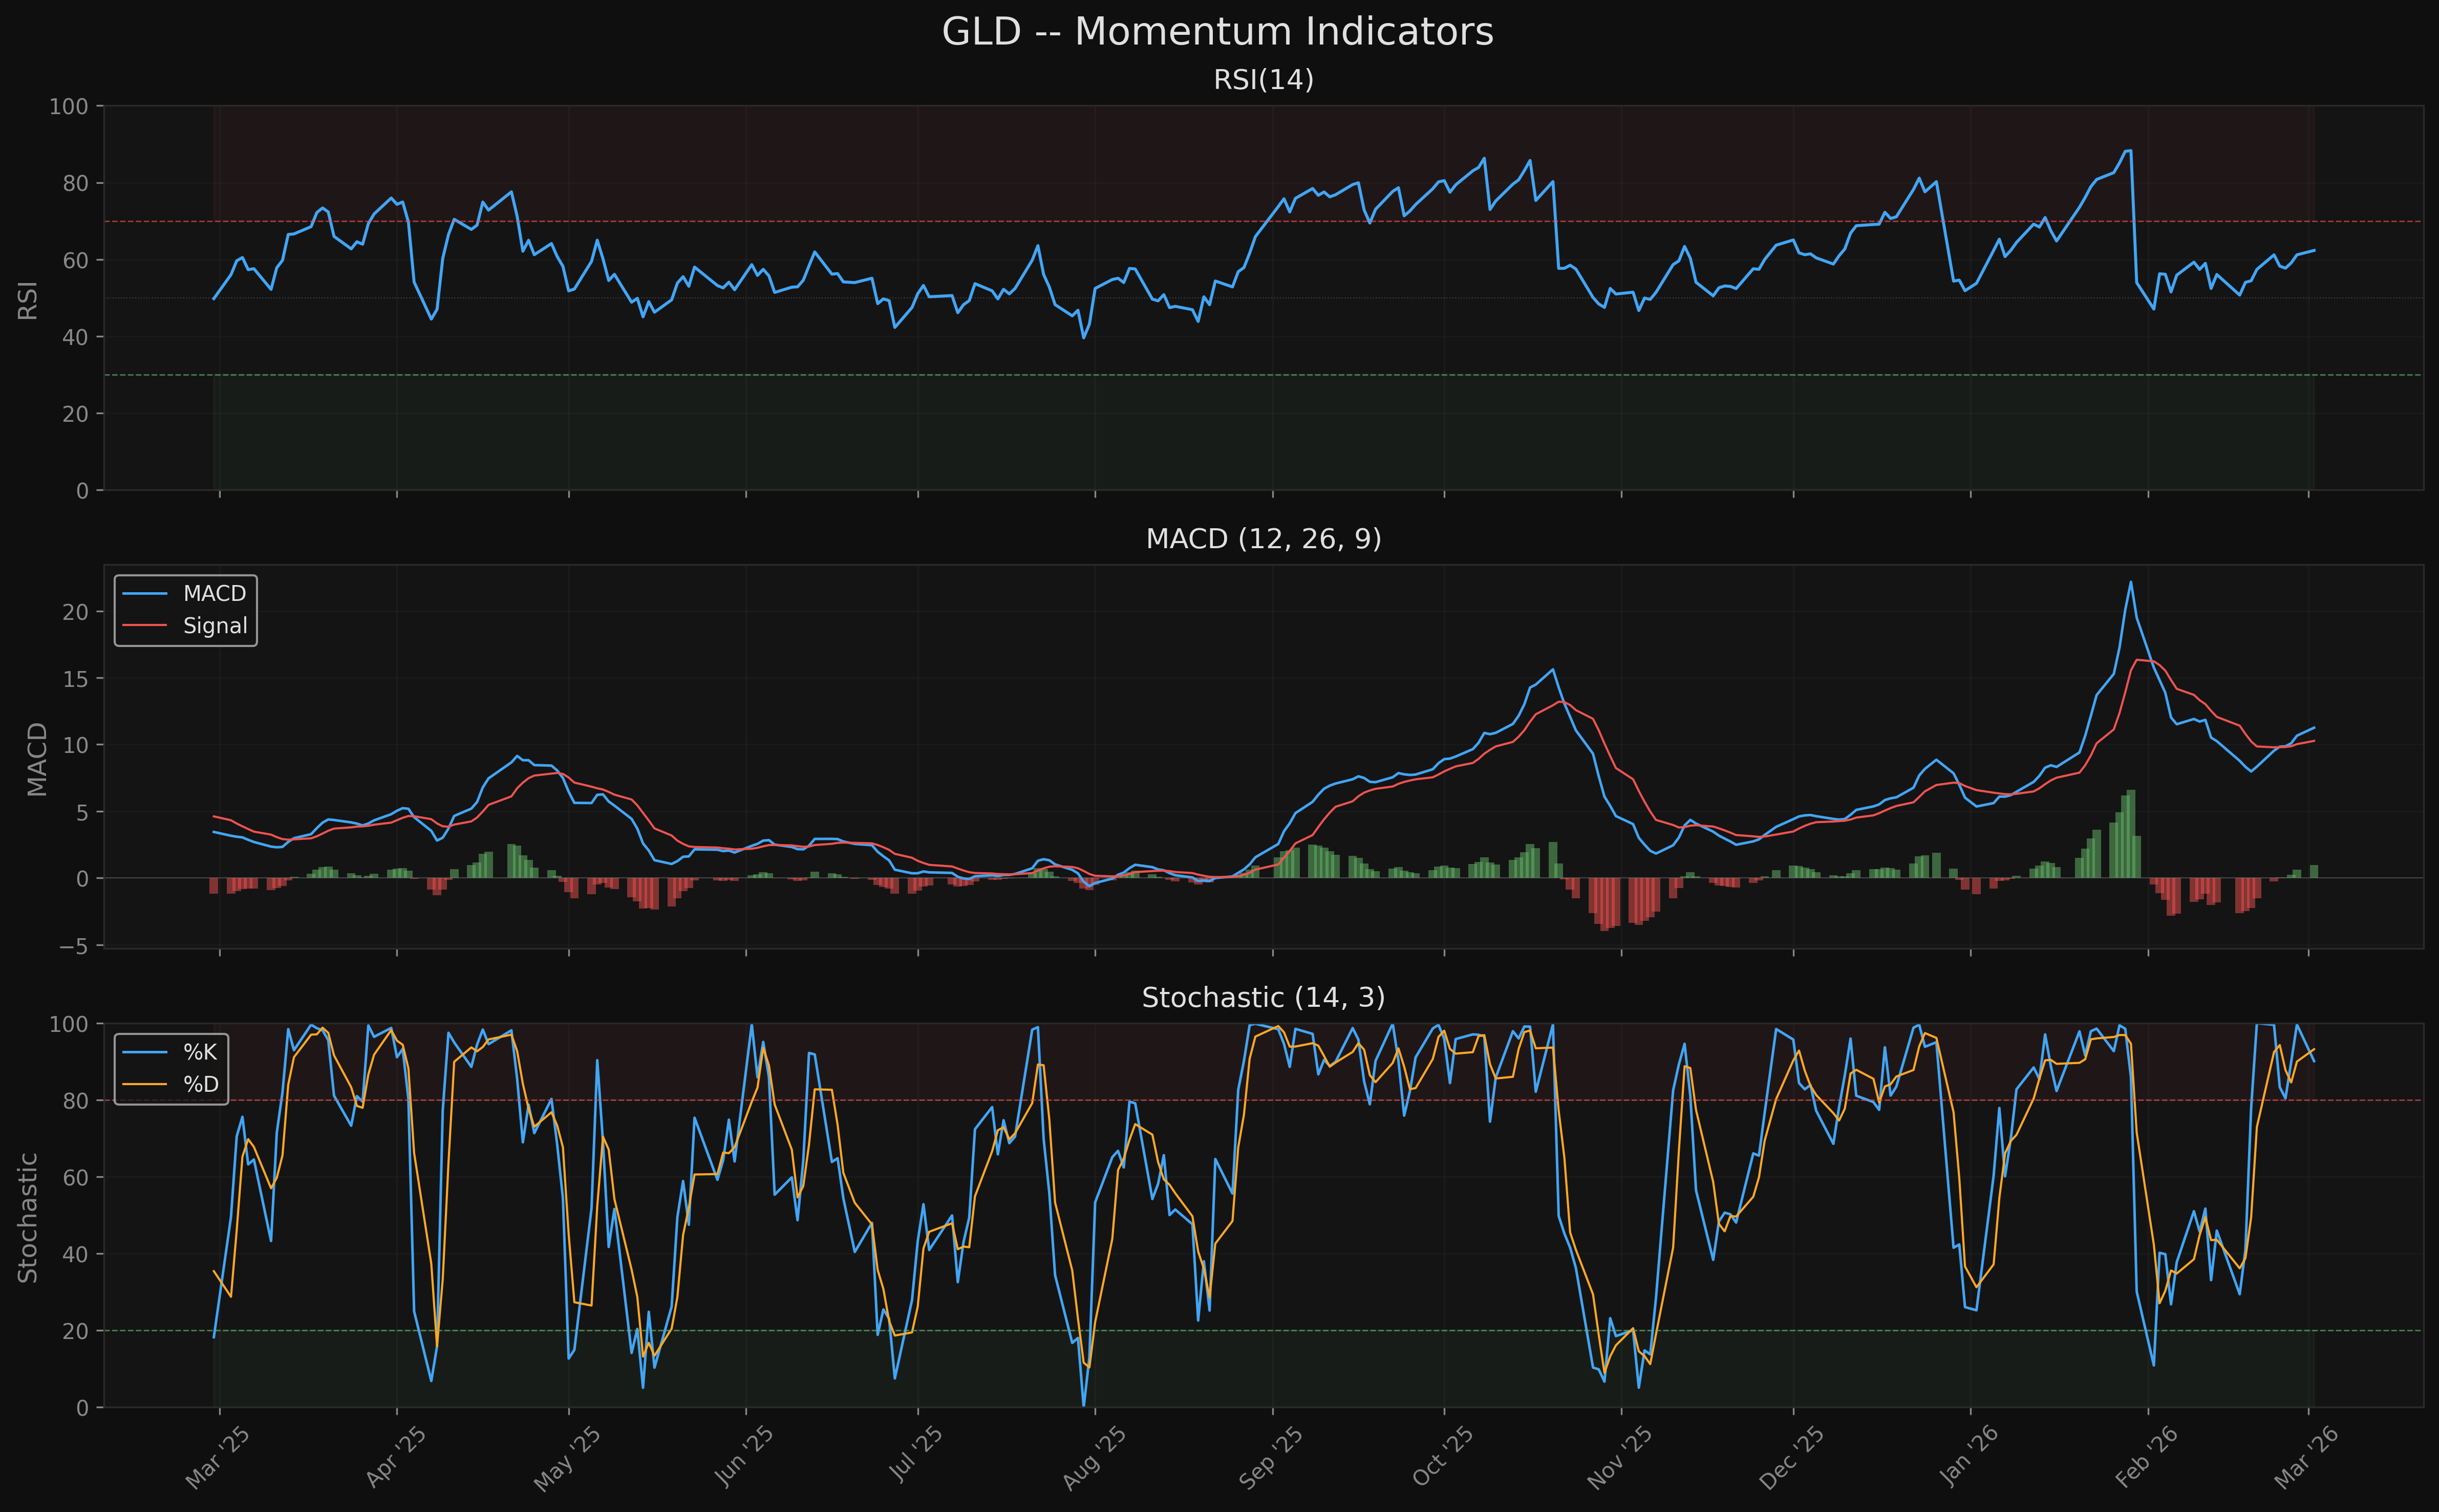
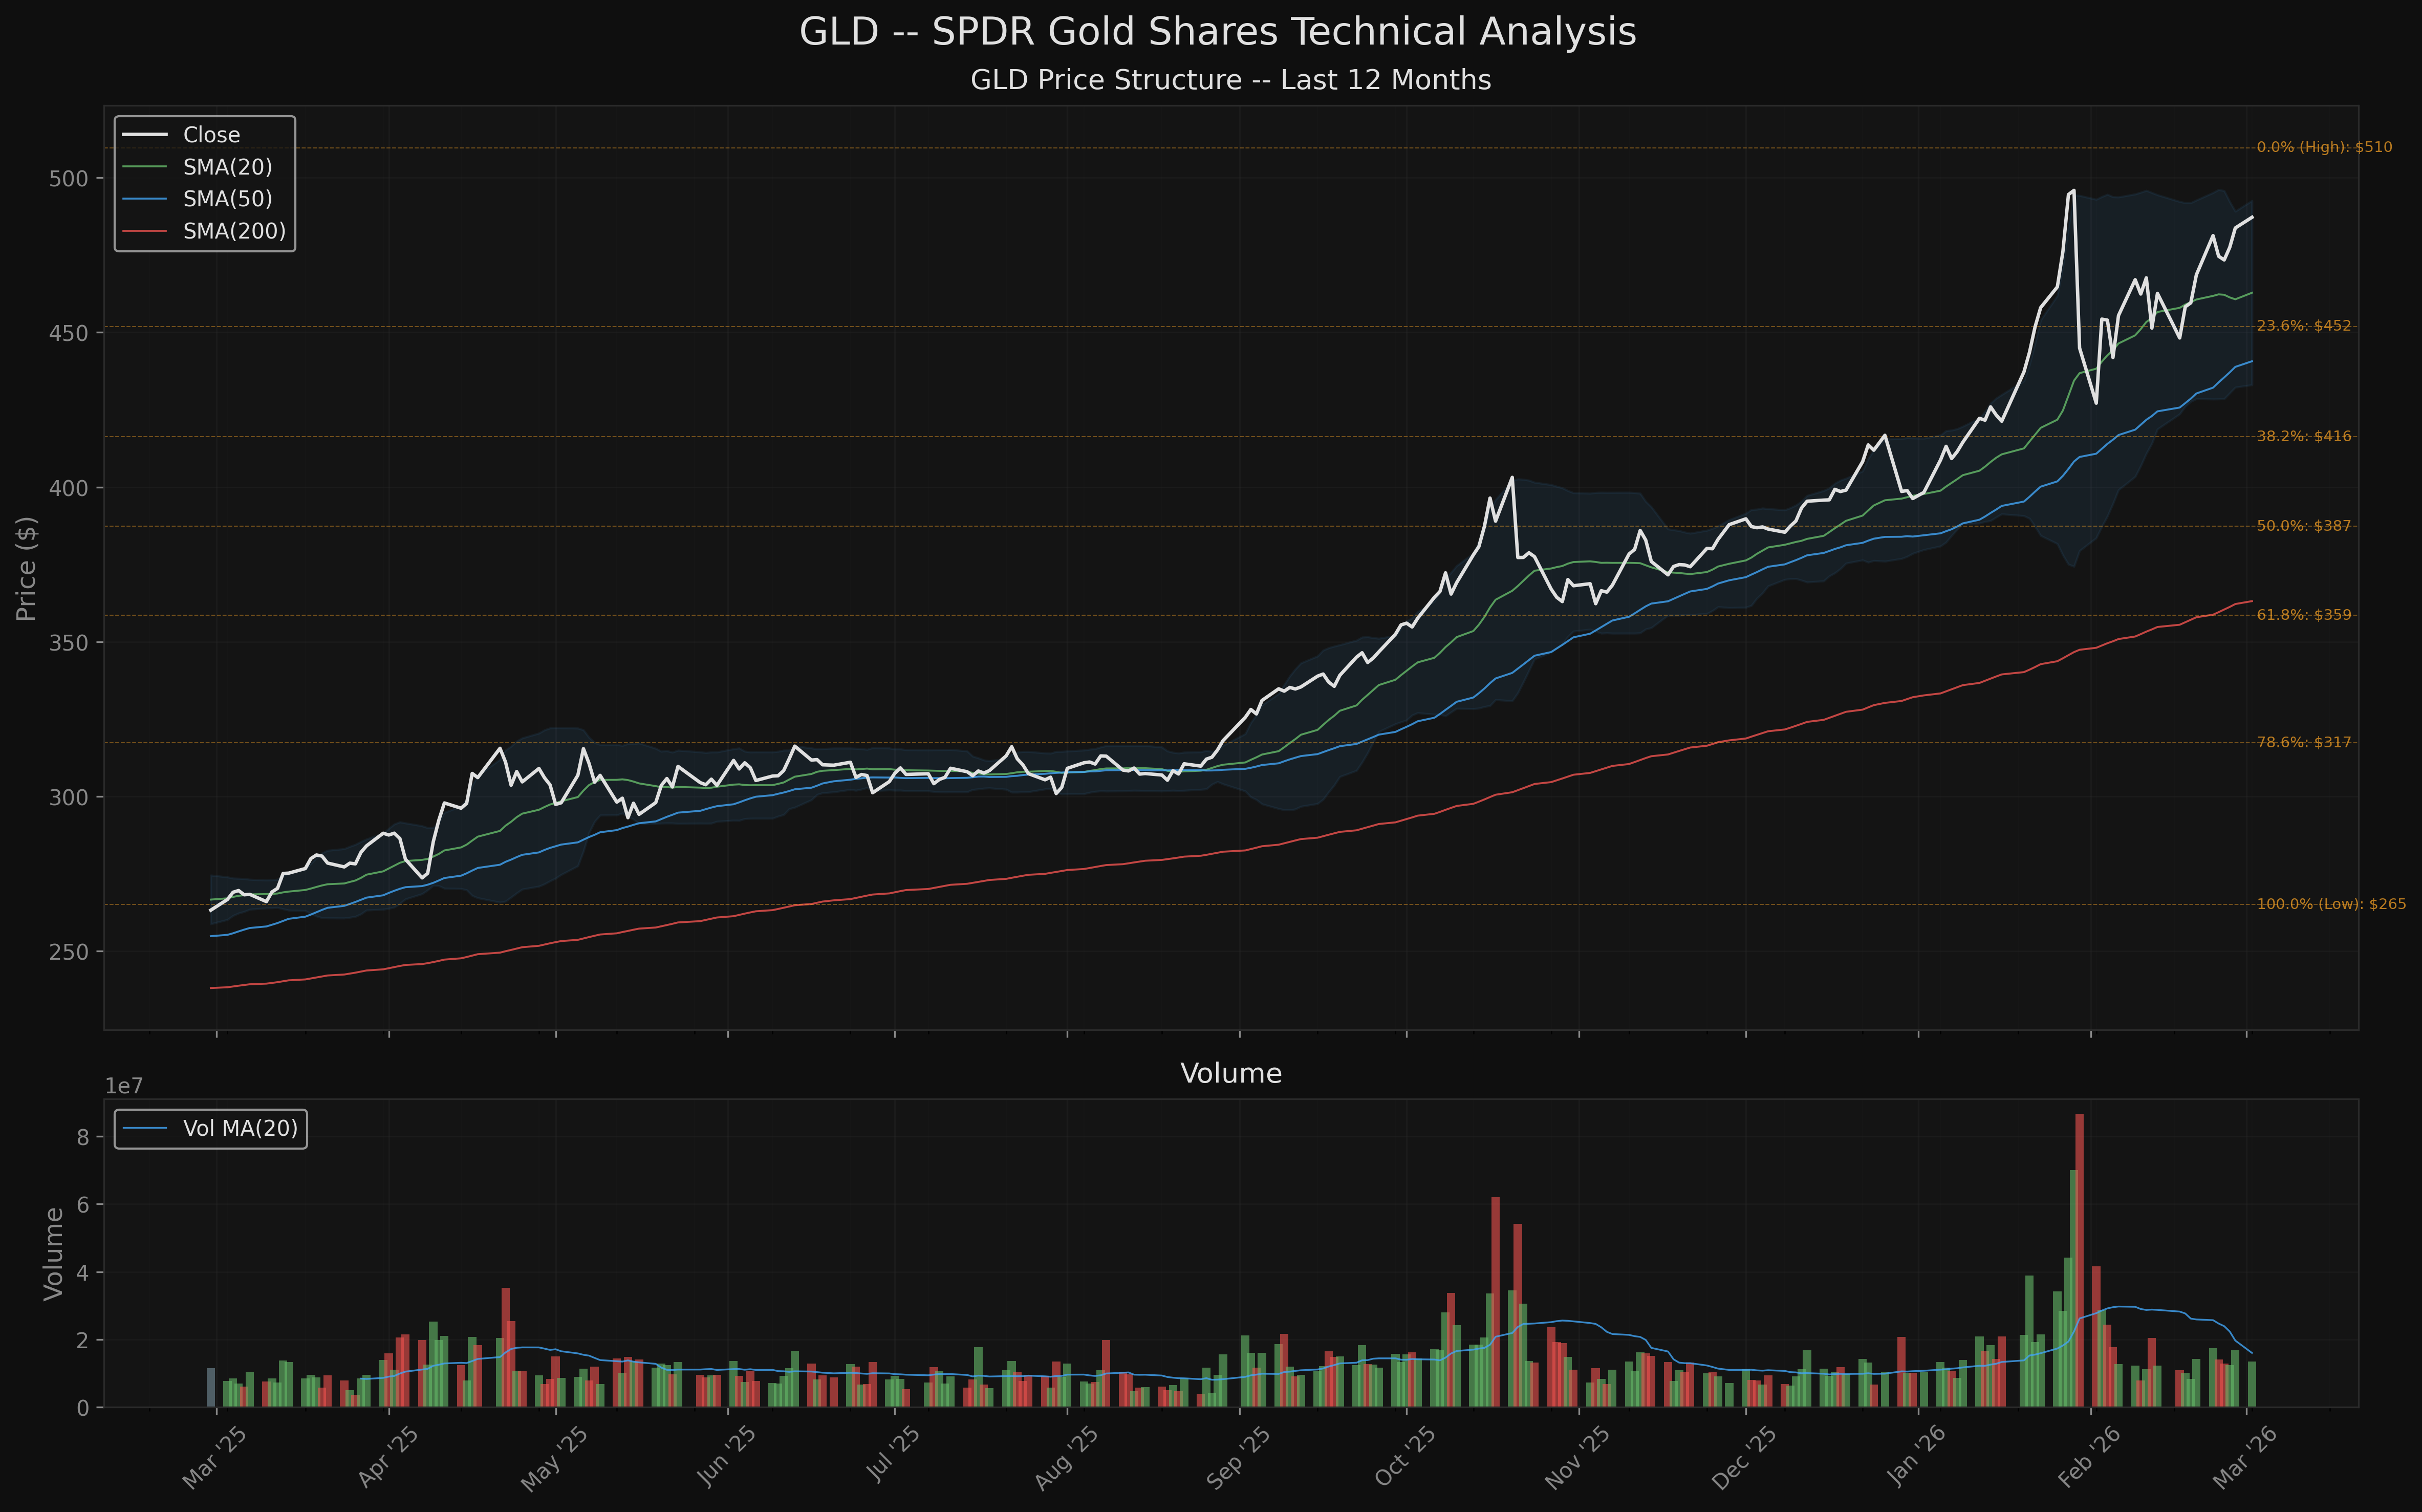
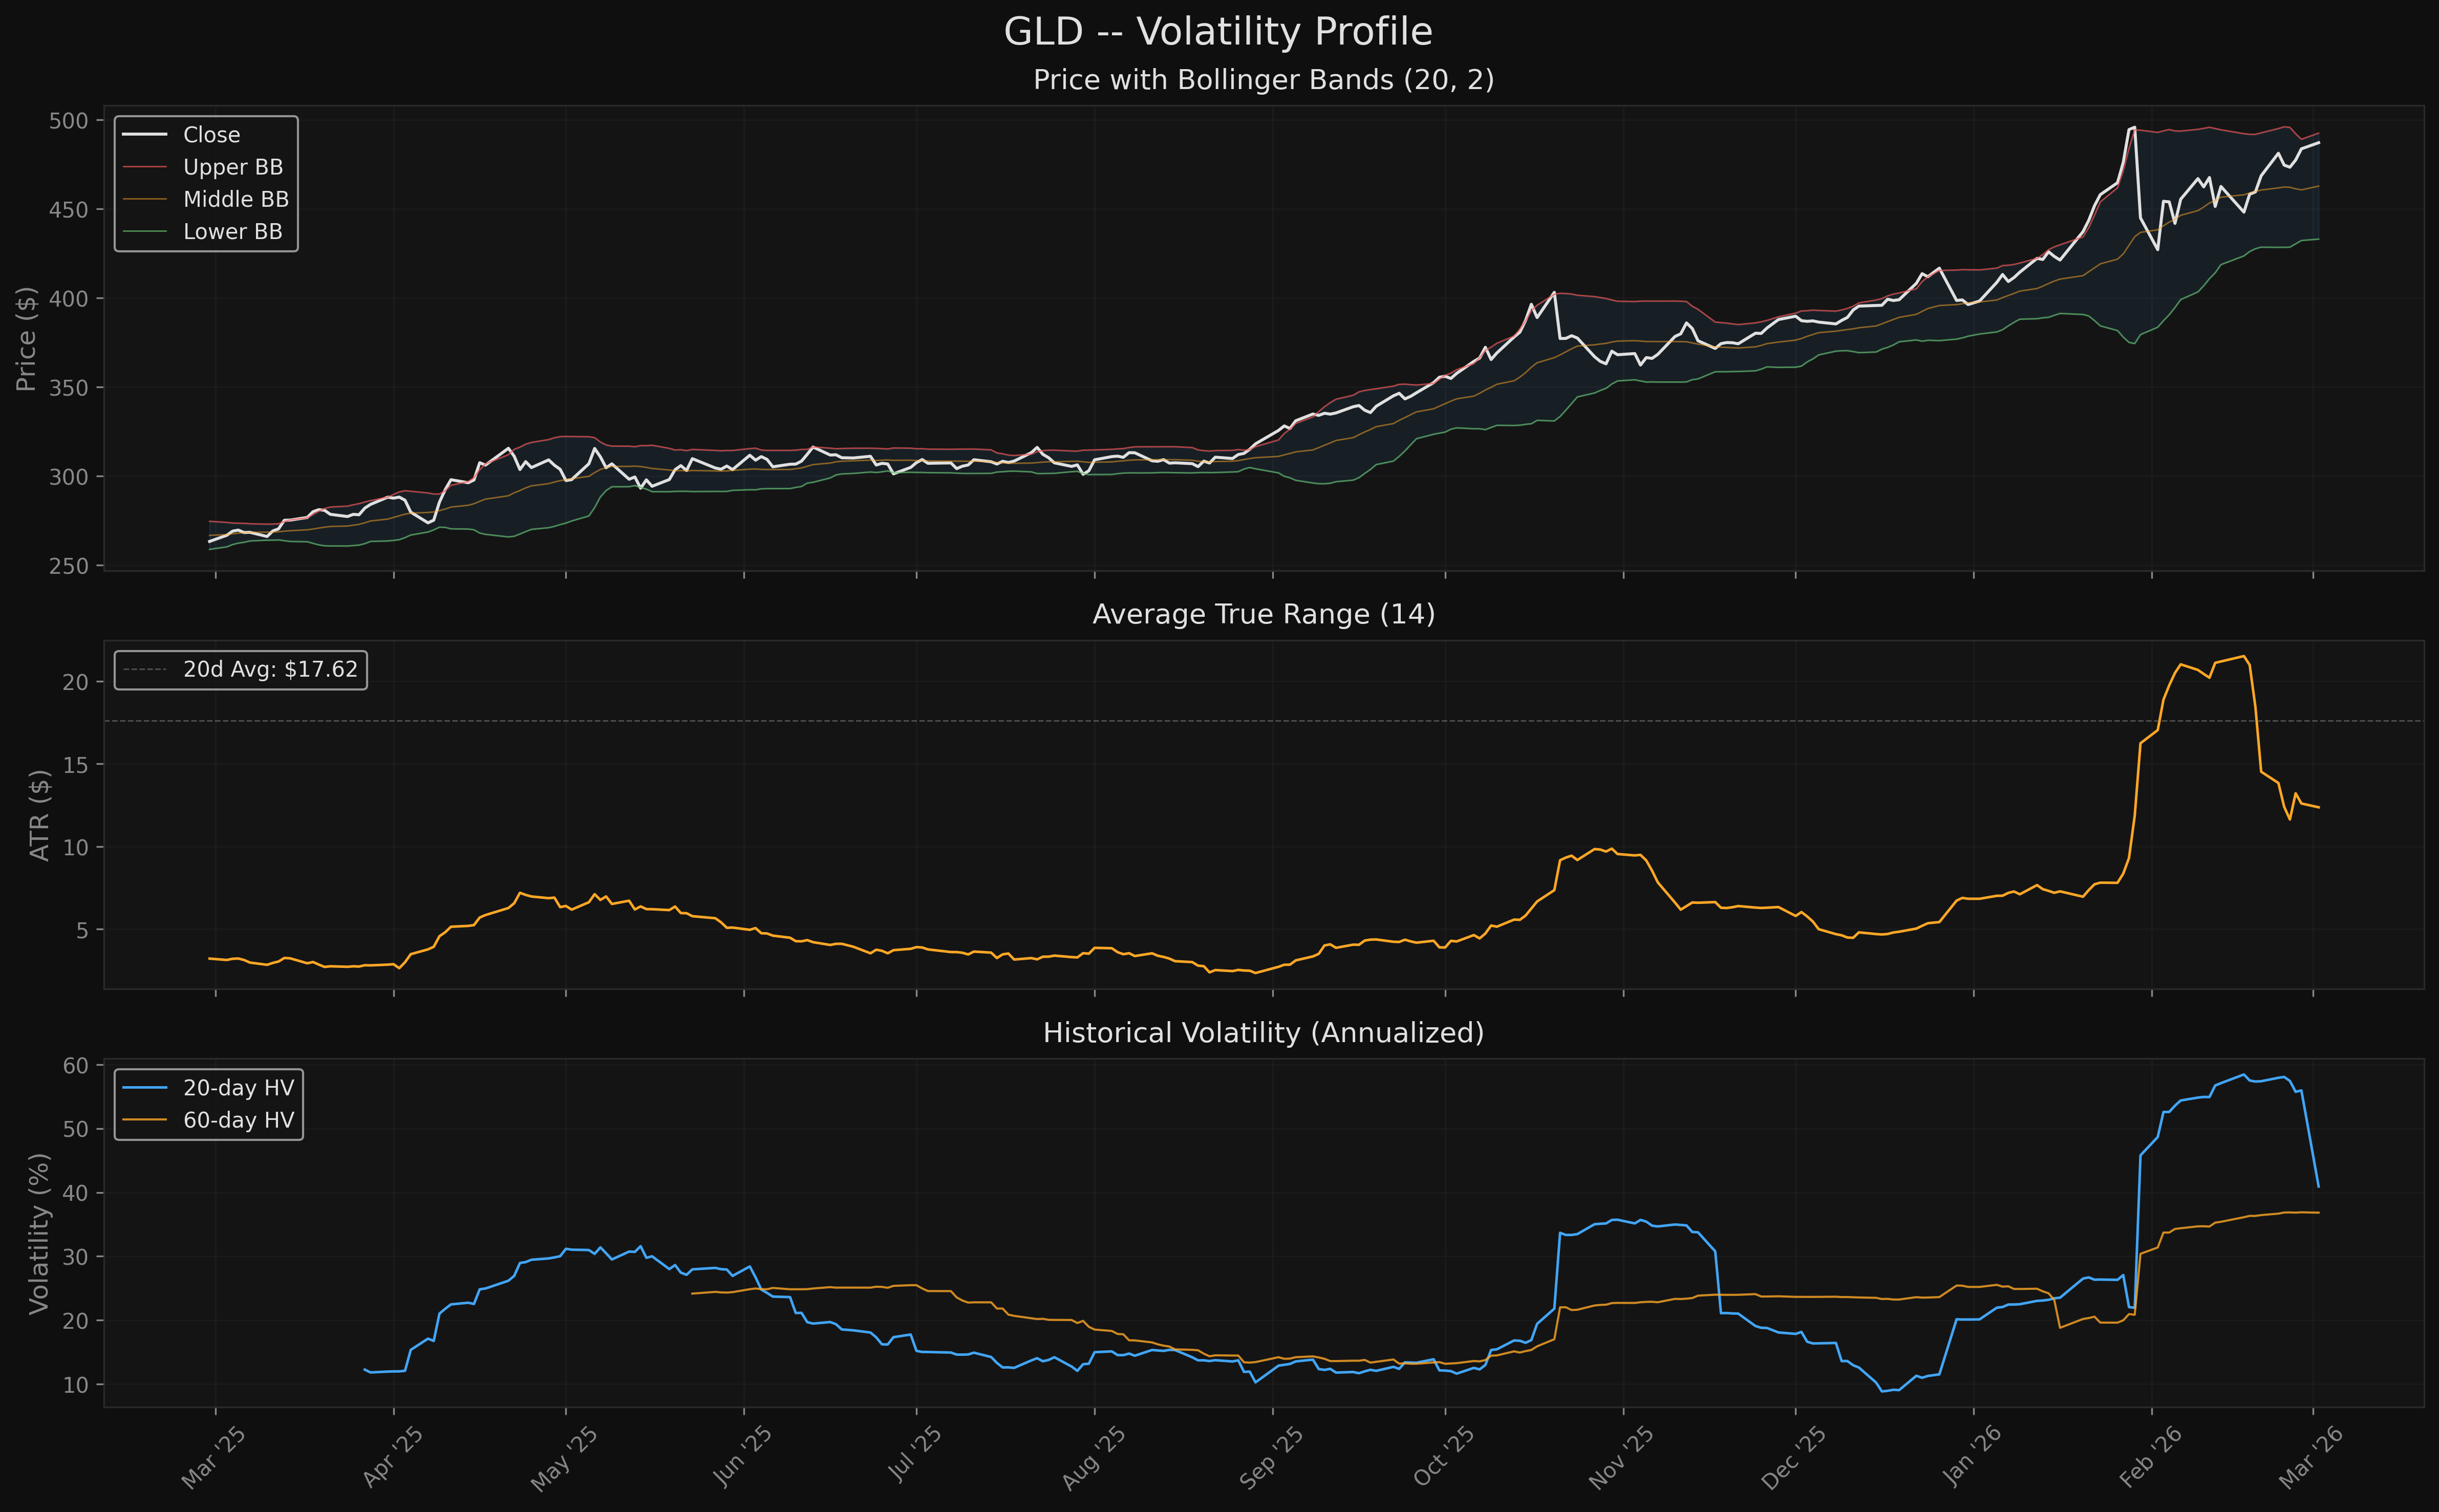
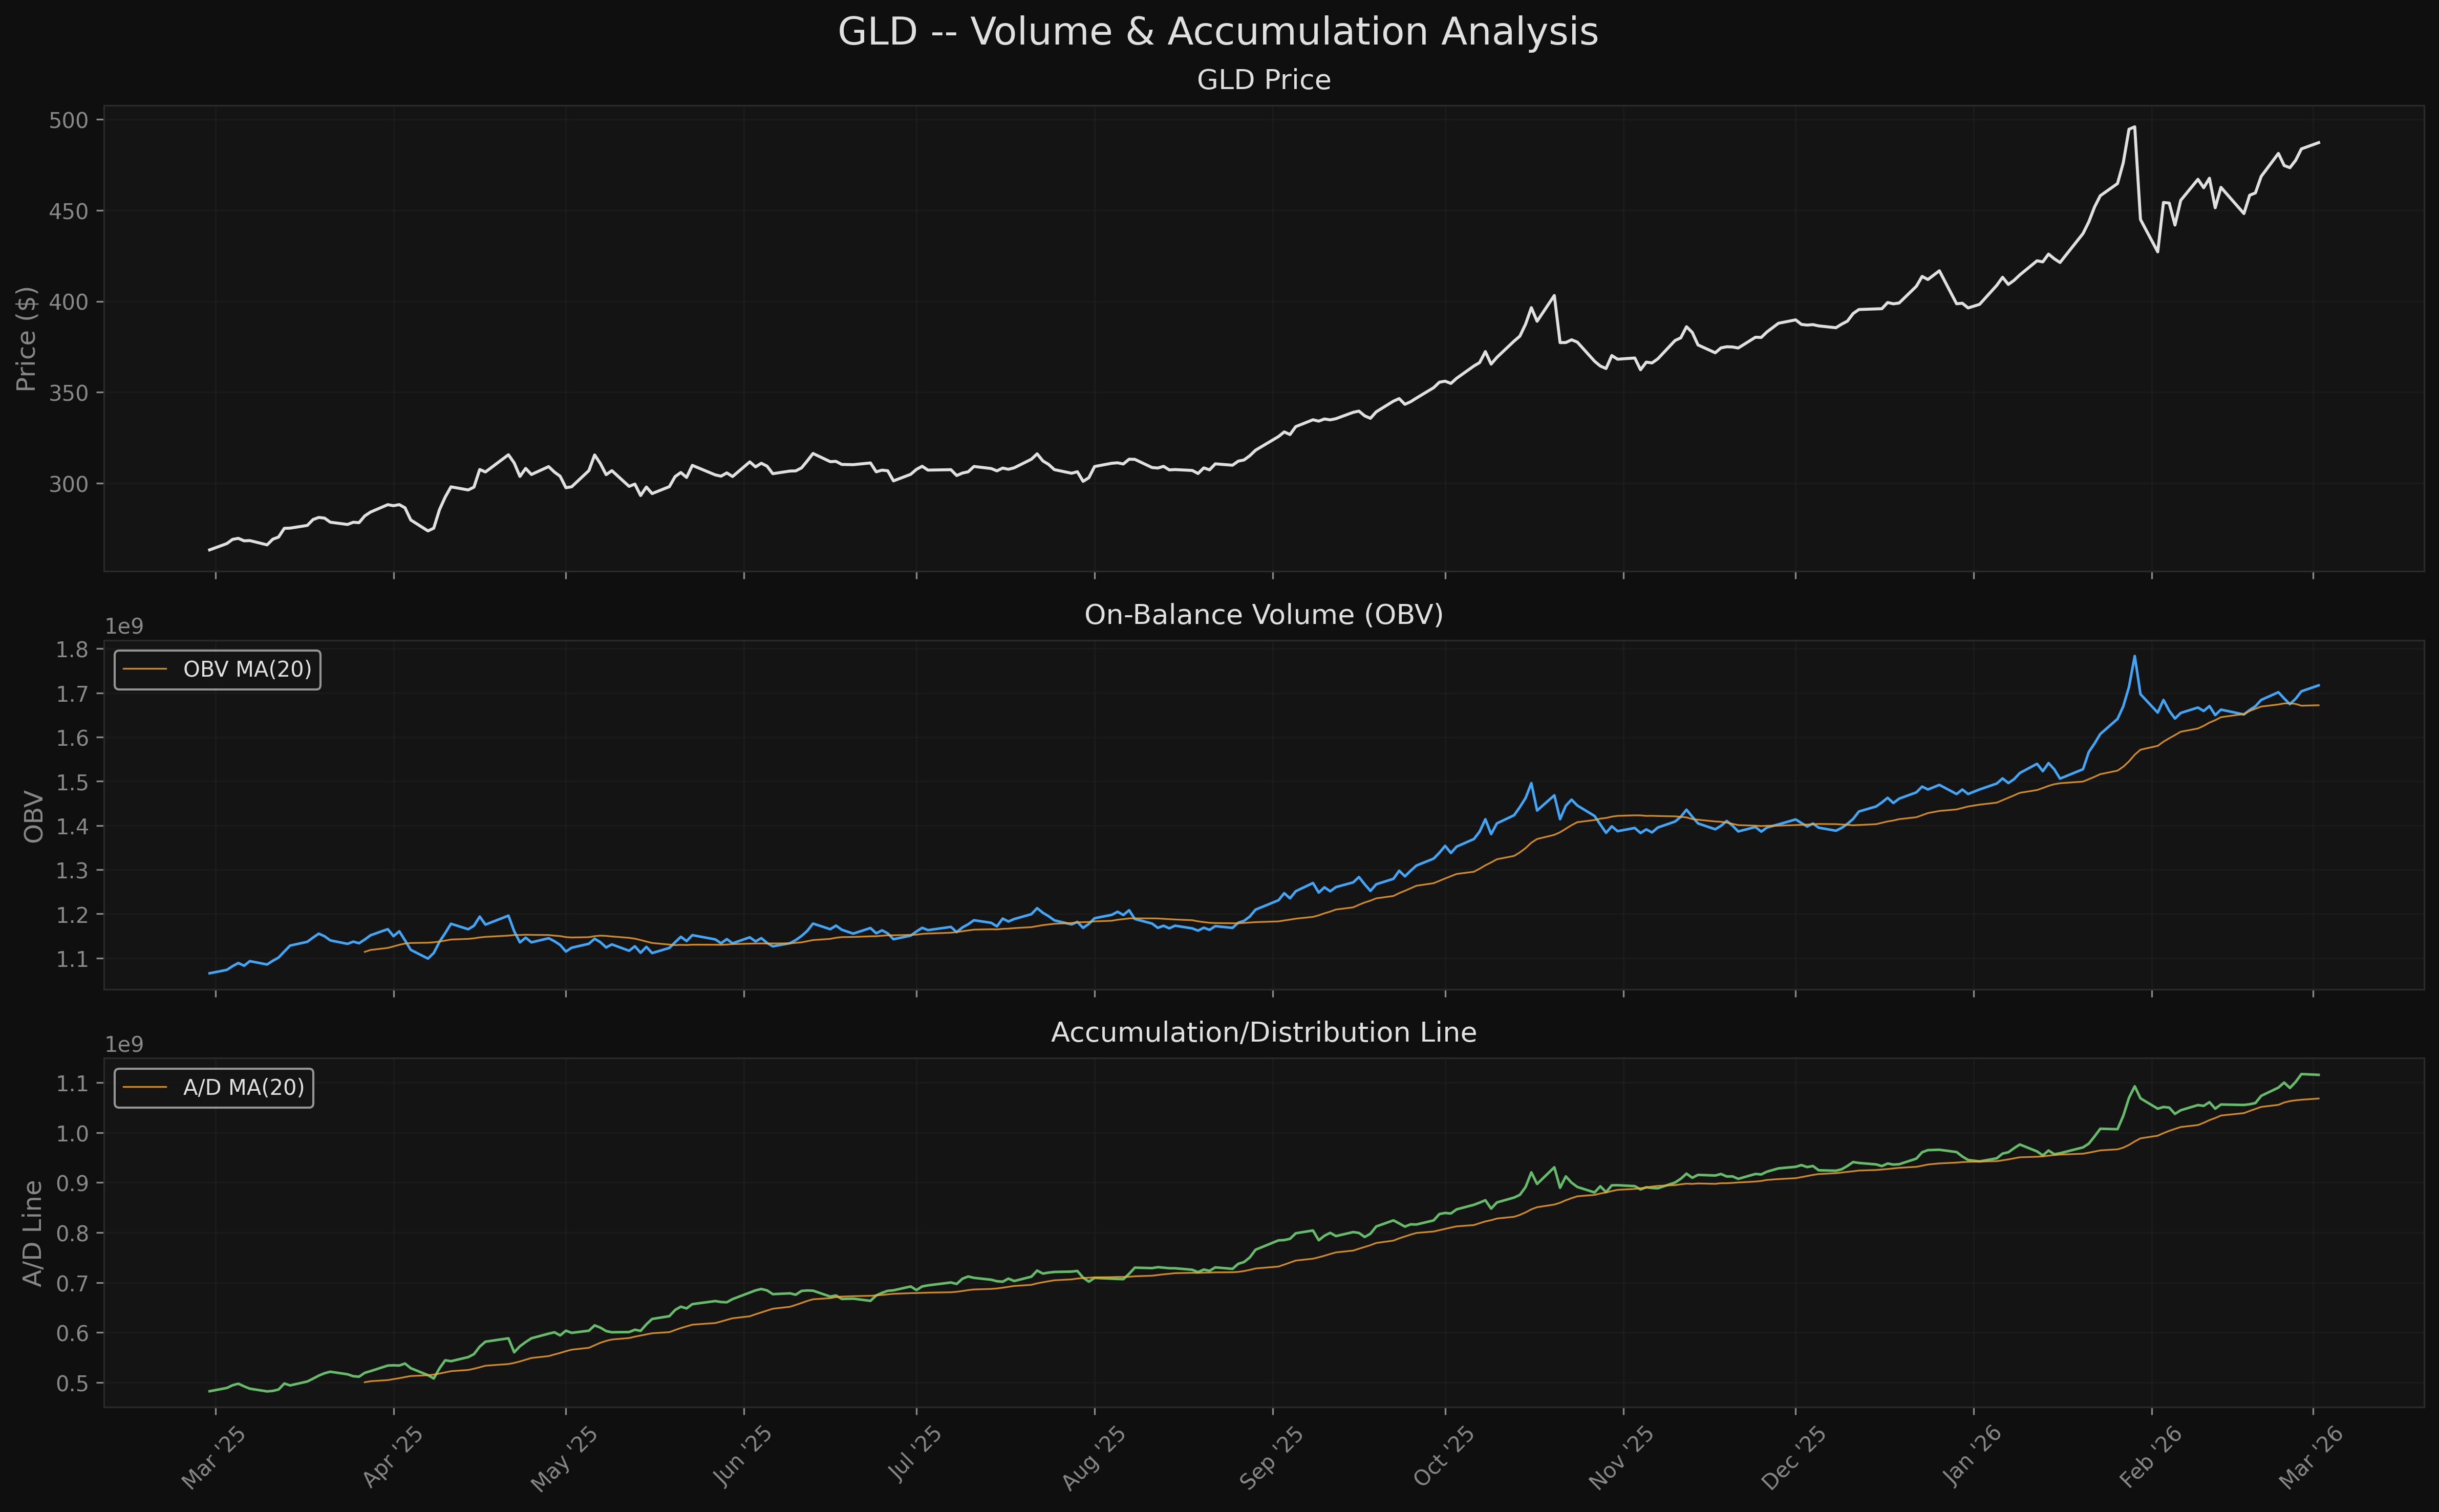
The Quant Researcher scored GLD at 8.3/10 with a Bullish bias. Trend Alignment (10.0/10) and Market Structure (10.0/10) are near-perfect — textbook Markup phase with 3/3 higher highs and higher lows over 6 months, perfect bullish MA stack (price > SMA20 > SMA50 > SMA100 > SMA200), golden cross active since Dec 2023. Volume Confirmation strong at 9.0/10 with OBV and A/D line confirming accumulation. Weakest component is Volatility Profile (3.5/10) — 20-day HV at 40.92% annualized (60% above 1-year figure), negative return skewness (-1.23), excess kurtosis (8.39). Three MEDIUM red flags: bearish RSI divergence (30-day), overbought stochastic (%K=90.12), elevated volatility regime.
AGREEMENT Assessment
Fundamental-Technical Alignment: ALIGNED-BULL
Both analyses independently arrive at a bullish conclusion with near-term caution:
-
Trend direction: Both confirm GLD is in a powerful uptrend. Fundamentals cite structural central bank demand (~755t/year), Fed easing bias, and record ETF inflows. Technicals show a perfect Markup phase with zero structural deterioration across 4 swing segments.
-
Overbought caution: Both flag near-term overextension. Fundamentals note gold at $5,330/oz exceeds most 2026 institutional targets. Technicals show stochastic overbought with bearish crossover, RSI divergence, and elevated volatility.
-
Entry timing: Both implicitly agree that the trend is sound but chasing at current levels is suboptimal. The fundamental base case ($5,000-5,500/oz range) and the technical SMA(20) pullback target ($462.81) both point to buying on pullbacks rather than at current price.
Where they agree most: The structural bull case is intact (central bank buying, Fed easing, geopolitical risk premium). The trend has not broken.
Where they agree on risk: The pace of appreciation (+84% 1Y) is unsustainable. Near-term consolidation is the base case, not a crash.
No meaningful disagreements. This is one of the cleaner fundamental-technical alignments — both views converge on "strong trend, wait for a better entry."
Key Levels
| Level | Price | Source |
|---|---|---|
| Resistance 2 (ATH) | $509.70 | Technical: 52-week high |
| Resistance 1 | $500.00 | Technical: psychological round number |
| Current Price | $487.20 | -- |
| Support 1 (Entry Zone) | $462.81 | Technical: SMA(20), pullback magnet |
| Support 2 | $440.68 | Technical: SMA(50), trend support |
| Support 3 | $451.97 | Technical: 23.6% Fibonacci retracement |
Risk/Reward Framework
Scenario 1: Pullback to SMA(20) Entry
- Entry: $462.81 (SMA 20)
- Target: $509.70 (ATH)
- Stop: $440.00 (below SMA 50)
- R:R: 2.1:1
- Probability: Moderate-High (pullback to SMA20 is the most likely entry scenario given overbought stochastic)
Scenario 2: Breakout Above ATH
- Entry: $510.00 (breakout confirmation)
- Target: $545-572 (fundamental bull case: gold $6,000-6,300/oz)
- Stop: $487.00 (below current price / prior resistance)
- R:R: 1.5-2.7:1
- Probability: Moderate (requires continued momentum and catalyst trigger like dovish FOMC)
Scenario 3: Deeper Pullback to SMA(50)
- Entry: $440.68 (SMA 50)
- Target: $509.70 (ATH)
- Stop: $410.00 (below SMA 100)
- R:R: 2.3:1
- Probability: Lower (would require a negative catalyst like hawkish Fed surprise)
Catalyst Timeline
| Date | Event | Expected Impact |
|---|---|---|
| Mar 12 | US CPI Release | Uncertain — hot CPI bearish, cool CPI bullish |
| Mar 18-19 | FOMC Meeting | Positive — easing bias intact |
| Apr 2026 | Q1 Central Bank Purchase Data | Positive — if >500t pace maintained |
| May 6-7 | FOMC Meeting | Positive — rate cut probability elevated |
| Ongoing | Geopolitical risk (Middle East, trade) | Positive — safe-haven premium |
Conviction Assessment
| Component | Value | Rationale |
|---|---|---|
| Fund-Tech Agreement | 1.0 | Fully aligned bullish — both flag same strengths and same risks |
| Catalyst Density | 0.9 | Dense near-term catalysts (FOMC Mar/May, CPI, central bank data) |
| Data Quality | 0.8 | Massive ETF with deep coverage; slight deduction for ETF-adapted modules |
| Risk/Reward Asymmetry | 0.65 | Best entry (SMA20 pullback) offers ~2:1 R:R; not exceptional |
| Red Flag Severity | 0.7 | 5 MEDIUM flags total (2 fundamental, 3 technical), all structural/disclosed |
Conviction Score: 5 (High Conviction) Weighted Score: 84.0/100 Position Sizing: Full target position (5-7% of portfolio)
Actionable Framework
Preferred approach: Buy on pullback to SMA(20) at ~$463, with a stop below SMA(50) at ~$440. Target the ATH at $509.70 for a 2.1:1 R:R.
If already holding: Hold. The trend is intact and there is no structural reason to sell. Consider trimming into ATH resistance if position is oversized.
Vehicle note: For long-term passive gold exposure, GLDM (0.10% expense ratio) saves 30bp/year vs. GLD (0.40%). GLD is the right tool for active trading, options strategies, and institutional-size blocks requiring deep liquidity.
What would change the thesis: - Bearish: Hawkish Fed pivot, dollar surge, or gold breaking below SMA(50) at $440.68 - Bullish escalation: Breakout above $509.70 ATH on volume, dovish FOMC surprise, or accelerating central bank buying
Charts