GDDY — Technical Summary
Conviction 3GDDY -- Technical Deep Dive
- Date: 2026-03-05
- Researcher: Quant Researcher (Signals)
- Status: Complete
- Script:
analysis/quant-research/scripts/GDDY-technical-2026-03-05.py - Charts:
analysis/quant-research/charts/gddy_price_structure.png,gddy_momentum.png,gddy_volume_accumulation.png,gddy_volatility.png
1. Score Box
===========================================================
  GDDY -- Technical Analysis                   2026-03-05
  Asset Class: Equity
  Price: $88.66  |  52wk: $73.06 - $193.55
===========================================================

  OVERALL SCORE: 6.1/10      BIAS: Neutral

  COMPONENT SCORES
  -----------------------------------------------------------
  Trend Alignment         5.0/10  wt 25%  All MAs declining; below all
  Momentum                8.5/10  wt 20%  MACD bullish cross forming
  Volume Confirmation     9.0/10  wt 20%  OBV/AD rising; buying volume
  Volatility Profile      3.0/10  wt 15%  ATR 5.76%; elevated HV
  Market Structure        4.5/10  wt 20%  Markdown phase; HH/HL forming

  KEY LEVELS
  -----------------------------------------------------------
  Resistance 2:  $106.02  Pivot high cluster
  Resistance 1:  $92.30   Recent pivot high
  Current Price: $88.66
  Support 1:     $79.12   Recent swing low cluster
  Support 2:     $73.06   52-week low (2026-02-25)

  RED FLAGS                                    (2 found)
  -----------------------------------------------------------
  HIGH   Deep below 200 SMA (-36.1%)           [Trend]
  HIGH   Down 54.2% from 52-week high          [Price Structure]

===========================================================
2. Executive Summary
GDDY has experienced a severe drawdown, falling 54.2% from its 52-week high of $193.55 (set on 2025-05-01) to a 52-week low of $73.06 on 2026-02-25. The stock has bounced 21.4% off that low to the current price of $88.66, but remains deeply underwater relative to all major moving averages. The 200 SMA sits at $138.66, placing GDDY 36.1% below this long-term trend indicator.
The mixed picture is the defining feature of the current setup. While the trend structure is clearly bearish (all MAs declining, price below all of them), short-term momentum and volume indicators are showing early signs of recovery. The MACD has generated a bullish crossover with histogram turning positive, stochastic %K is above %D, and both OBV and A/D line trends are rising over the last 20 days. Buying volume has dominated selling volume in the most recent 5 trading sessions.
However, volatility remains extreme. ATR as a percentage of price is 5.76%, and 20-day historical volatility stands at 74.25% annualized. The Bollinger Band width is in the 82nd percentile of its historical range, confirming the elevated uncertainty. This is not a low-risk entry environment.
The most reasonable interpretation is that GDDY is attempting a bottom formation after a capitulation selloff. The bounce off $73 showed genuine buying interest (rising OBV/AD), but the overhead resistance is heavy. The stock must clear $92.30 (recent pivot) and $106.02 (next major pivot cluster) before any bullish case can be made with confidence. Until the 50 SMA ($103.83) begins to flatten and price reclaims it, the primary trend remains bearish.
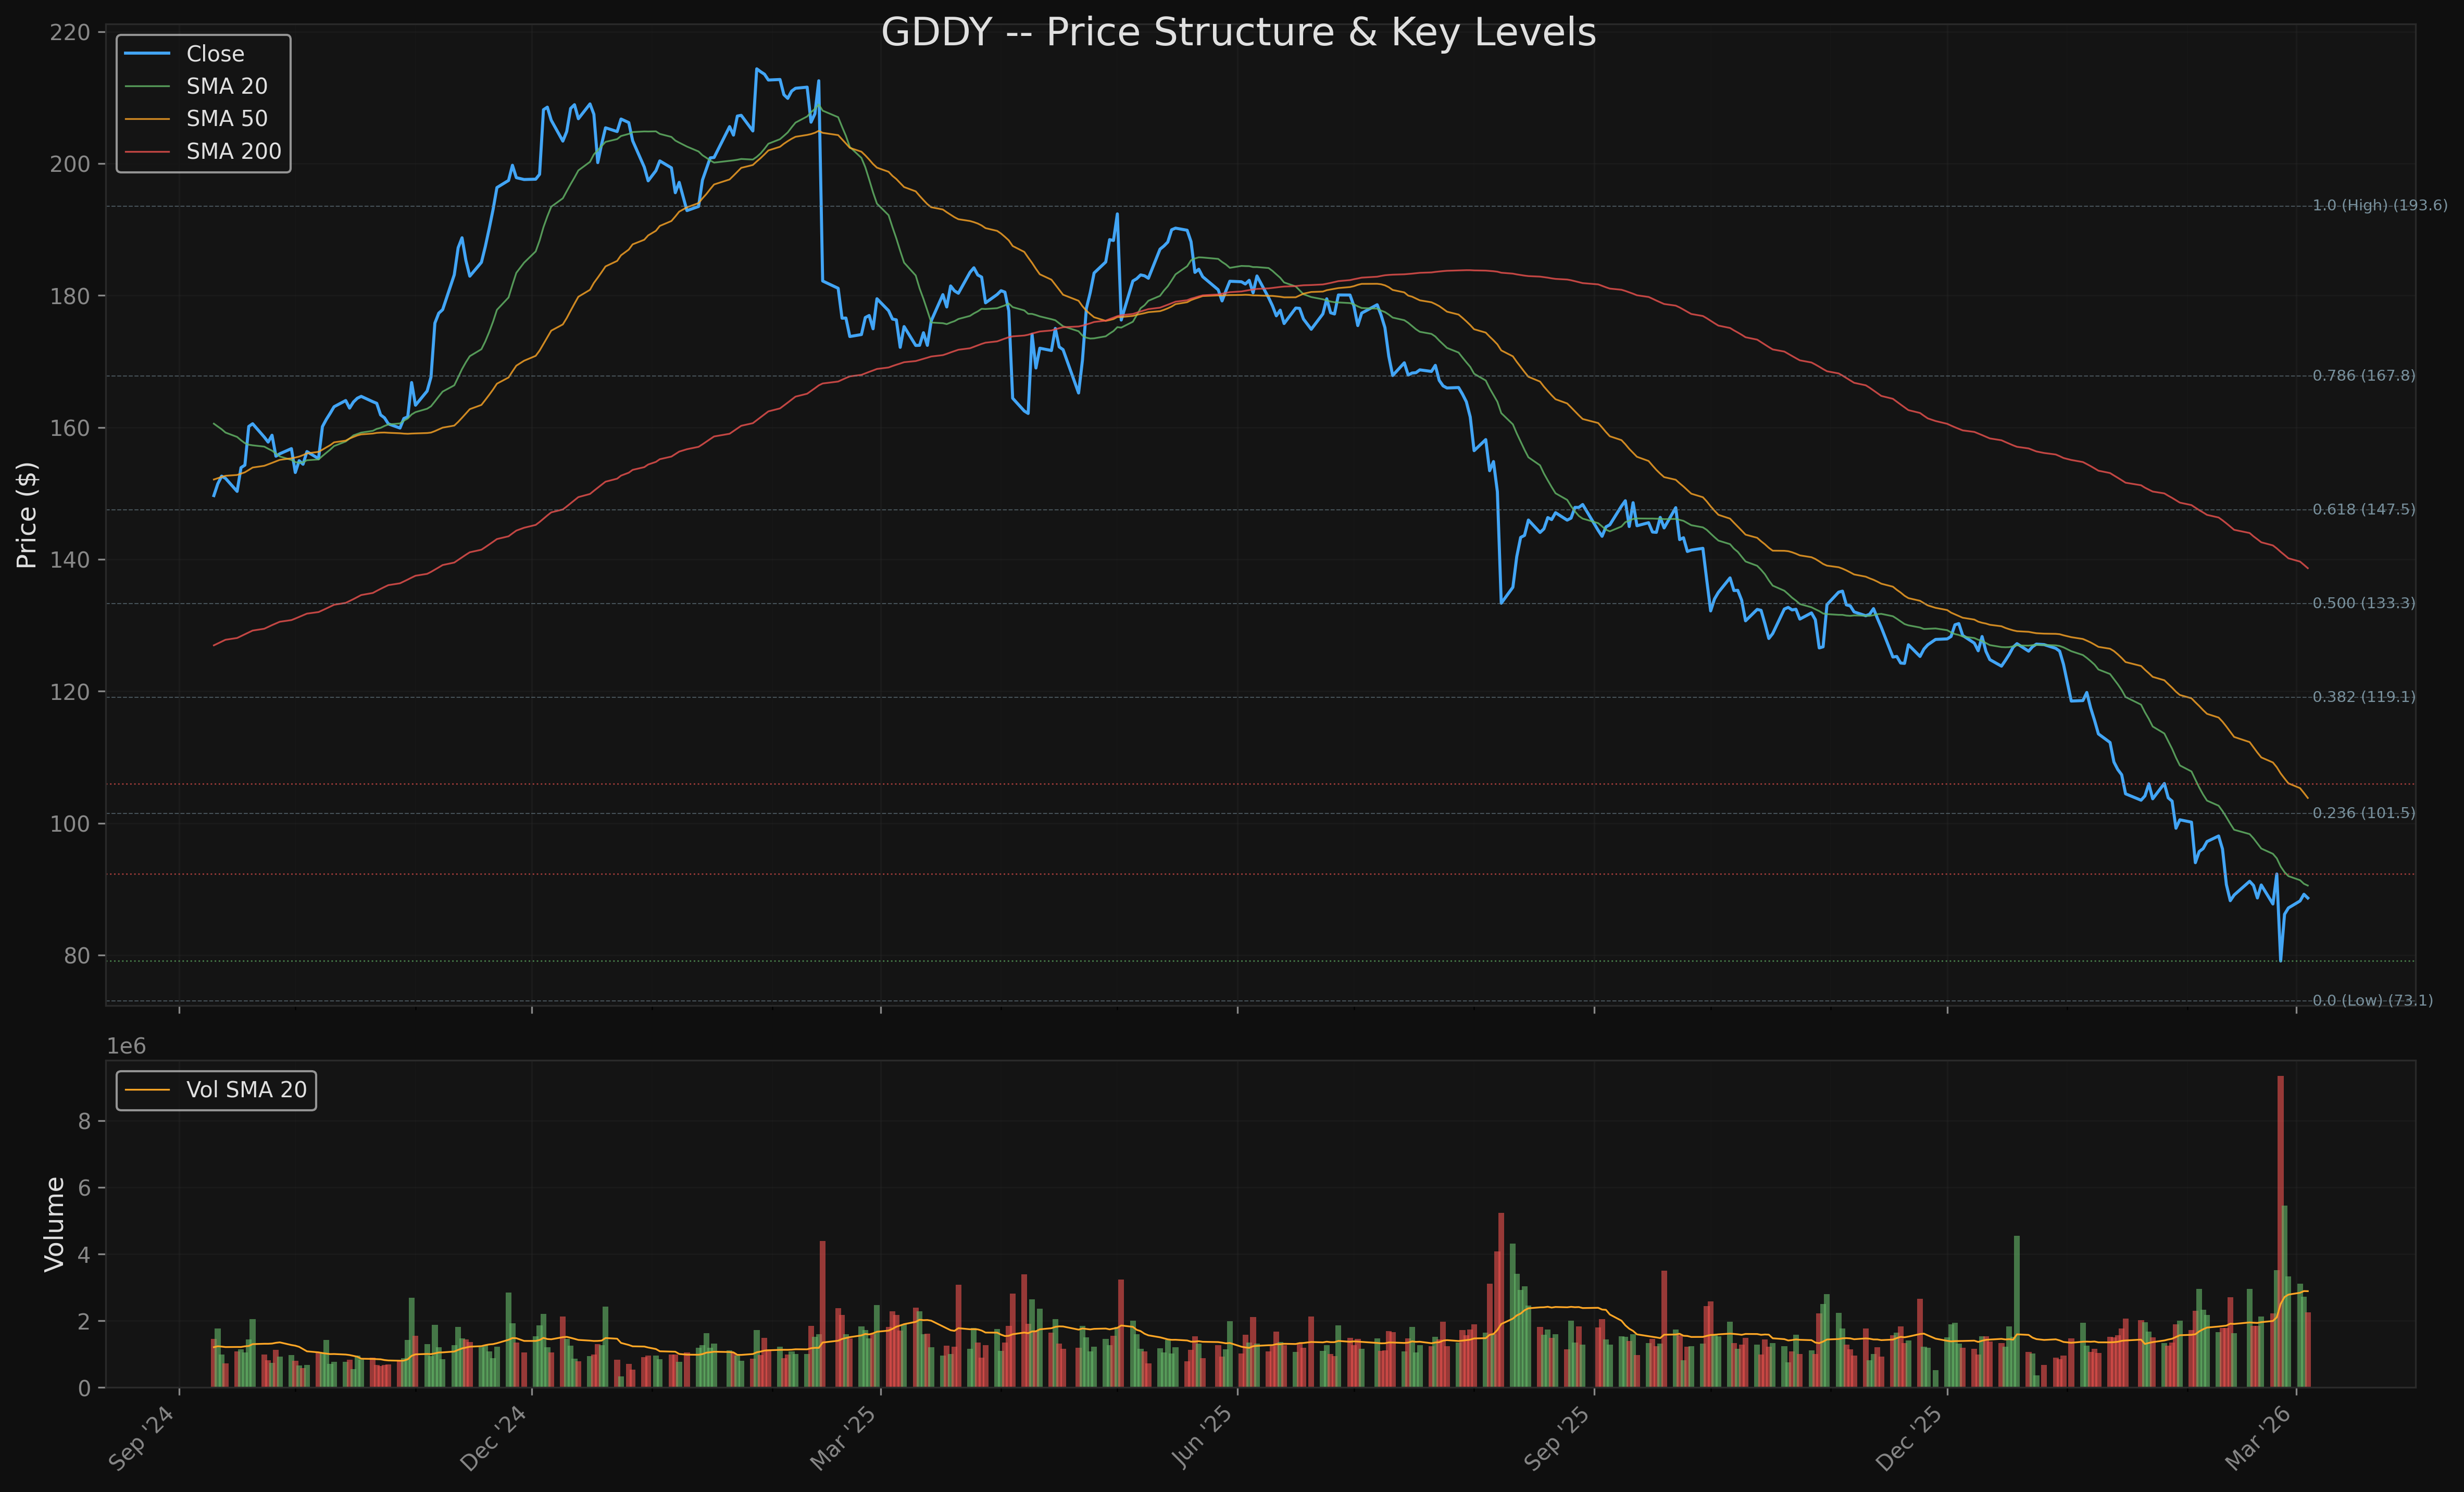
3. Price Structure
52-Week Range
| Metric | Value |
|---|---|
| 52-Week High | $193.55 (2025-05-01) |
| 52-Week Low | $73.06 (2026-02-25) |
| Current Price | $88.66 |
| % From High | -54.19% |
| % From Low | +21.35% |
| 52-Week Range | $120.49 |
Fibonacci Retracements (from 52-week range)
| Level | Price | Status |
|---|---|---|
| 0.0 (Low) | $73.06 | Support -- 52wk low |
| 0.236 | $101.50 | First major Fib resistance |
| 0.382 | $119.09 | Above current range |
| 0.500 | $133.31 | Near SMA 200 ($138.66) |
| 0.618 | $147.52 | Above all MAs |
| 0.786 | $167.77 | Near prior structure |
| 1.0 (High) | $193.55 | 52wk high |
The current price at $88.66 sits between the 0.0 and 0.236 Fibonacci levels, indicating the stock has not yet recovered even the shallowest retracement of the entire decline. The 0.236 level at $101.50 is the first significant Fibonacci resistance and aligns approximately with the SMA 50 at $103.83.
Recent Performance
| Period | Return |
|---|---|
| 1 Week | +2.85% |
| 1 Month | -5.70% |
| 3 Months | -30.90% |
| 6 Months | -38.21% |
| 1 Year | -49.74% |
The 1-week return is positive, consistent with the bounce off the 52-week low. But all periods beyond one week remain deeply negative. The 3-month and 6-month losses of -30.9% and -38.2% respectively reflect the severity of the decline.
4. Market Structure
Wyckoff Phase: Markdown (early recovery attempt)
The algorithmic phase detection identifies the current state as "Markdown (early)" based on:
| Evidence | Value | Interpretation |
|---|---|---|
| 60-day price trend | -30.98% | Strong downtrend |
| 60-day price range | 54.36% of mean | Extreme range expansion |
| Volume trend (recent 20d vs prior 20d) | See vol analysis | Volume patterns shifting |
| 20-day HH count | 11 | Higher highs forming |
| 20-day HL count | 11 | Higher lows forming |
| 20-day LH count | 8 | Fewer lower highs |
| 20-day LL count | 8 | Fewer lower lows |
The 20-day structure is notable: the stock is making more higher highs (11) and higher lows (11) than lower highs (8) and lower lows (8) over the most recent 20 sessions. This is consistent with a developing bottom pattern within a larger markdown phase. The stock appears to be transitioning from Phase D (markdown) toward a potential Phase A (stopping action / preliminary support) of a new Wyckoff accumulation cycle.
Key structural question: Is the $73.06 low a "selling climax" (SC) in Wyckoff terms? The volume spike near the low and subsequent bounce are consistent with that interpretation, but confirmation requires a "secondary test" (ST) of the $73-$80 area on declining volume before accumulation can be confirmed.
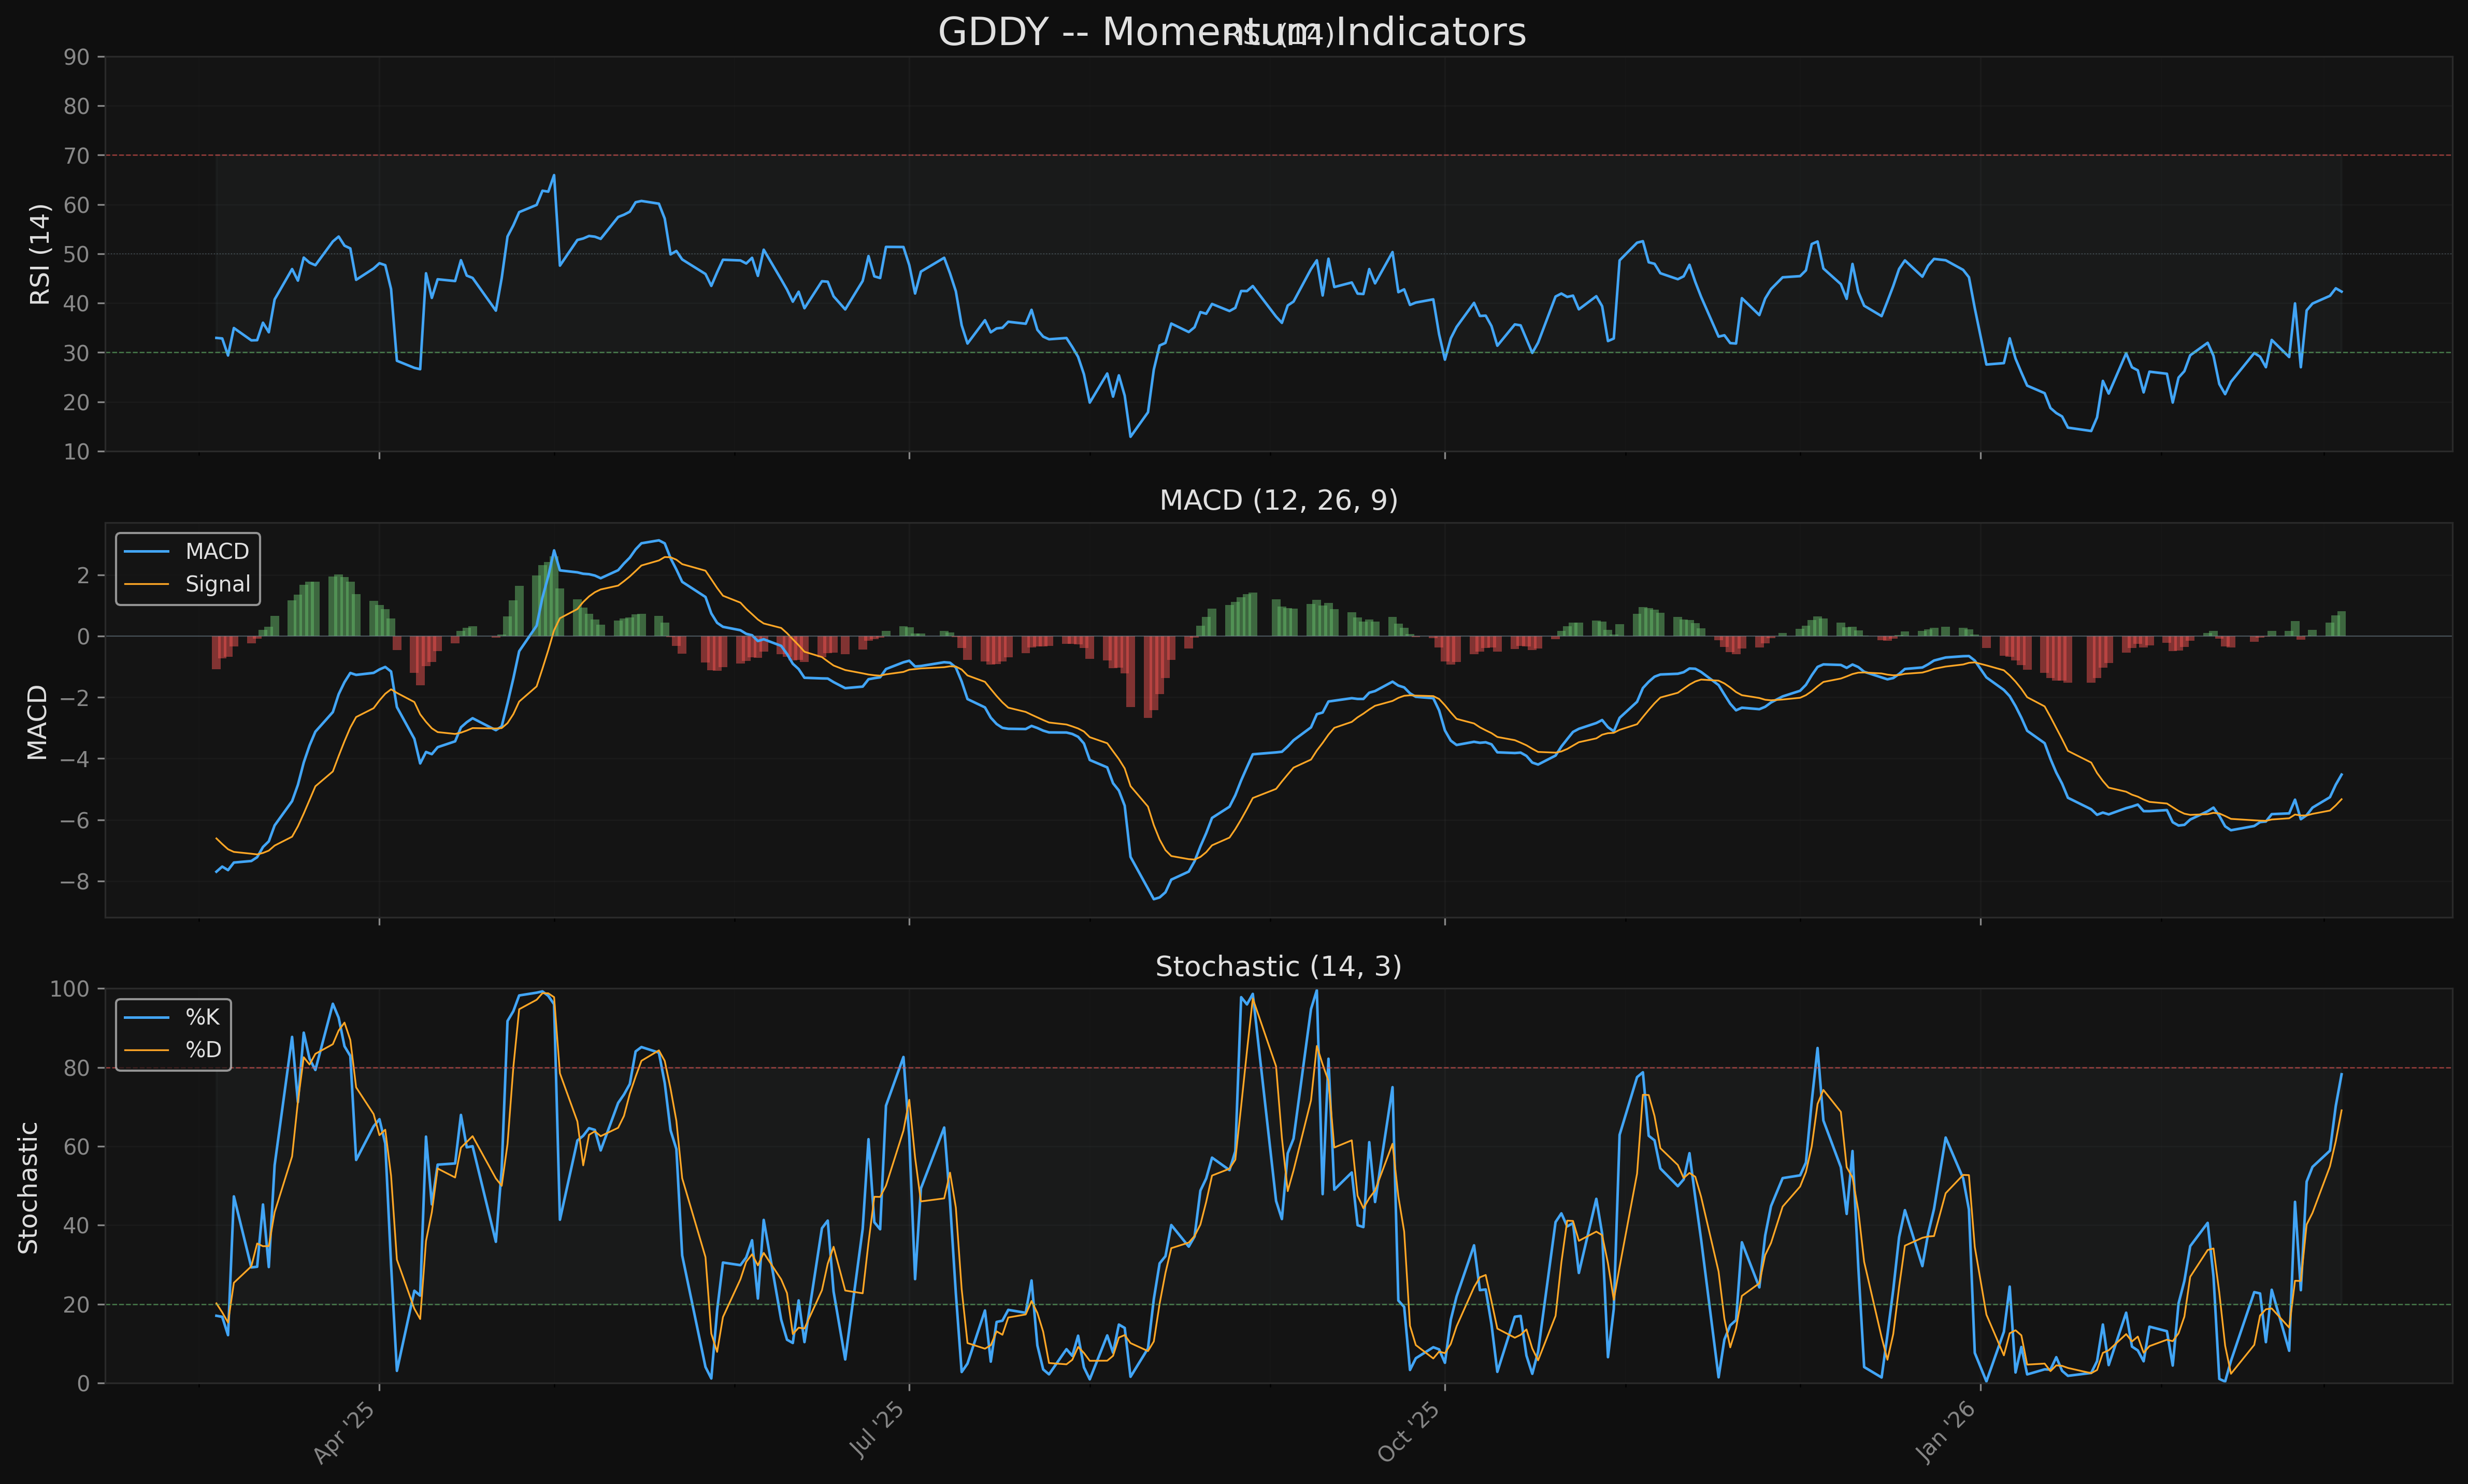
5. Momentum Analysis
RSI (14-period)
| Metric | Value |
|---|---|
| Current RSI | 42.34 |
| Zone | Neutral (40-60) |
| Recent extreme | Deeply oversold during selloff |
| Trend | Recovering from sub-30 readings |
RSI at 42.34 is in the neutral zone, having recovered from oversold levels during the capitulation. This is consistent with a stock attempting to build a base. RSI has not yet reached 50, which would indicate balanced momentum. A move above 50 and sustaining would be a minor bullish signal.
MACD (12, 26, 9)
| Metric | Value |
|---|---|
| MACD Line | -4.5263 |
| Signal Line | -5.3305 |
| Histogram | +0.8042 |
| Status | Bullish crossover in progress |
The MACD line has crossed above the signal line, generating a bullish signal. The histogram is positive at +0.80 and expanding. Both lines remain deeply negative (well below zero), indicating the broader trend is still bearish, but the crossover suggests decelerating downside momentum. This is an early-stage recovery signal, not a trend reversal confirmation.
Stochastic (14, 3)
| Metric | Value |
|---|---|
| %K | 78.23 |
| %D | 69.11 |
| Status | %K above %D, approaching overbought |
Stochastic %K at 78.23 is approaching the overbought zone (80). In a downtrend, overbought stochastic readings can signal the end of a counter-trend bounce rather than continued strength. This is a caution signal -- the bounce may be getting extended in the short term.
6. Moving Average Analysis
Current MA Positions
| Moving Average | Value | Price vs MA | Slope (20d chg) |
|---|---|---|---|
| SMA 20 | $90.55 | -2.1% below | -14.10% (steep decline) |
| SMA 50 | $103.83 | -14.6% below | -11.83% (declining) |
| SMA 100 | $116.53 | -23.9% below | N/A |
| SMA 200 | $138.66 | -36.1% below | -5.96% (declining) |
MA Analysis
Bearish alignment: Price is below all four major moving averages. The ordering is bearish: SMA 20 < SMA 50 < SMA 100 < SMA 200 (death cross configuration). All MA slopes are negative.
SMA 20 is the nearest resistance. At $90.55, it sits just $1.89 above the current price. A sustained close above the SMA 20 would be the first constructive signal in the MA framework. The SMA 50 at $103.83 is the next major hurdle and roughly aligns with the Fibonacci 0.236 level ($101.50), creating a significant confluence resistance zone around $101-$104.
Distance from SMA 200: At 36.1% below the 200 SMA, GDDY is extremely stretched to the downside. Historically, large-cap equities this far below their 200 SMA are either in secular bear markets or experiencing a capitulation that eventually mean-reverts. There is no golden cross or death cross pattern actionable at current levels -- the MAs are all declining and too far apart.
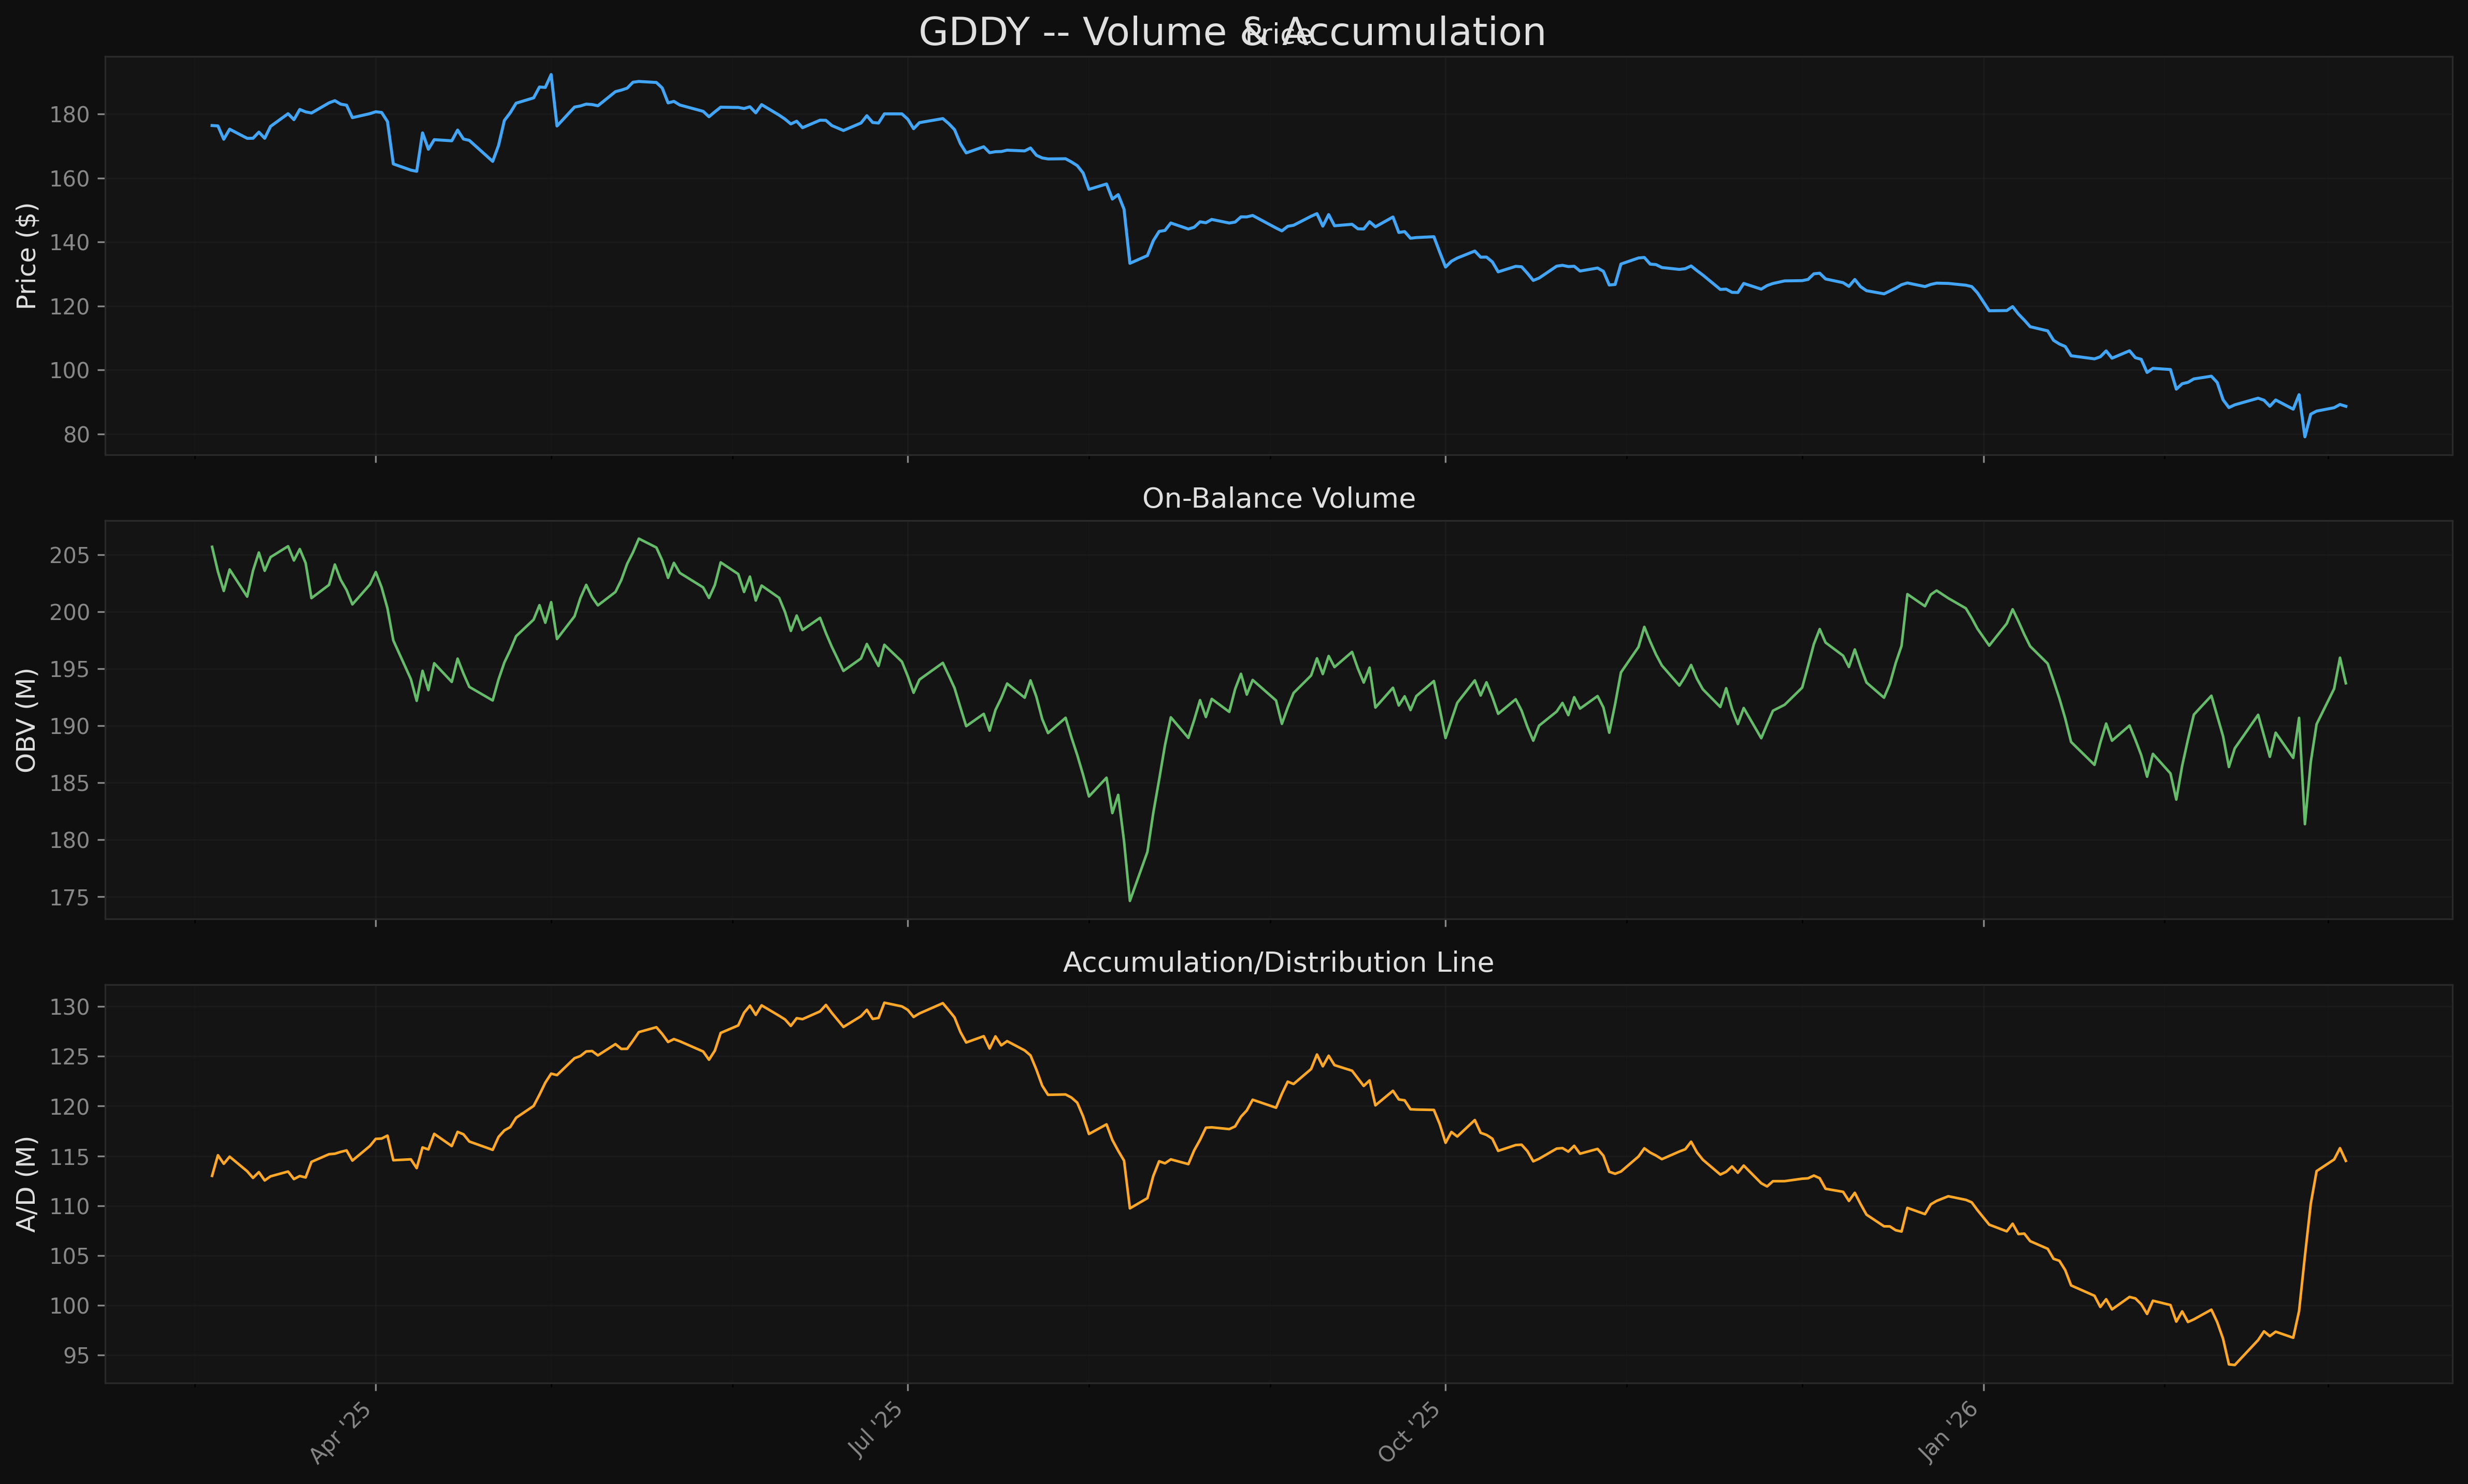
7. Volume Analysis
Volume Statistics
| Metric | Value |
|---|---|
| Current Volume | 2,246,700 |
| 20-day Avg Volume | 2,885,660 |
| 50-day Avg Volume | 2,067,340 |
| Volume Ratio (current/20d) | 0.78x |
| OBV Trend (20-day) | Rising |
| A/D Line Trend (20-day) | Rising |
Interpretation
Volume analysis provides the most constructive picture in the current setup:
-
OBV is rising over the last 20 sessions, indicating net buying pressure. Buyers are stepping in on up days with meaningful volume.
-
A/D line is rising, confirming that accumulation is occurring. The close-location value (CLV) calculation weighs closes near the high of the day as accumulative -- this has been the dominant pattern recently.
-
Up-volume exceeds down-volume in the last 5 trading sessions. This is the signature of institutional buying interest at these levels.
-
20-day average volume (2.89M) exceeds 50-day average (2.07M) by 39.5%, indicating heightened activity during the recent selloff and bounce. This is typical of capitulation followed by accumulation.
The volume profile is the primary reason the overall score is not lower. Smart money appears to be accumulating shares near the 52-week low, which is a necessary (though not sufficient) condition for a durable bottom.
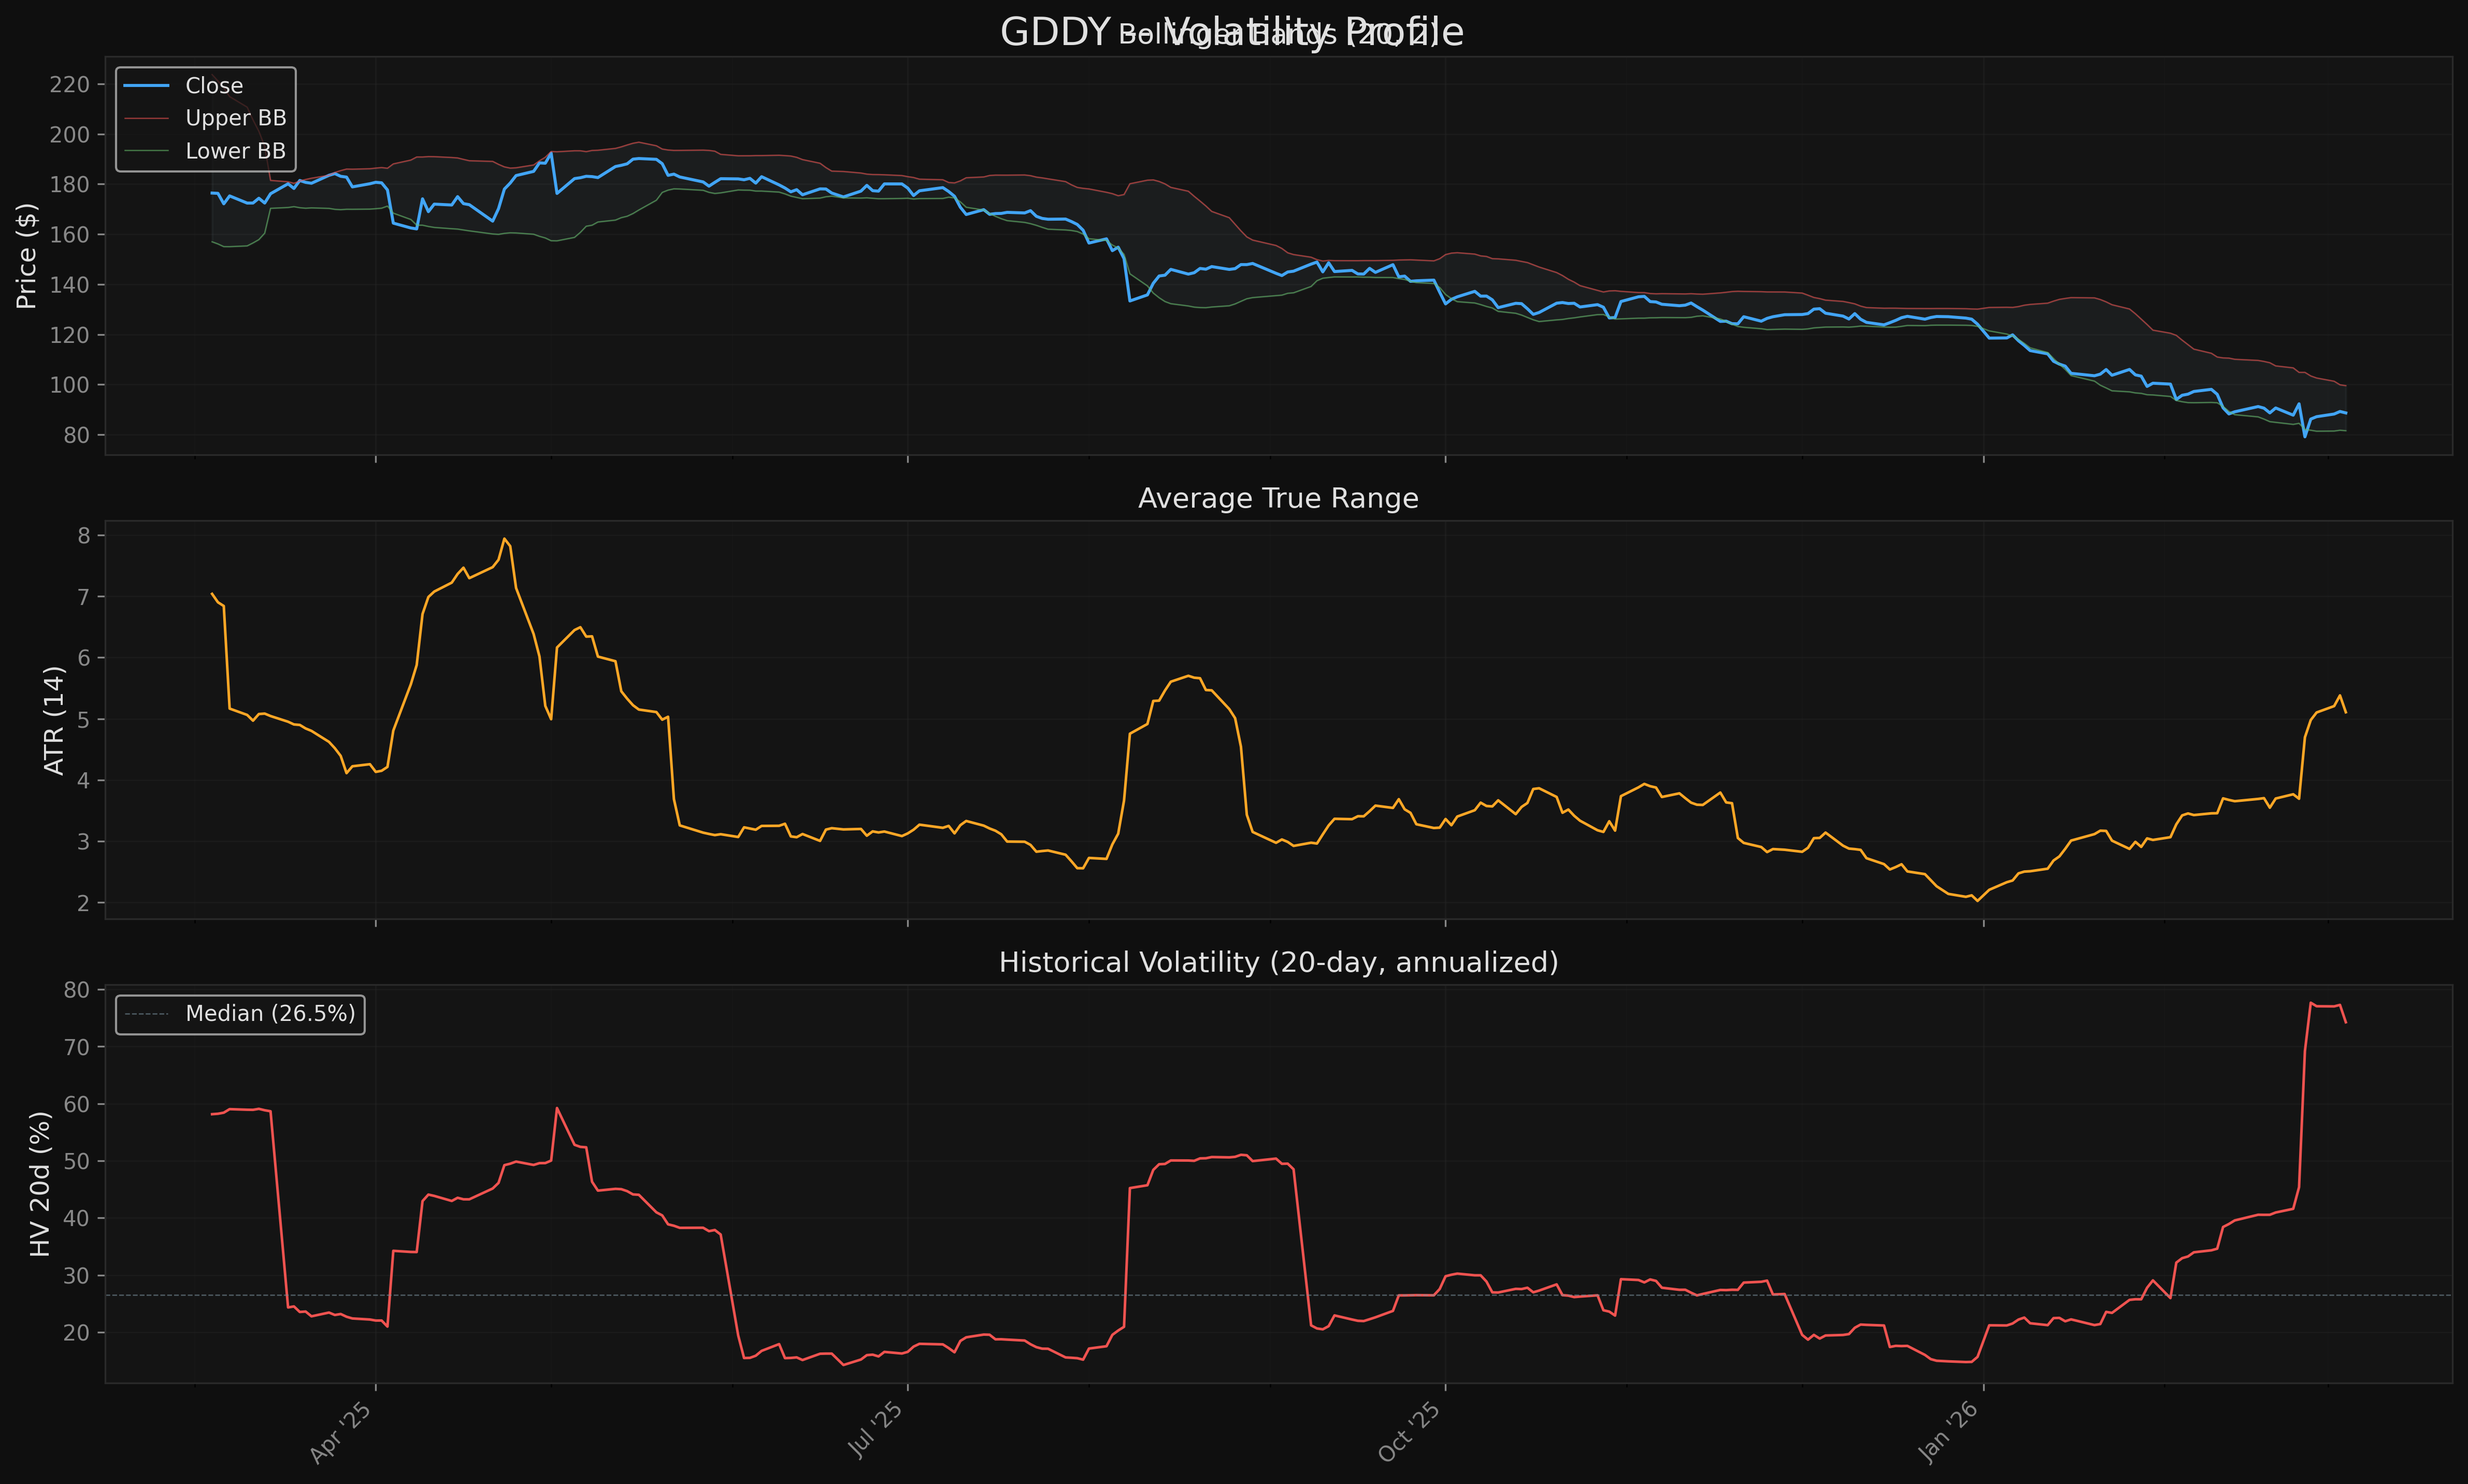
8. Volatility Profile
Current Volatility Metrics
| Metric | Value | Percentile | Assessment |
|---|---|---|---|
| ATR (14) | $5.11 | N/A | Elevated |
| ATR % of Price | 5.76% | N/A | Very high for equity |
| BB Width | 0.1985 | 82.4th | Wide (not at extreme) |
| BB %B | 0.39 | N/A | Below midline |
| 20-day HV (ann.) | 74.25% | N/A | Extremely elevated |
Return Distribution (full history)
| Statistic | Value |
|---|---|
| Annualized Return | 13.55% |
| Annualized Volatility | 35.40% |
| Sharpe Ratio | 0.38 |
| Skewness | -0.081 |
| Excess Kurtosis | 11.791 |
| Max Drawdown | -63.09% (2026-02-25) |
| Daily Win Rate | 53.4% |
Interpretation
Volatility is the weakest component of the technical picture. Key concerns:
-
ATR at 5.76% of price is extremely high for a mid-cap equity. Normal range for equities is 1-3%. This means daily swings of $5+ are routine, making position sizing critical.
-
Historical volatility at 74.25% is well above the typical 20-40% range. This is crisis-level volatility consistent with the recent selloff.
-
Excess kurtosis of 11.79 indicates extremely fat tails in the return distribution. The stock has experienced far more extreme daily moves than a normal distribution would predict. This is a risk factor for any stop-loss-based strategy.
-
Bollinger Band %B at 0.39 places the price below the BB midline but within the bands, consistent with a stock in a volatile range rather than trending.
-
Max drawdown of -63.09% (from all-time levels) underscores the severity of the decline. The current drawdown from the 52-week high is -54.2%.
The near-zero skewness (-0.081) suggests the distribution of returns is roughly symmetric, which is neutral (no persistent directional bias in tail events).
9. Entry Point Assessment
Given the mixed signals (bullish volume/momentum diverging from bearish trend/volatility), entry zones are ranked by risk/reward quality.
Zone 1: Pullback to Recent Support ($79 - $82)
- Confluence: Recent swing low cluster ($79.12), near Feb 25 bounce area
- Risk: Stop below $73.06 (52-week low)
- Target 1: $92.30 (R1)
- Target 2: $106.02 (R2)
- R:R to T1: ~1.5:1 (risking ~$7-9, targeting ~$10-13)
- R:R to T2: ~3.0:1
- Quality: BEST -- lower risk entry at proven support
Zone 2: Breakout Above SMA 20 ($91 - $93)
- Confluence: SMA 20 reclaim ($90.55), pivot high at $92.30
- Risk: Stop below $85 (mid-range)
- Target 1: $101.50 (Fib 0.236)
- Target 2: $106.02 (R2)
- R:R to T1: ~1.4:1
- R:R to T2: ~1.9:1
- Quality: MODERATE -- confirmation entry, less downside but lower R:R
Zone 3: Current Level ($88 - $89, aggressive)
- Confluence: Momentum crossover in progress, volume confirmation
- Risk: Stop below $79 (S1)
- Target 1: $92.30 (R1)
- Target 2: $106.02 (R2)
- R:R to T1: ~0.4:1
- R:R to T2: ~1.8:1
- Quality: POOR for T1 -- the risk to the nearest target is unfavorable; only attractive if targeting $106+
10. Risk/Reward Framework
Scenario 1: Base Case -- Bounce Fades, Re-tests Low
- Probability estimate: 45%
- Thesis: The bounce off $73 is a counter-trend rally within a larger markdown. Stochastic approaching overbought in a downtrend. All MAs declining steeply.
- Entry: Wait for pullback to $79-82
- Stop: $72.00 (below 52wk low)
- Target: $92-95 (near SMA 20 area)
- R:R: ~1.5:1
Scenario 2: Bullish -- Accumulation Phase Develops
- Probability estimate: 30%
- Thesis: The $73 low was a selling climax. OBV/AD rising, MACD crossing bullish. The stock builds a base in the $73-$95 range over coming weeks and eventually breaks above $100.
- Entry: $79-82 (pullback) or $93+ (breakout)
- Stop: $72.00
- Target: $101-106 (Fib 0.236 / pivot cluster)
- R:R: ~2.5:1 (from pullback entry)
Scenario 3: Bearish -- New Lows
- Probability estimate: 25%
- Thesis: The fundamental deterioration that drove the 54% decline continues. The $73 low fails on re-test. Macro/sector headwinds persist.
- Entry: No long entry
- Downside target: $60-65 (extension below 52wk low)
11. Key Levels Summary
| Type | Level | Description | Significance |
|---|---|---|---|
| Resistance 5 | $147.52 | Fib 0.618 | Major recovery target |
| Resistance 4 | $133.95 | Pivot high cluster | Heavy overhead |
| Resistance 3 | $127.22 | Pivot high cluster | Multi-touch resistance |
| Resistance 2 | $106.02 | Pivot high cluster | Key recovery level |
| Resistance 1 | $92.30 | Recent pivot high | First overhead obstacle |
| SMA 20 | $90.55 | 20-day moving average | Immediate resistance |
| Current | $88.66 | Current price | -- |
| Support 1 | $79.12 | Recent swing low cluster | Near-term support |
| Support 2 | $73.06 | 52-week low (Feb 25) | Critical support |
| SMA 50 | $103.83 | 50-day moving average | Major resistance above |
| SMA 100 | $116.53 | 100-day moving average | Distant overhead |
| SMA 200 | $138.66 | 200-day moving average | Long-term trend reference |
| Fib 0.236 | $101.50 | First Fibonacci retracement | First major recovery milestone |
12. Overall Technical Score
Weighted Composite Breakdown
| Component | Score | Weight | Weighted |
|---|---|---|---|
| Trend Alignment | 5.0/10 | 25% | 1.25 |
| Momentum | 8.5/10 | 20% | 1.70 |
| Volume Confirmation | 9.0/10 | 20% | 1.80 |
| Volatility Profile | 3.0/10 | 15% | 0.45 |
| Market Structure | 4.5/10 | 20% | 0.90 |
| Overall | 6.1/10 | 100% | 6.10 |
Component Rationale
Trend Alignment (5.0/10): Neutral/negative. Price is below all major MAs. No bullish MA ordering or positive slopes exist. The only reason this is not lower is that the score starts at a 5.0 baseline -- there is literally nothing positive in the trend framework. The stock is deeply below the 200 SMA.
Momentum (8.5/10): Strong short-term. MACD bullish crossover (+2.0), stochastic %K > %D (+1.0), RSI in neutral zone recovering from oversold (+0.5). This score reflects the counter-trend bounce momentum, not the primary trend.
Volume Confirmation (9.0/10): Very strong. Rising OBV (+1.5), rising A/D line (+1.0), up-volume dominating recent sessions (+1.5). The volume profile is the most bullish element of the technical picture and suggests genuine accumulation.
Volatility Profile (3.0/10): Poor. ATR at 5.76% of price is well above the healthy 1-3% range. Historical volatility at 74.25% is crisis-level. BB width in the 82nd percentile. Kurtosis at 11.79 indicates extreme tail risk. Only the near-zero skewness provides a minor positive (+0.5).
Market Structure (4.5/10): Below average. Despite recent HH/HL formation in the 20-day window (+2.0), the stock is in a markdown phase (-1.5) and far from the 52-week high. The Fib 0.618 level is above current price (+0.5), but the overall structure remains impaired.
Score Interpretation
A 6.1 overall score with Neutral bias reflects the tension between strong short-term momentum/volume recovery and a severely damaged trend structure. The high momentum and volume scores are driven by the bounce off the 52-week low, while the low volatility and structure scores reflect the reality of a stock that has lost more than half its value. This is not a high-conviction setup in either direction -- it requires patience and confirmation.
13. Limitations
-
Data quality: OHLCV data from Yahoo Finance (yfinance). No adjustment for dividends in raw OHLCV (though GDDY does not currently pay dividends, so this is not material). No intraday or pre/post-market data.
-
No fundamental context: This analysis is purely technical. The 54% decline likely reflects fundamental deterioration (earnings miss, guidance cut, sector rotation, etc.) that is not captured here. The technical picture may improve while fundamentals continue to worsen.
-
Momentum scoring caveat: The high momentum score (8.5) reflects short-term recovery indicators (MACD cross, stochastic) that are inherently mean-reverting. In a primary downtrend, these signals produce more false positives than in an uptrend. The momentum score should be interpreted with the trend alignment score (5.0) as context.
-
Volume scoring caveat: The volume score (9.0) is based on 20-day OBV/AD trends and 5-day up/down volume. These short windows can be noisy. A single high-volume day can skew the 5-day calculation. Longer-term volume trends may tell a different story.
-
Wyckoff phase detection is heuristic. The algorithmic detection uses simple rules (price trend, range, HH/HL counts). True Wyckoff analysis requires subjective pattern recognition of specific phases (SC, AR, ST, SOS, LPS) that cannot be reliably automated.
-
Volatility regime: The current extreme volatility (74% HV) means all indicator-derived signals have wider confidence intervals. ATR-based stops and targets should be sized accordingly.
-
Statistical reliability: The return distribution exhibits excess kurtosis of 11.79, meaning standard deviation understates tail risk. Normal-distribution-based tools (Bollinger Bands, z-scores) are less reliable in this regime.
-
Pivot detection sensitivity: Support/resistance levels are derived from 5-day pivot detection on 6-month data. Different lookback periods or pivot windows would produce different levels.
Charts