GDDY
Conviction 3GDDY -- Combined Deep Dive Assessment
Date: 2026-03-05 Asset Class: Equity Ticker: GDDY (GoDaddy Inc.)
Fundamental Summary
| Metric | Value |
|---|---|
| Overall Score | 58.8/100 |
| Verdict | CAUTION |
| Red Flags | 1 HIGH, 6 MEDIUM |
The Market Analyst scored GDDY at 58.8/100 with a CAUTION verdict. Key strengths: $4.95B revenue, $1.6B FCF, highest EBITDA margins in peer group (~32%), net leverage only 1.6x, and a deeply discounted valuation (P/E ~16x vs. peer avg ~63x, FCF yield ~9-10%). One HIGH red flag: fundamental value case not confirmed by technical structure -- stock below all key MAs, near 52-week low, no base established (falling-knife setup). Six MEDIUM red flags: revenue deceleration (2026 guidance ~6% growth, down from 8-10%), 5 consecutive quarters of customer count decline, extreme analyst price target dispersion ($77-$215), share repurchases at peak prices ($130-$216), no insider buying despite 40-45% decline, and rising short interest (5.61M to 6.38M shares).
Technical Summary
| Metric | Value |
|---|---|
| Overall Score | 6.1/10 |
| Bias | Neutral |
| Red Flags | 2 HIGH |
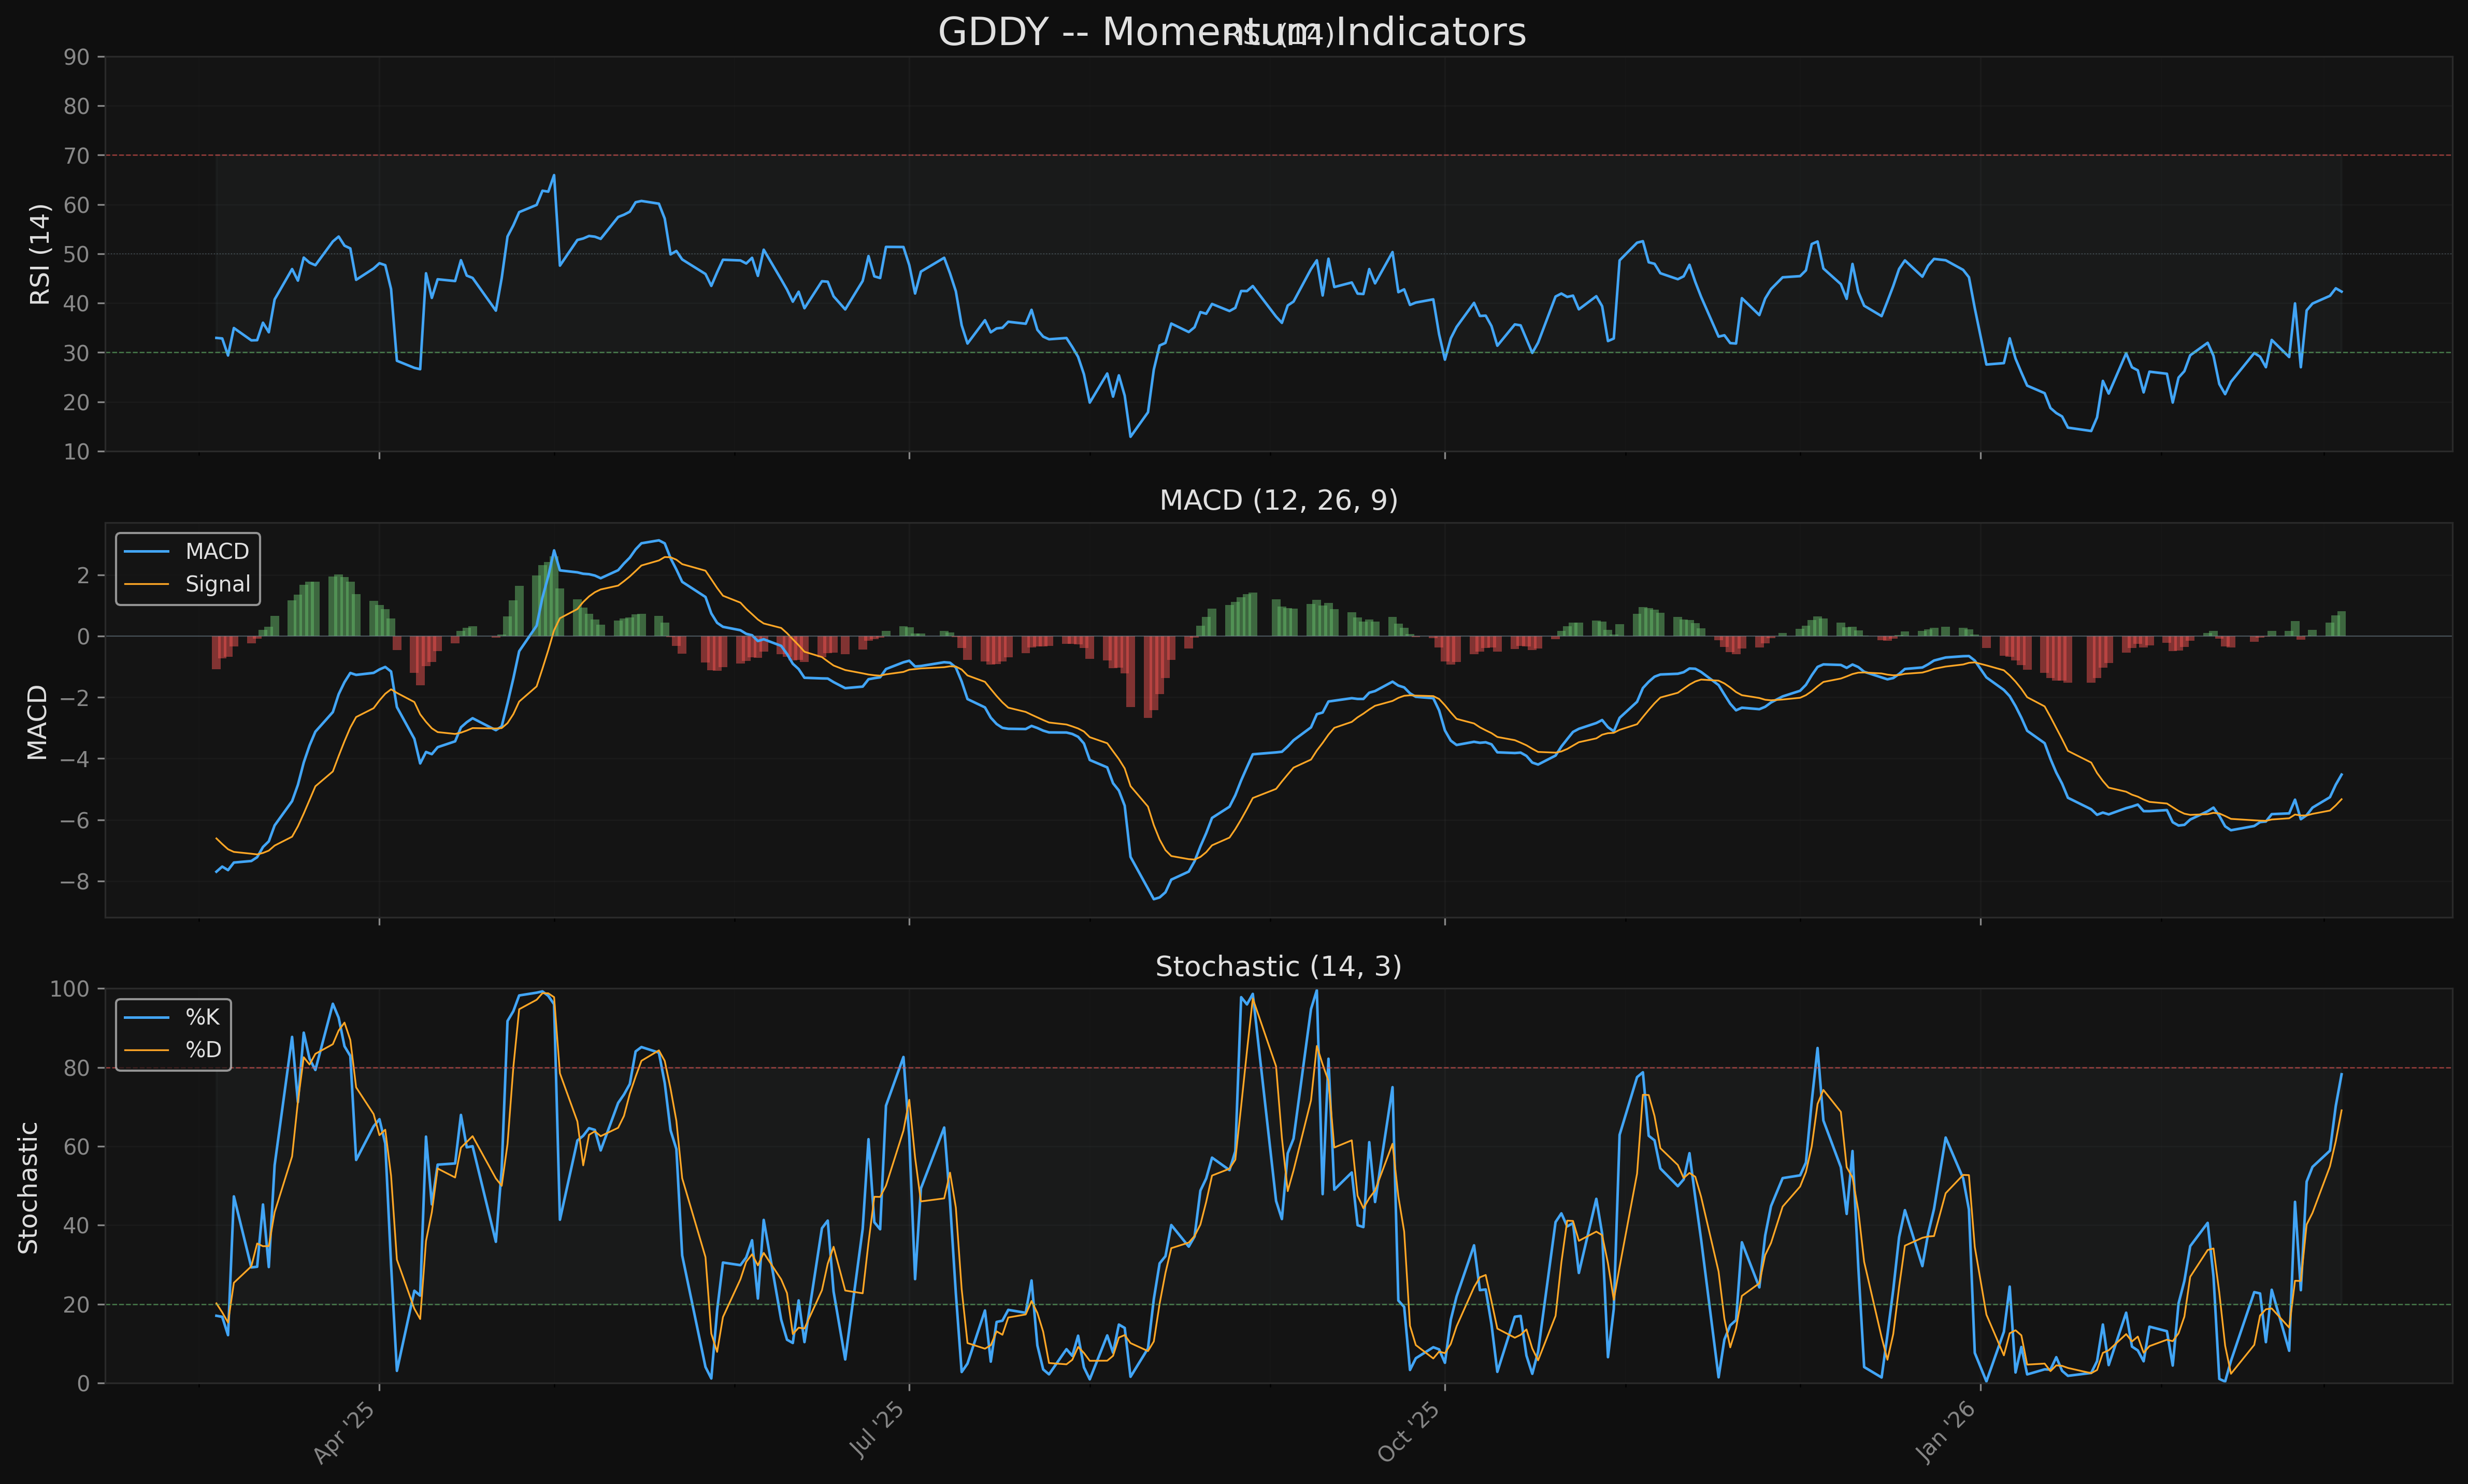
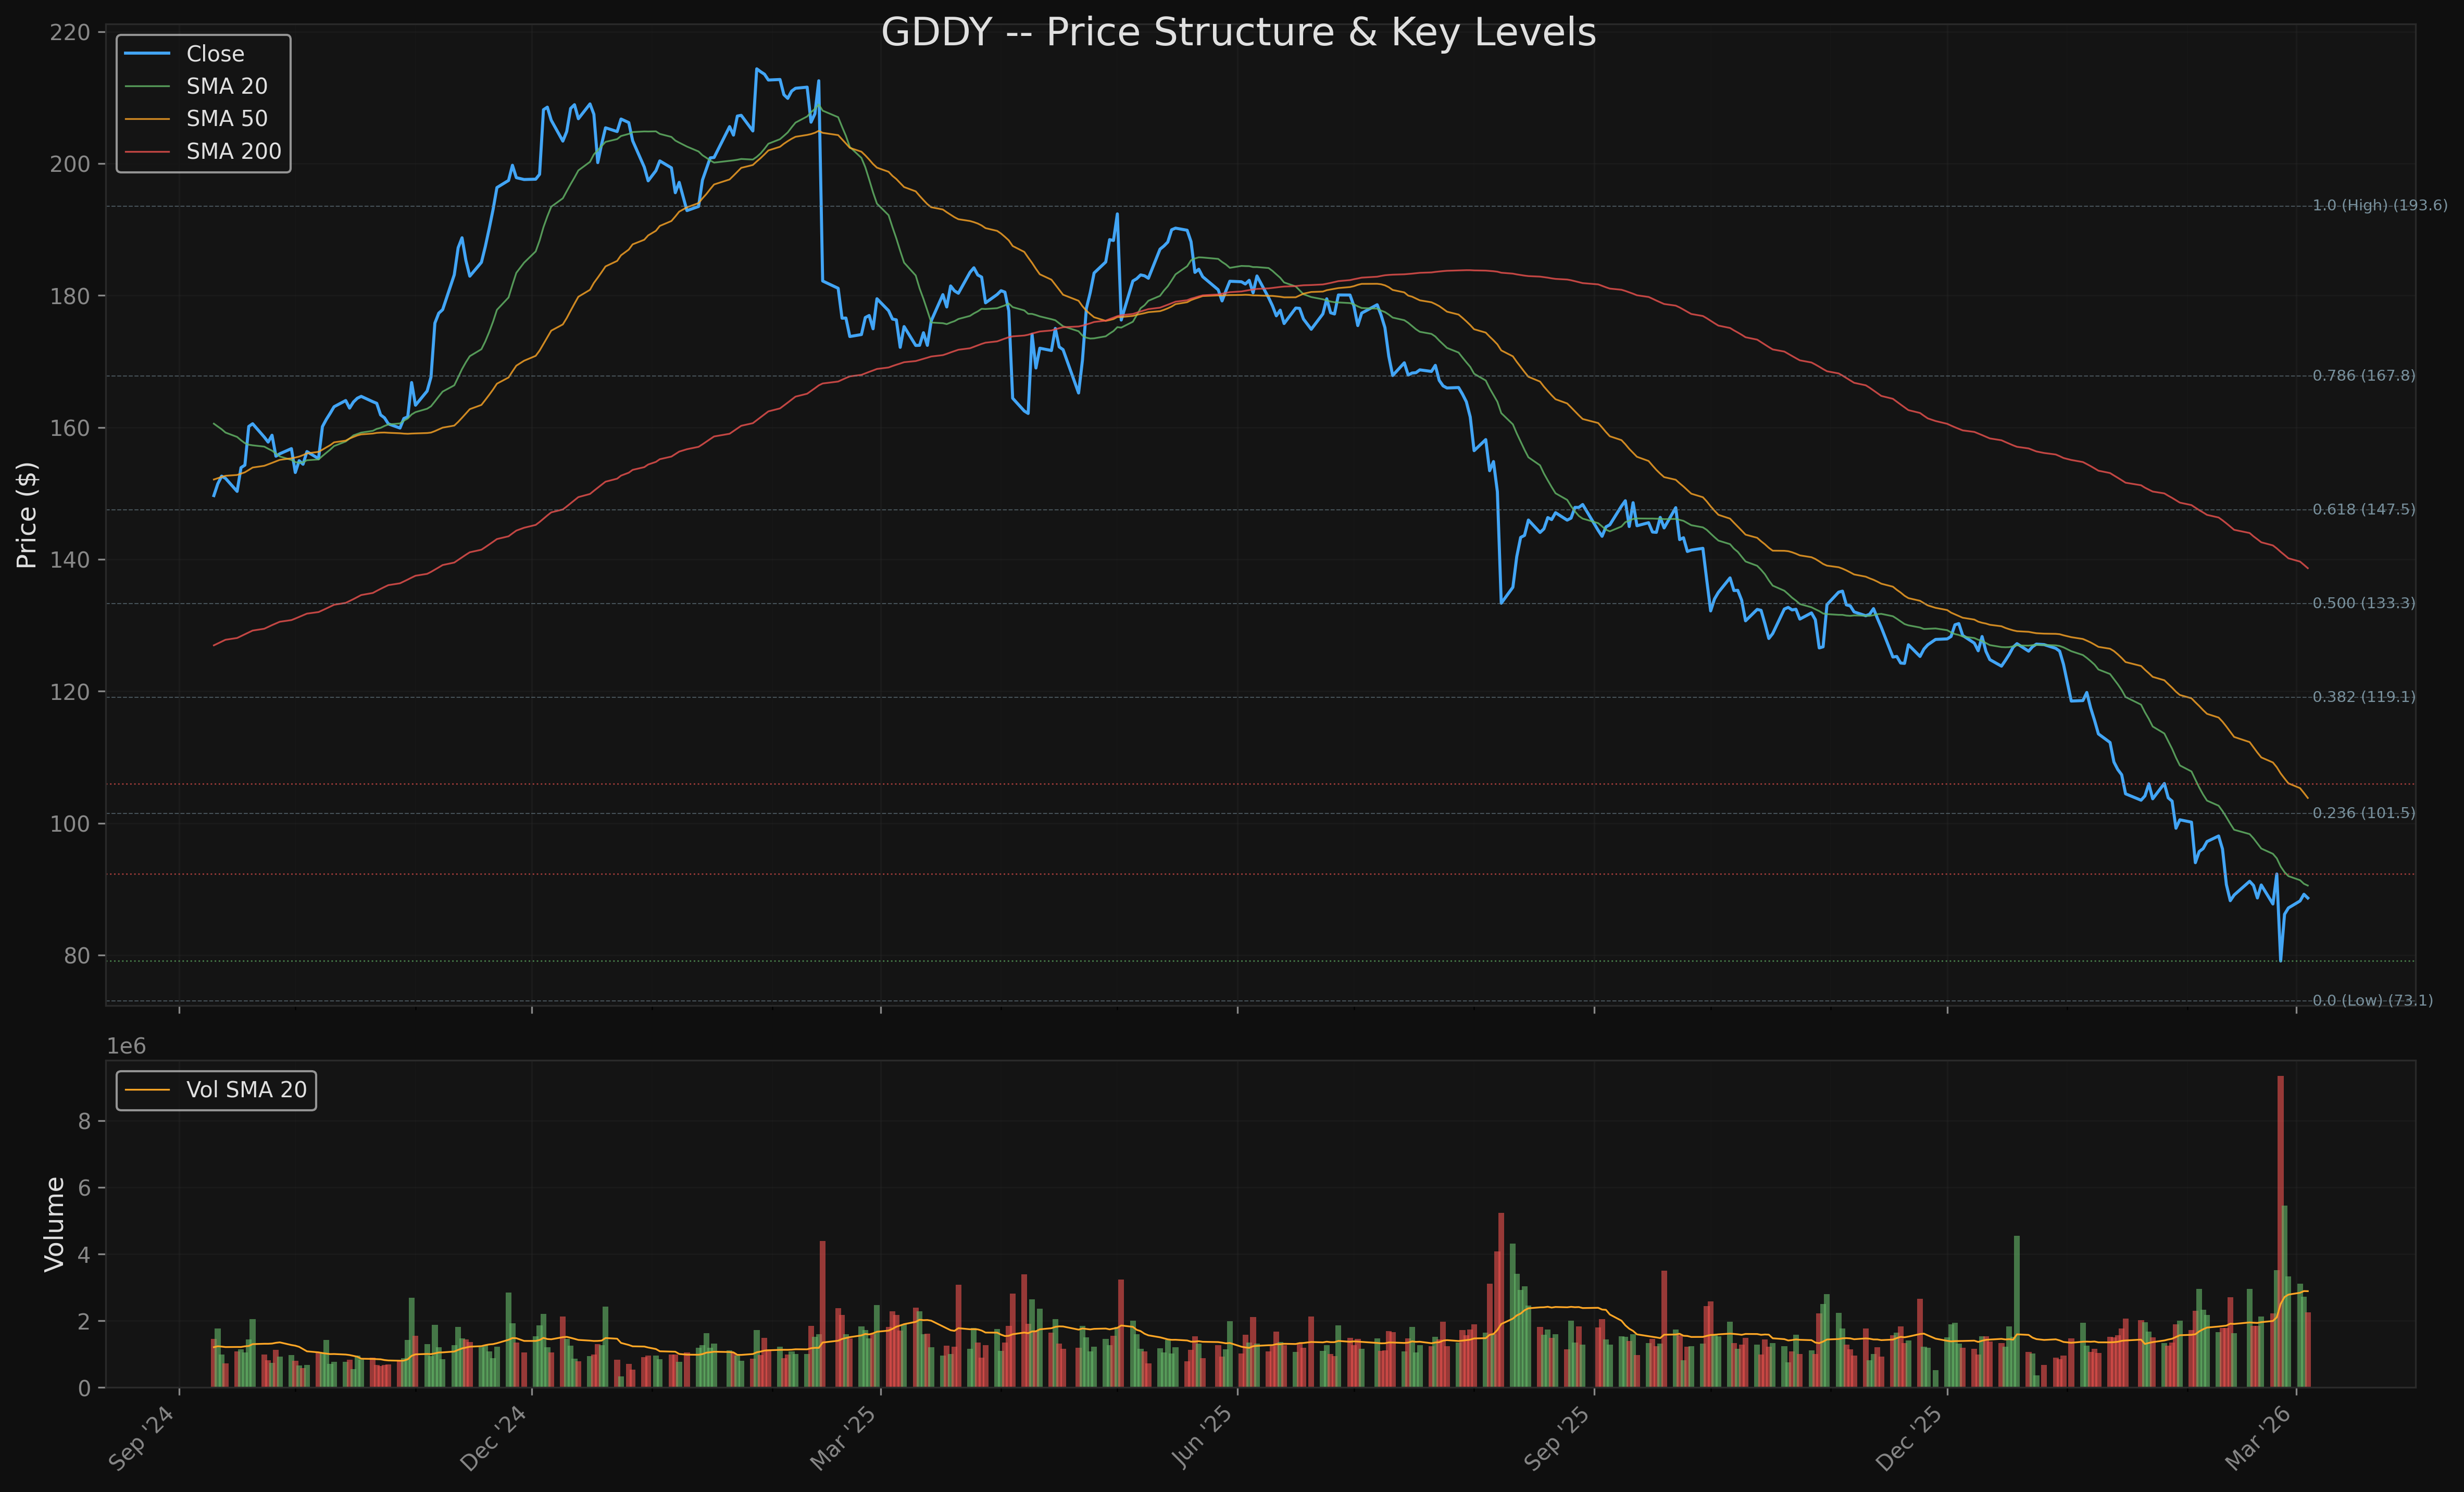
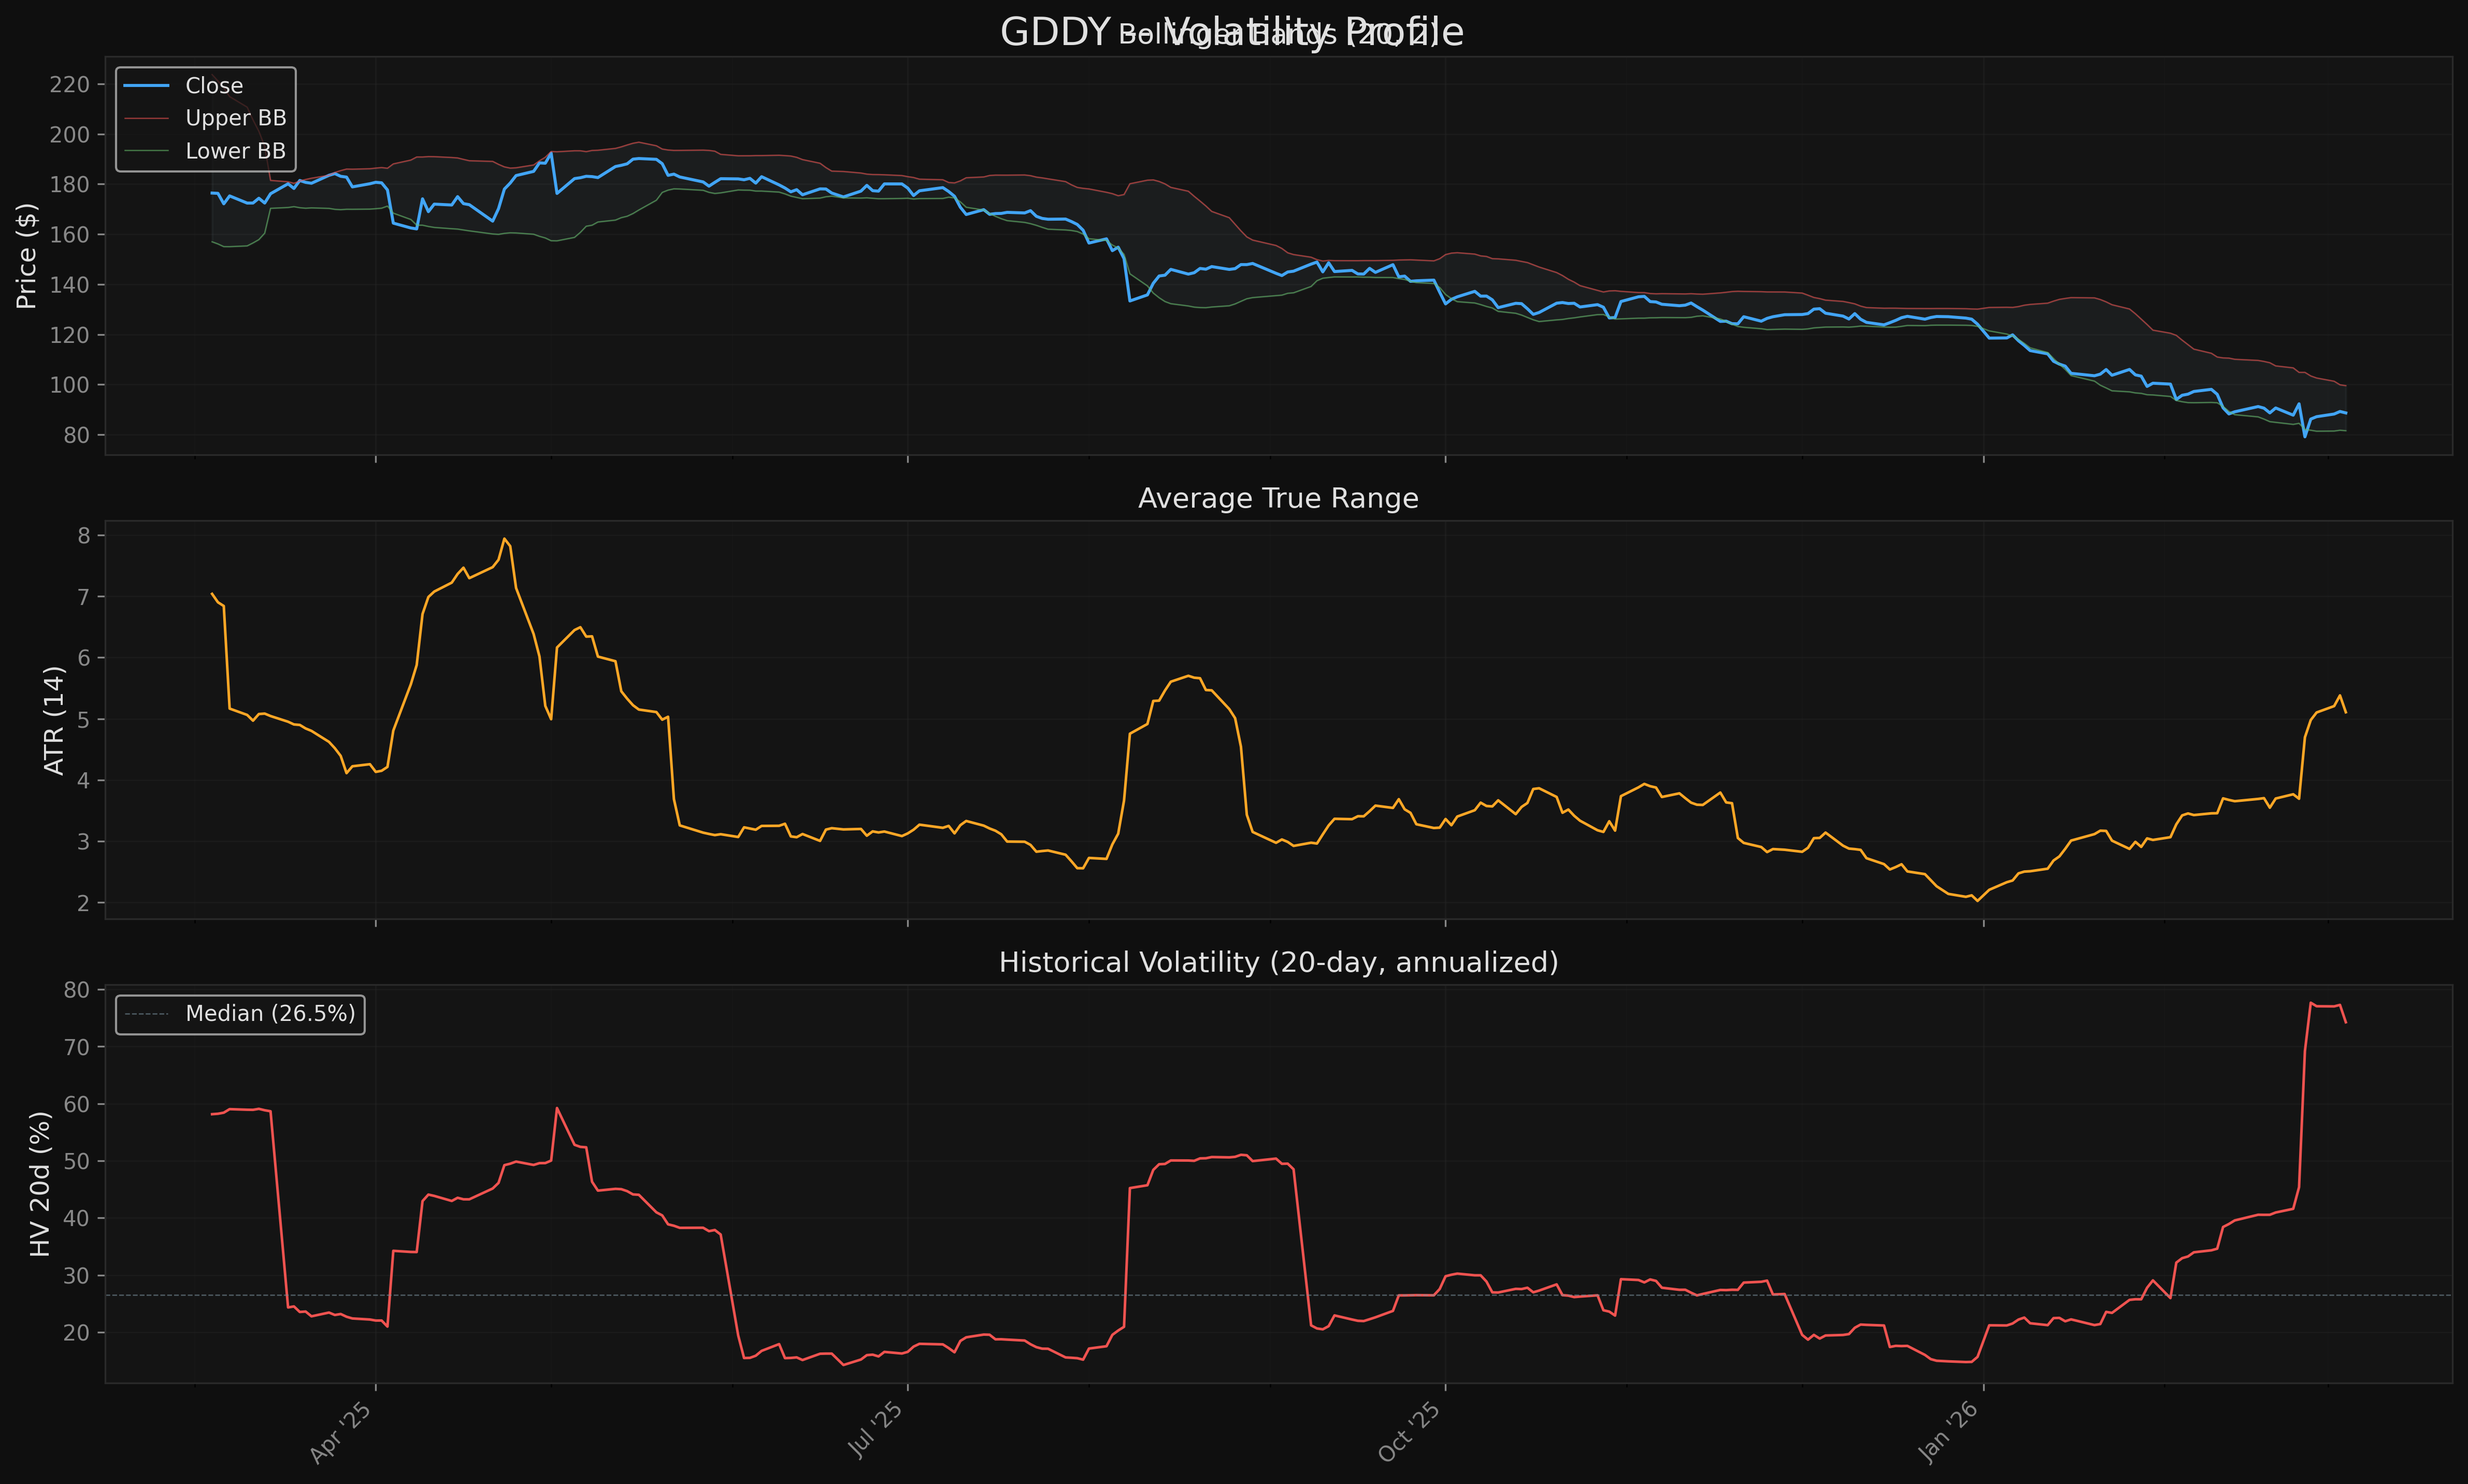
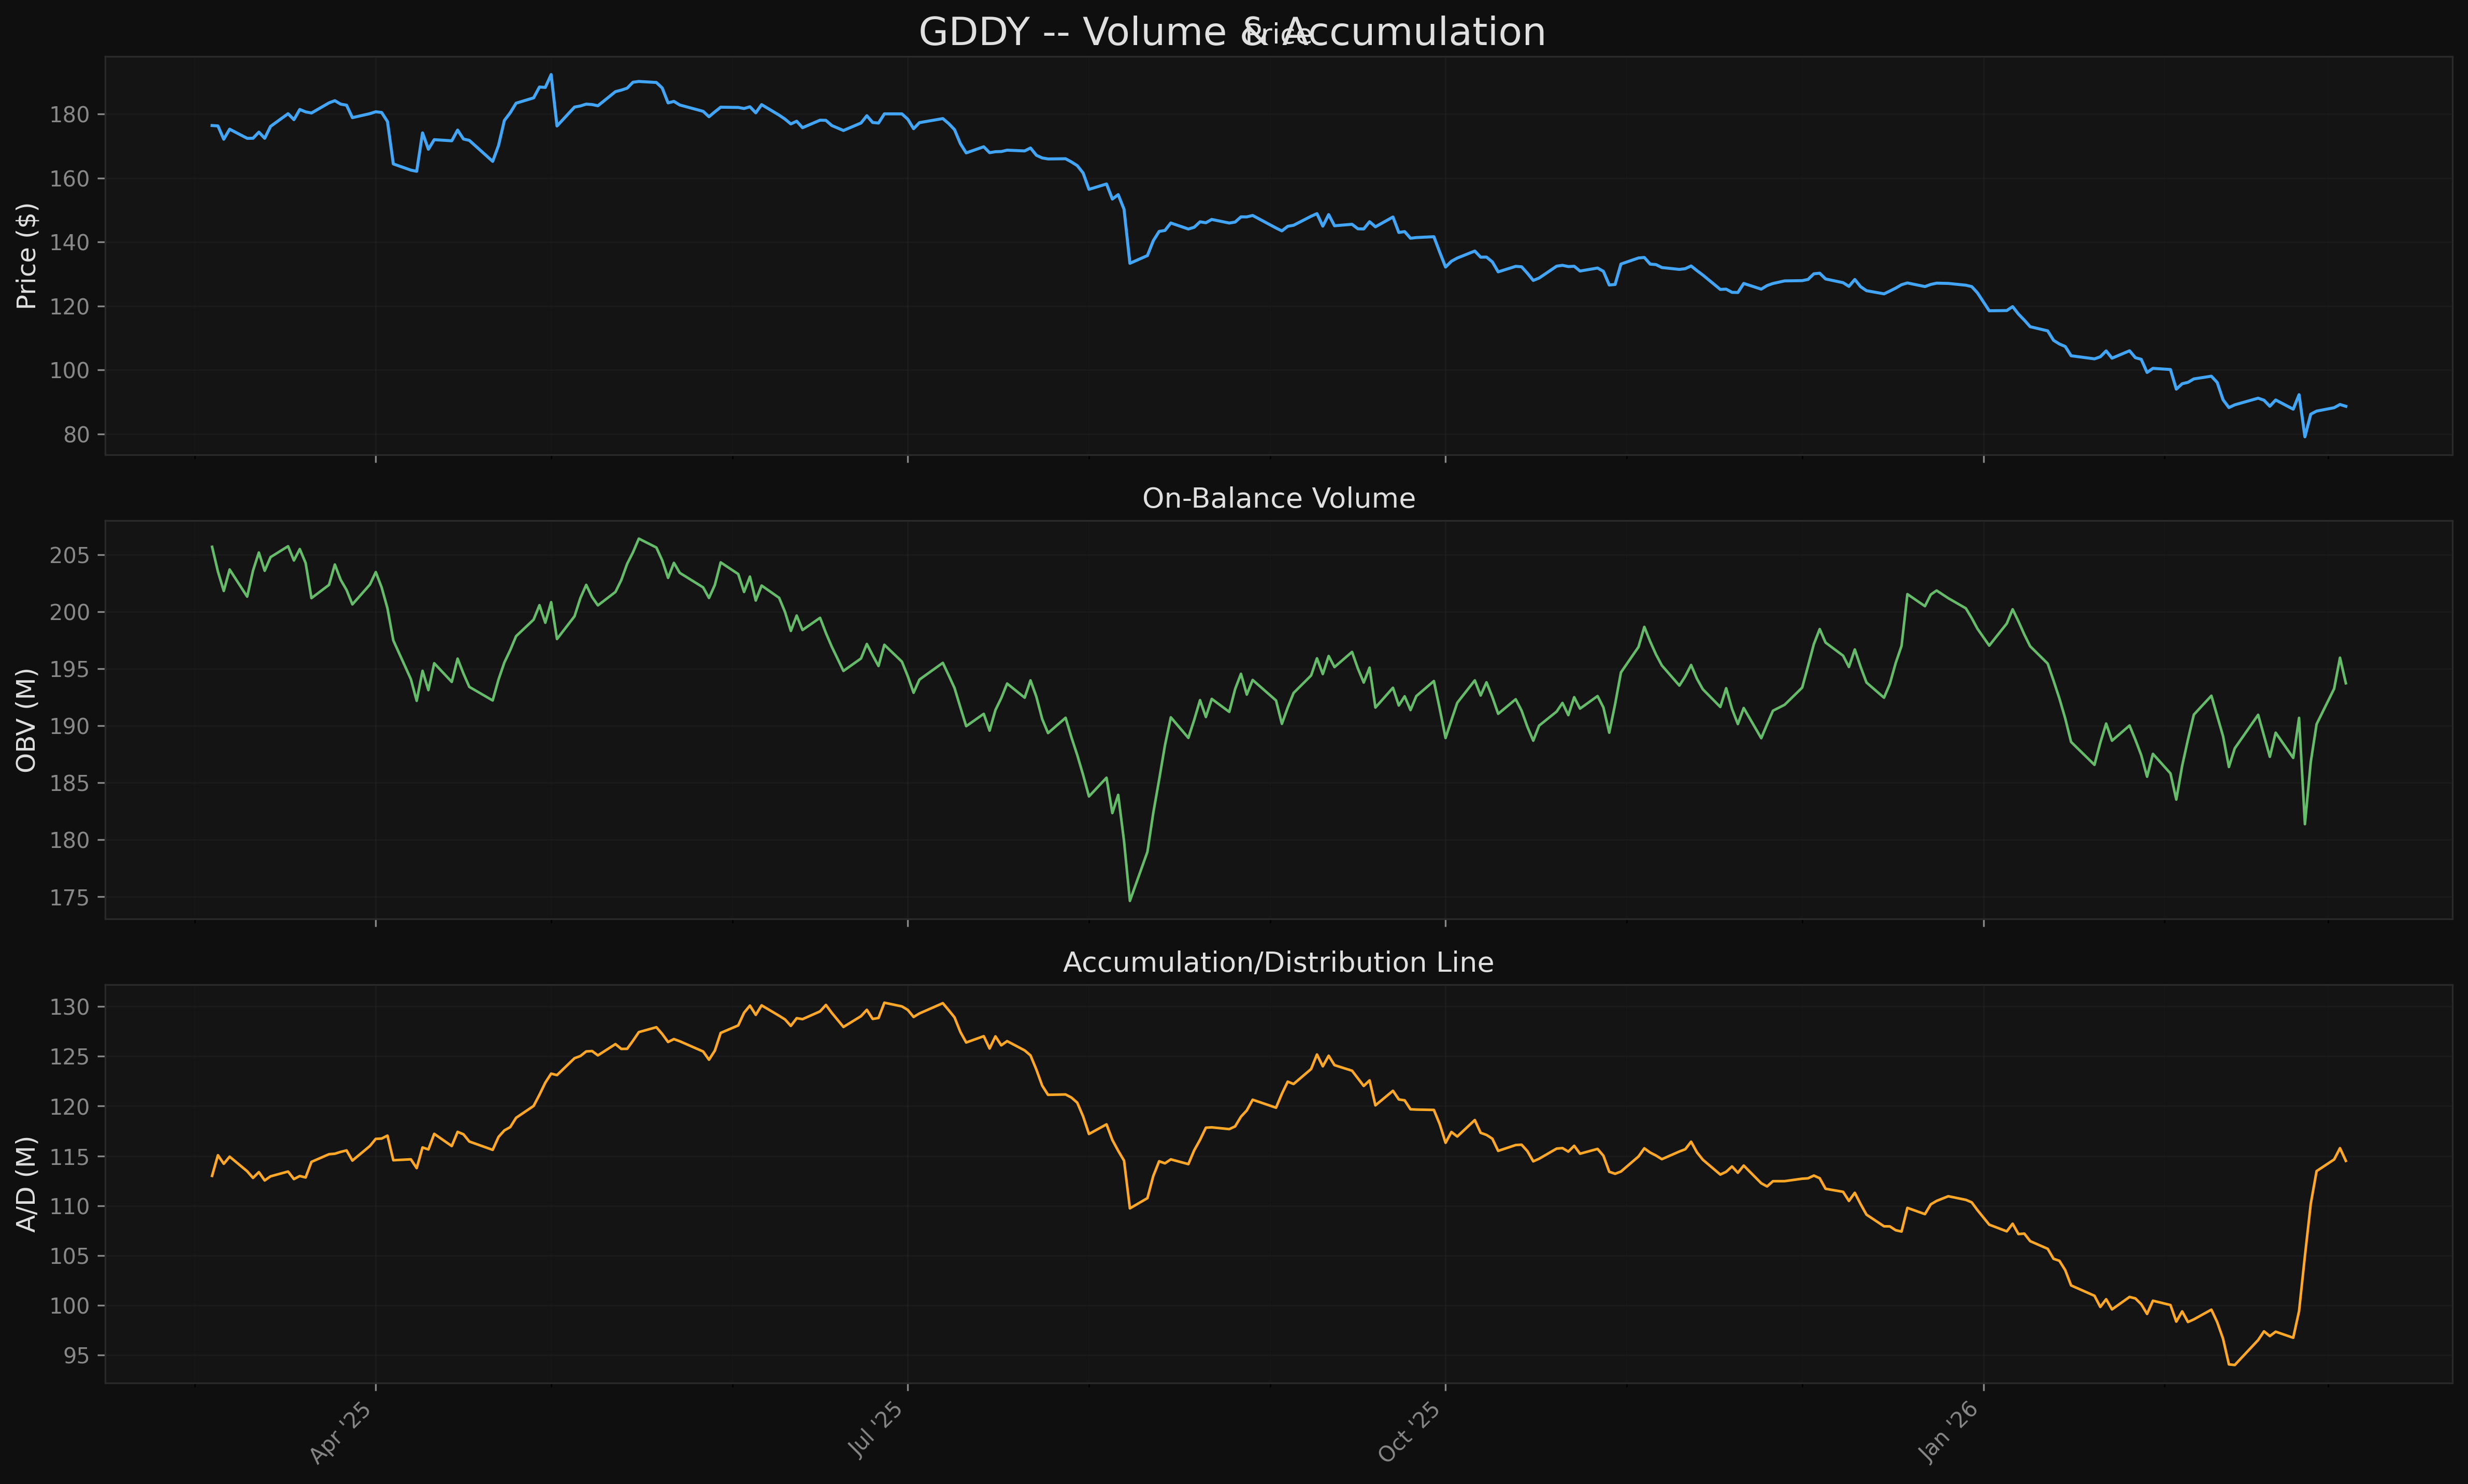
The Quant Researcher scored GDDY at 6.1/10 with a Neutral bias. The setup is deeply conflicted. Momentum (8.5/10) and Volume Confirmation (9.0/10) are strong -- MACD bullish crossover, stochastic rising, OBV and A/D line both trending up, buying volume dominating recent sessions. This suggests genuine accumulation near the 52-week low. However, Trend Alignment (5.0/10), Market Structure (4.5/10), and Volatility Profile (3.0/10) are weak -- price 36.1% below the 200 SMA, all MAs declining steeply, death cross configuration, ATR at 5.76% of price, and 74.25% annualized historical volatility. Two HIGH red flags: deep below 200 SMA (-36.1%) and down 54.2% from 52-week high.
PARTIAL AGREEMENT Assessment
Fundamental-Technical Alignment: PARTIAL-CAUTION
Both analyses converge on the same core conclusion: GDDY has genuine value but is not yet safe to buy. However, they reach this conclusion through different lenses and with different emphasis:
-
Value recognition: Both confirm GDDY is cheap. Fundamentals cite P/E ~16x vs. peer avg ~63x, FCF yield ~9-10%, and highest EBITDA margins in the peer group. Technicals note the stock is 54.2% below its 52-week high with volume patterns suggesting institutional accumulation at these levels.
-
Risk assessment alignment: Both flag the broken technical structure as the primary risk. The fundamental synthesis explicitly lists "value case not confirmed by technical structure" as its only HIGH red flag. The technical analysis confirms this with price below all MAs, death cross configuration, and extreme volatility.
-
Timing divergence: The fundamental analysis looks to Q1 2026 earnings (late April) as the key catalyst that could confirm or deny the value thesis. The technical analysis focuses on shorter-term price levels -- a pullback to $79-82 support or breakout above $92.30. These timeframes don't conflict but point to different entry triggers.
-
Sentiment signals: Both flag the same bearish institutional signals -- no insider buying, rising short interest, and institutional selling. The fundamental analysis interprets this as a missing bottom confirmation signal. The technical analysis notes it as part of the markdown phase structure.
Where they agree most: The stock is fundamentally sound but technically broken. Patience is required. The value case does not expire -- waiting for confirmation costs little relative to the risk of catching a falling knife.
Where they disagree: The technical analysis gives a Neutral 6.1/10 (not a sell signal -- the strong volume/momentum scores reflect genuine accumulation). The fundamental analysis gives a CAUTION 58.8/100 (closer to the edge of the CAUTION band). The technical view is marginally more constructive due to the volume evidence, but neither recommends buying at current levels without confirmation.
Key Levels
| Level | Price | Source |
|---|---|---|
| Resistance 3 | $127.22 | Technical: pivot high cluster |
| Resistance 2 | $106.02 | Technical: pivot high cluster |
| Resistance 1 | $92.30 | Technical: recent pivot high |
| SMA 20 | $90.55 | Technical: immediate resistance |
| Current Price | $88.66 | -- |
| Support 1 | $79.12 | Technical: recent swing low cluster |
| Support 2 | $73.06 | Technical: 52-week low (Feb 25) |
| Fib 0.236 | $101.50 | Technical: first major recovery milestone |
| SMA 50 | $103.83 | Technical: confluence with Fib 0.236 |
Risk/Reward Framework
Scenario 1: Pullback to Swing Low Support (Best Entry)
- Entry: $79-82 (recent swing low cluster)
- Stop: $72.00 (below 52-week low)
- Target 1: $92.30 (R1) -- R:R ~1.5:1
- Target 2: $106.02 (R2) -- R:R ~3.0:1
- Probability: Moderate (45%) -- bounce fades, re-tests support area
Scenario 2: Breakout Confirmation Above SMA 20
- Entry: $91-93 (above SMA 20 and pivot high)
- Stop: $85.00 (mid-range)
- Target 1: $101.50 (Fib 0.236)
- Target 2: $106.02 (R2)
- R:R: ~1.4:1 to T1, ~1.9:1 to T2
- Probability: Moderate (30%) -- accumulation phase develops
Scenario 3: New Lows (Bearish)
- Probability: 25%
- Thesis: Fundamental deterioration continues, $73 low fails on re-test
- Downside target: $60-65 (extension below 52-week low)
- Action: No long entry
Catalyst Timeline
| Date | Event | Expected Impact |
|---|---|---|
| Late Apr / Early May 2026 | Q1 2026 Earnings | HIGH -- symmetric with downside skew |
| Ongoing | Airo AI agent / Airo Plus announcements | MEDIUM -- positive if adoption data disclosed |
| Ongoing | Share buyback execution at depressed prices | MEDIUM -- positive (more accretive at lower prices) |
| No date set | Investor Day | HIGH (if announced) -- would reset narrative |
Conviction Assessment
| Component | Value | Rationale |
|---|---|---|
| Fund-Tech Agreement | 0.6 | Partial -- both cautious but through different lenses; fundamentals slightly more negative |
| Catalyst Density | 0.3 | Sparse -- Q1 earnings in ~45-60 days is the only near-term catalyst, with downside skew |
| Data Quality | 0.6 | Mid-cap with good coverage; price data conflicting across sources (~$88-$120 range in fundamental report) |
| Risk/Reward Asymmetry | 0.65 | Best entry ($79-82) offers ~3:1 to second target; current level offers only ~1.8:1 |
| Red Flag Severity | 0.4 | Mixed -- 3 HIGH flags (1 fundamental, 2 technical) plus 6 MEDIUM; all structural/disclosed |
Conviction Score: 3 (Moderate) Weighted Score: 53.0/100 Position Sizing: 50% of target (starter position)
Actionable Framework
For the RSU position (already holding ~4,100 shares): Hold. There is no sell signal -- the value case is intact, volume shows accumulation, and selling into a 54% drawdown with no fundamental collapse (FCF of $1.6B, expanding margins) would be capitulating at the worst possible time. The fundamentals support patience.
What to watch for sell signals: - Bearish: $73.06 support fails on re-test (new 52-week low), Q1 2026 earnings miss the lowered bar, customer count decline accelerates to -1-2%, or FCF guidance is cut below $1.5B - Bullish escalation: Price reclaims SMA 50 at $103.83, Q1 earnings come in clean with stable customer count, or Airo Plus generates material new revenue
Stop consideration: Given the RSU nature of this position, a hard stop is not recommended. Instead, monitor the $73.06 52-week low -- a sustained break below this level would indicate the markdown is not done and would warrant a reassessment of the hold thesis.
Key support for trailing stop (if desired): $73.00 (just below 52-week low). This gives the position room to re-test the low without triggering a premature exit.
What would change the thesis: - Sell trigger: Q1 miss + customer count decline accelerating + FCF guidance cut (all three together) - Hold reinforced: Q1 clean + buyback acceleration at depressed prices + Airo adoption data
Charts