ETH-USD — Technical Summary
Conviction 3ETH-USD Technical Analysis -- Deep Dive
===========================================================
  ETH-USD -- Technical Analysis                   2026-03-01
  Asset Class: Crypto Token
  Price: $1,983.33  |  52wk: $1,821.68 - $4,831.35
===========================================================

  OVERALL SCORE: 4.0/10      BIAS: Bearish

  COMPONENT SCORES
  -----------------------------------------------------------
  Trend Alignment         2.5/10  wt 25%  Deep below all major MAs
  Momentum                6.5/10  wt 20%  MACD histogram recovering
  Volume Confirmation     3.5/10  wt 20%  OBV declining, weak demand
  Volatility Profile      6.0/10  wt 15%  Elevated but within BB
  Market Structure        2.5/10  wt 20%  Markdown phase, deep drawdown

  KEY LEVELS
  -----------------------------------------------------------
  Resistance 2:  $3,382.69   Swing high cluster
  Resistance 1:  $3,057.04   Nearest swing high cluster
  Current Price: $1,983.33
  Support 1:     $1,897.33   Recent swing low
  Support 2:     $1,804.11   Secondary swing low cluster

  RED FLAGS                                    (3 found)
  -----------------------------------------------------------
  HIGH  Death Cross: 50-day SMA below 200-day SMA        [Trend]
  HIGH  Price -58.9% from 52-week high -- deep drawdown  [Structure]
  HIGH  Wyckoff phase: Markdown -- trend is against longs [Structure]

===========================================================
2. Executive Summary
ETH-USD is in a severe downtrend. The token has lost 58.9% from its 52-week high of $4,831.35, currently trading at $1,983.33. All major moving averages slope downward, a Death Cross is in effect (50-day SMA below 200-day SMA), and price trades below every SMA except the 10-day and 20-day. The Wyckoff phase is Markdown with strong statistical confidence (R-squared = 0.62 over the trailing 120 days, annualized slope of -$4,129/year).
The sole bright spot is short-term momentum: the MACD histogram has turned positive (36.65), RSI at 42.65 is recovering from oversold territory, and the 7-day return of +6.89% suggests a tactical bounce attempt from the $1,748-$1,900 support zone. However, this sits squarely within the context of a bear market relief rally -- the kind of mean-reversion bounce that typically fails at overhead resistance from declining moving averages.
The overall technical score of 4.0/10 reflects a bearish environment where trend, volume, and structure all score poorly. Only momentum (recovering from extremes) and volatility (contained within Bollinger Bands) offer any constructive readings. Position sizing should be minimal and stops tight.
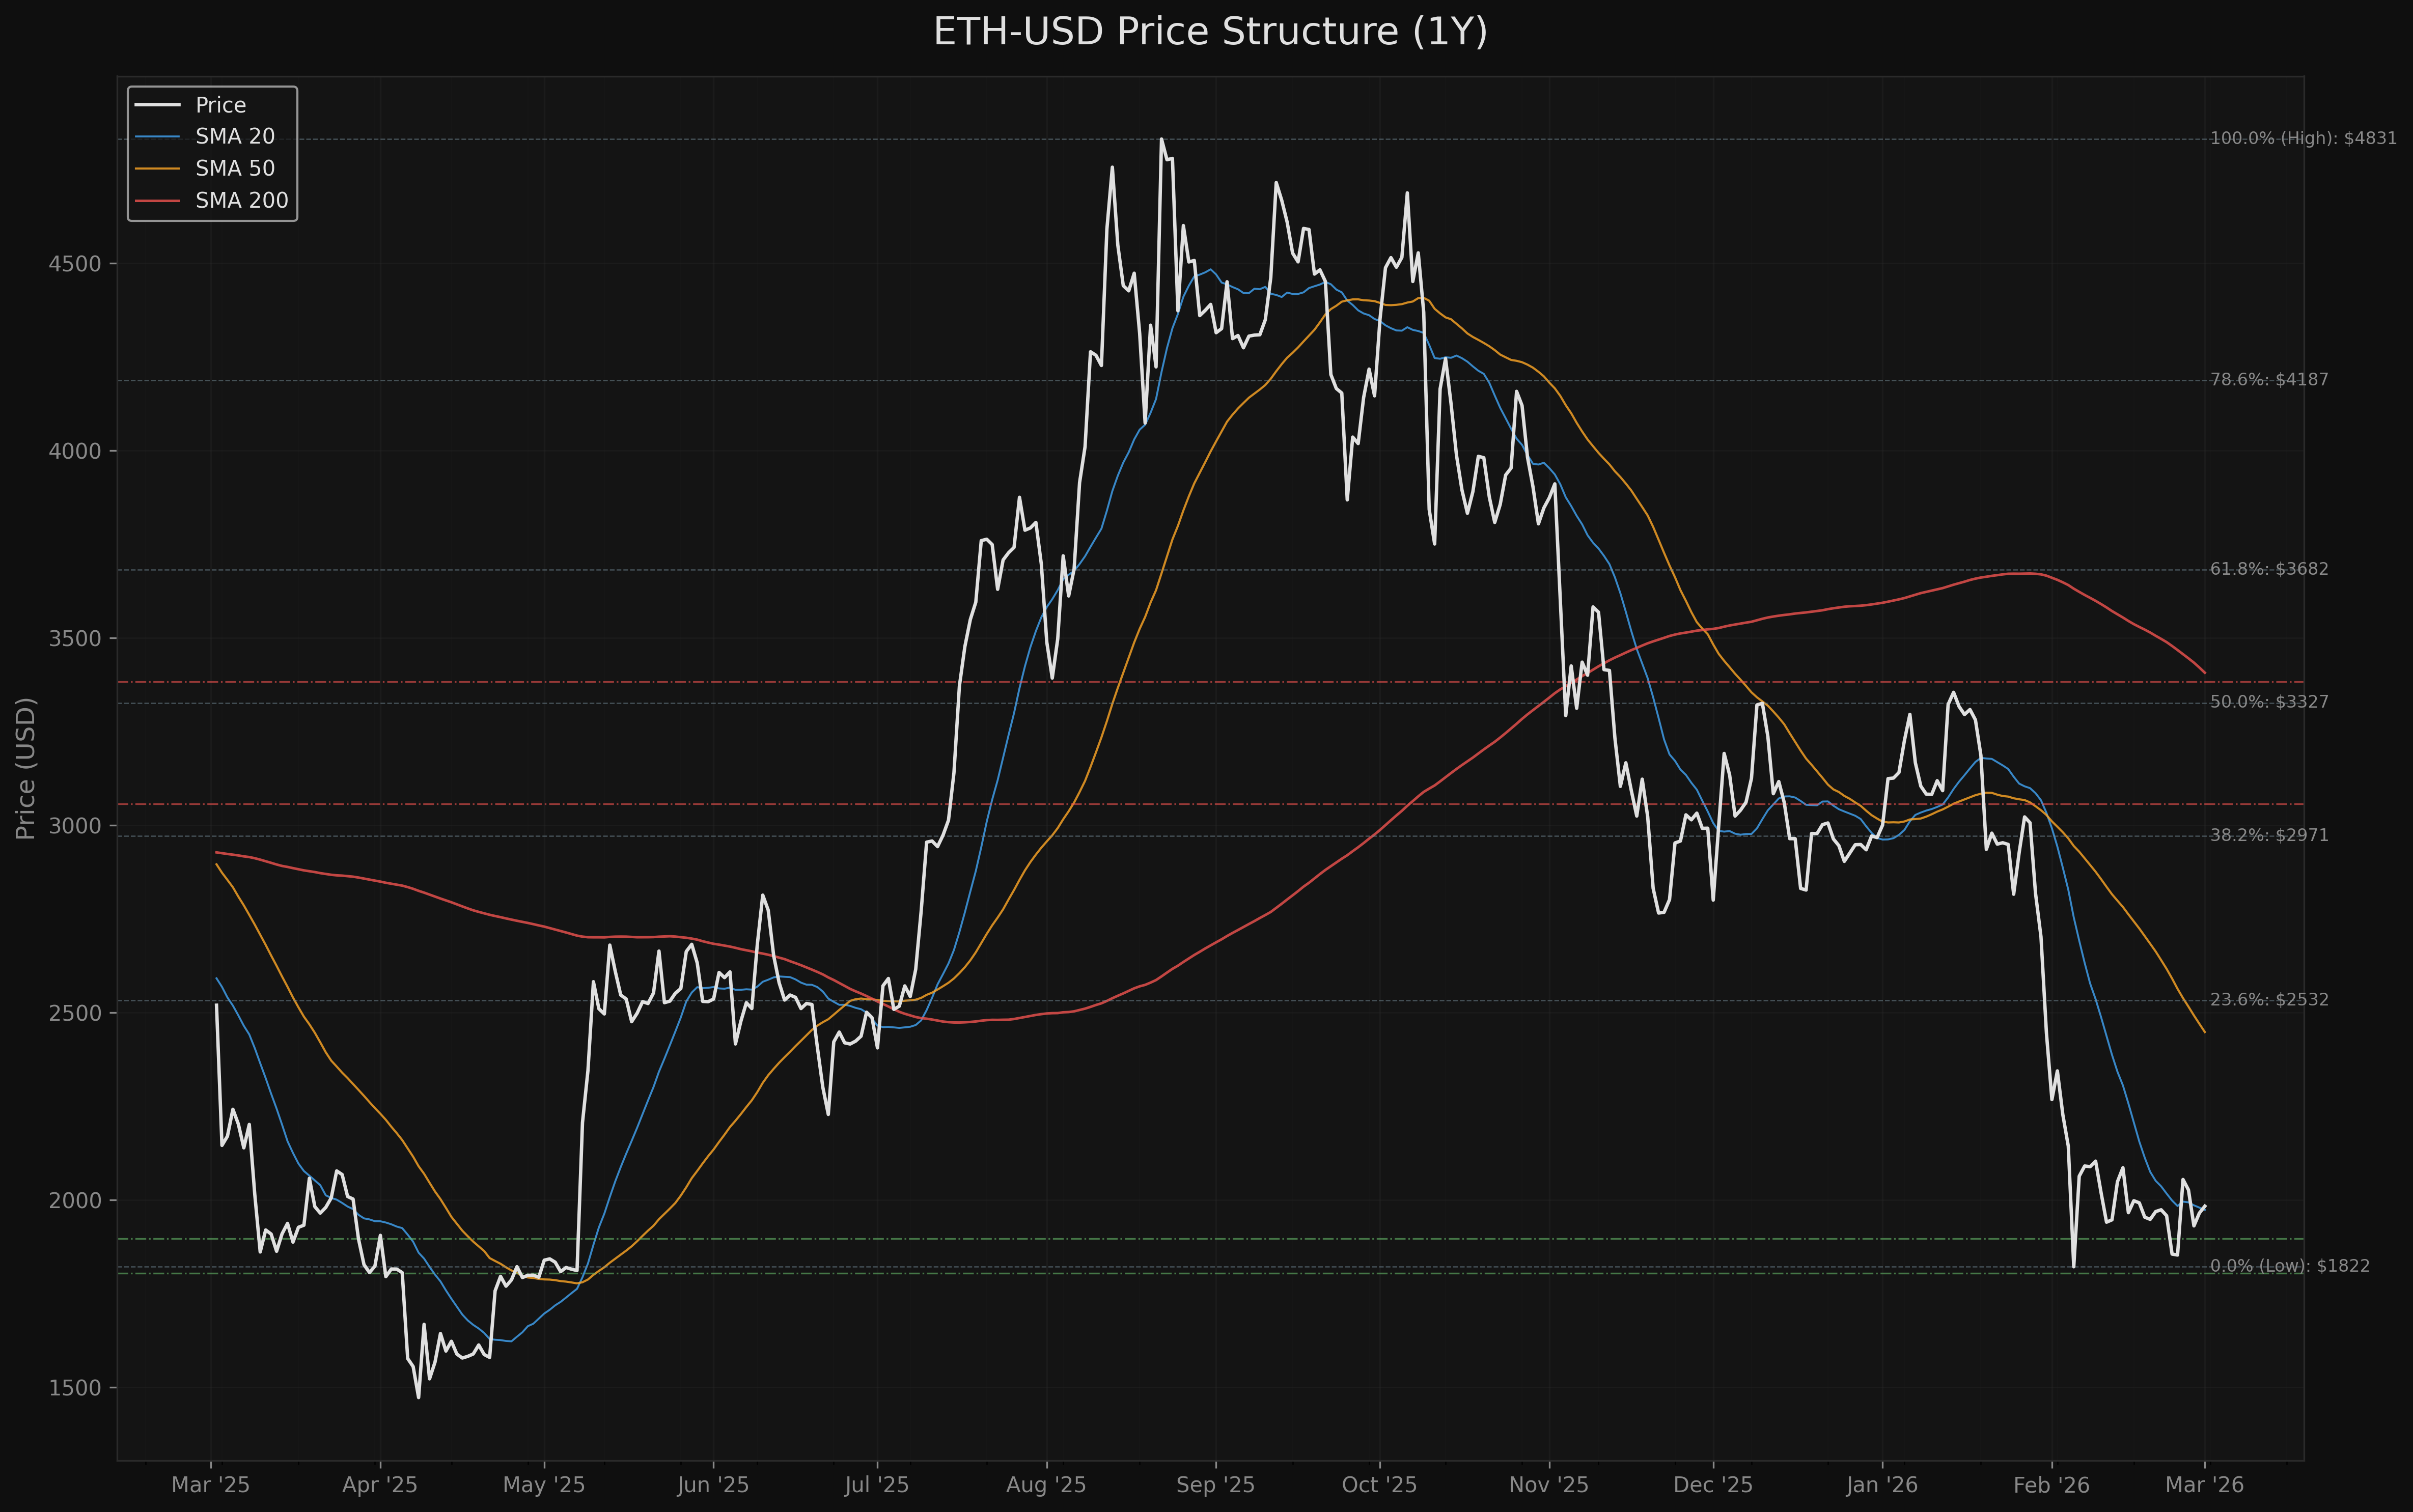
3. Price Structure
52-Week Range
| Metric | Value |
|---|---|
| 52-Week High | $4,831.35 |
| 52-Week Low | $1,821.68 |
| Current Price | $1,983.33 |
| Range Position | 5.4% (near the low) |
| Distance from High | -58.9% |
| Distance from Low | +8.9% |
Price is hugging the bottom of its annual range, sitting at just the 5.4th percentile of the 52-week range. This is an extreme reading that signals either deep capitulation or a forming base.
Fibonacci Retracements (52-Week Range)
| Level | Price | Status |
|---|---|---|
| 0.0% (Low) | $1,821.68 | Below current (support) |
| 23.6% | $2,531.96 | First overhead Fibonacci level |
| 38.2% | $2,971.38 | Major resistance zone |
| 50.0% | $3,326.52 | Mid-range |
| 61.8% | $3,681.66 | Key Fibonacci resistance |
| 78.6% | $4,187.28 | Upper range |
| 100.0% (High) | $4,831.35 | 52-week high |
The current price at $1,983.33 sits below even the 23.6% Fibonacci retracement ($2,531.96), meaning ETH-USD has not yet achieved any meaningful recovery from the selloff. The nearest Fibonacci resistance is over $500 (27.7%) above current price.
Recent Performance
| Window | Return |
|---|---|
| 7 days | +6.89% |
| 14 days | -0.73% |
| 30 days | -18.89% |
| 60 days | -33.90% |
| 90 days | -33.84% |
| 180 days | -55.43% |
| 365 days | -21.29% |
The 7-day bounce of +6.89% is the only positive timeframe. Every other window is deeply negative, with 180-day performance at -55.43%. The magnitude of losses accelerated recently: -33.9% over 60 days implies the selloff intensified in January-February 2026.
Chart
4. Market Structure (Wyckoff Phase)
Quantitative Evidence
| Metric | Value | Interpretation |
|---|---|---|
| Price slope (annualized) | -$4,128.62/year | Strong downward trend |
| R-squared | 0.6187 | Good linear fit -- consistent decline |
| p-value | < 0.000001 | Statistically significant |
| Volume slope | -75M/day | Volume declining alongside price |
| ATR slope | -0.73/day | Volatility contracting from peak |
| Range ratio (2nd/1st half) | 2.40 | Price dispersion widening -- destabilizing |
| HH/HL Status | Mixed/Choppy | No clean trending structure |
Phase: Markdown
The data overwhelmingly supports a Markdown classification:
- Price trend is strongly negative with an annualized slope of -$4,129/year and R-squared of 0.62, meaning 62% of the variance in the last 120 days is explained by a simple linear downward trend.
- The decline is statistically significant (p < 0.000001).
- Range expansion (2nd half dispersion is 2.4x the 1st half) suggests increasing instability, not the tightening one would expect in accumulation.
- Volume is declining alongside price, which can indicate either seller exhaustion (constructive) or loss of buyer interest (destructive). Given the absence of higher lows, the latter interpretation is more likely.
The 7-day bounce does not yet constitute evidence of phase transition. A shift from Markdown to Accumulation would require: (a) price stabilization with declining volatility, (b) volume drying up on selloffs, (c) higher lows forming on the daily chart. None of these conditions are confirmed.
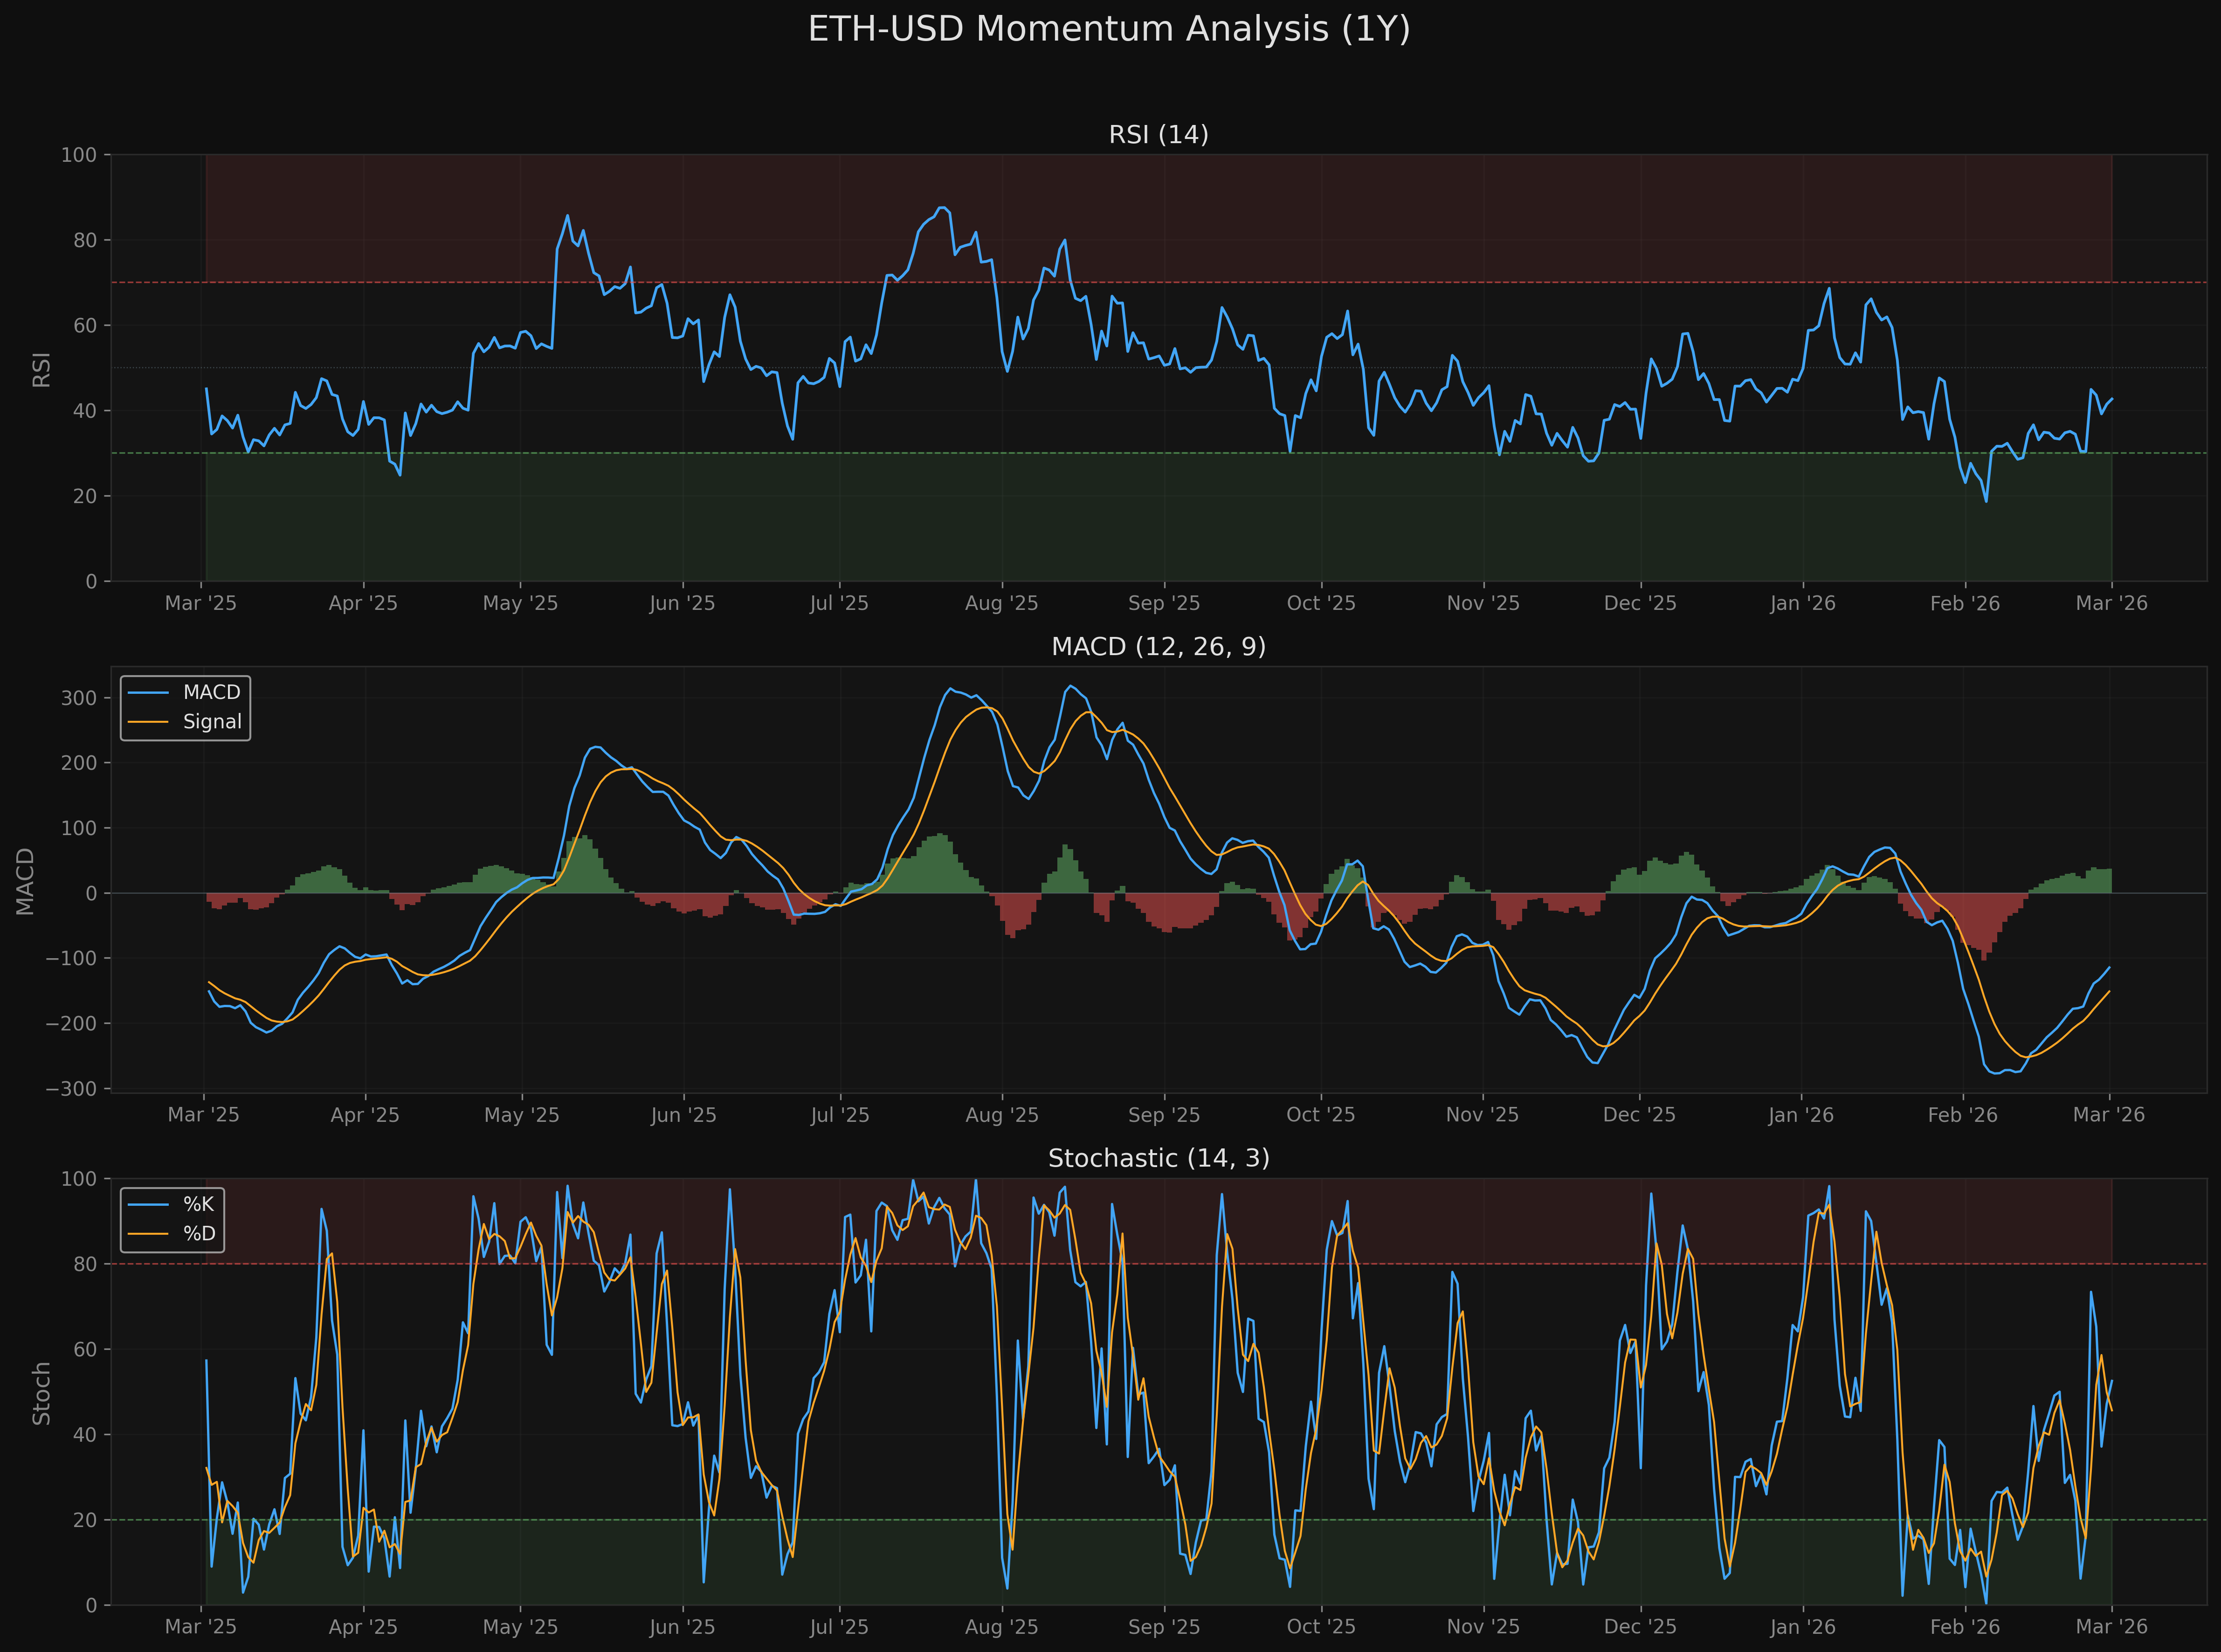
5. Momentum Analysis
RSI (14-period)
| Metric | Value |
|---|---|
| Current RSI | 42.65 |
| Zone | Neutral (recovering from oversold) |
| Recent low | Below 30 in recent selloff |
| Trend | Rising from oversold |
RSI at 42.65 is in the lower half of neutral territory, having recently recovered from oversold levels during the selloff. It has not yet crossed above 50, which would signal a shift to bullish momentum. The recovery from oversold is a constructive near-term signal, but RSI often fails at 50-55 in established downtrends.
MACD (12, 26, 9)
| Metric | Value |
|---|---|
| MACD Line | -114.83 |
| Signal Line | -151.48 |
| Histogram | +36.65 |
| Histogram 5d ago | Negative |
| MACD Position | Below zero, converging |
The MACD histogram has turned positive, indicating that the MACD line is crossing above the signal line. Both lines remain deeply negative (below zero), confirming the broader bearish trend. A positive histogram in this context typically signals a bear market rally rather than a trend reversal. The MACD line would need to cross above zero for a genuine trend change signal.
Stochastic (14, 3)
| Metric | Value |
|---|---|
| %K | 52.50 |
| %D | 45.58 |
| Position | Neutral, %K above %D |
The Stochastic oscillator has recovered to neutral territory from oversold. %K crossing above %D is a short-term bullish signal, but the reading at 52.50 is not yet in overbought territory. In downtrends, stochastic readings tend to cap around 60-70 before rolling over.
Chart
6. Moving Average Analysis
Current MA Positioning
| MA | Value | Price vs. MA | Slope (Ann.) |
|---|---|---|---|
| SMA 10 | $1,956.96 | +1.3% above | -- |
| SMA 20 | $1,973.48 | +0.5% above | -404.78% |
| EMA 20 | $2,032.43 | -2.4% below | -- |
| SMA 50 | $2,448.02 | -19.0% below | -271.53% |
| EMA 50 | $2,328.79 | -14.8% below | -- |
| SMA 100 | $2,738.68 | -27.6% below | -- |
| EMA 100 | $2,674.96 | -25.9% below | -- |
| SMA 200 | $3,406.96 | -41.8% below | -97.29% |
| EMA 200 | $2,964.47 | -33.1% below | -- |
Key Observations
-
Price above only SMA 10 and SMA 20: only the shortest-term MAs are providing any support. The price is massively below all intermediate and long-term averages.
-
Death Cross in effect: SMA 50 ($2,448) is well below SMA 200 ($3,407). The gap between them is enormous ($959), suggesting the death cross is deeply entrenched and a golden cross is far off.
-
All MA slopes are negative: SMA 20 slope at -404.78% annualized, SMA 50 at -271.53%, SMA 200 at -97.29%. Every timeframe confirms the downtrend.
-
EMA 20 acts as resistance: Price at $1,983 is below the EMA 20 ($2,032), which has been acting as dynamic resistance during the downtrend.
-
Massive distance from SMA 200: At -41.8% below the 200-day SMA, ETH-USD is extremely stretched to the downside. While this can produce mean-reversion bounces, it also signals a broken trend structure that takes time to repair.
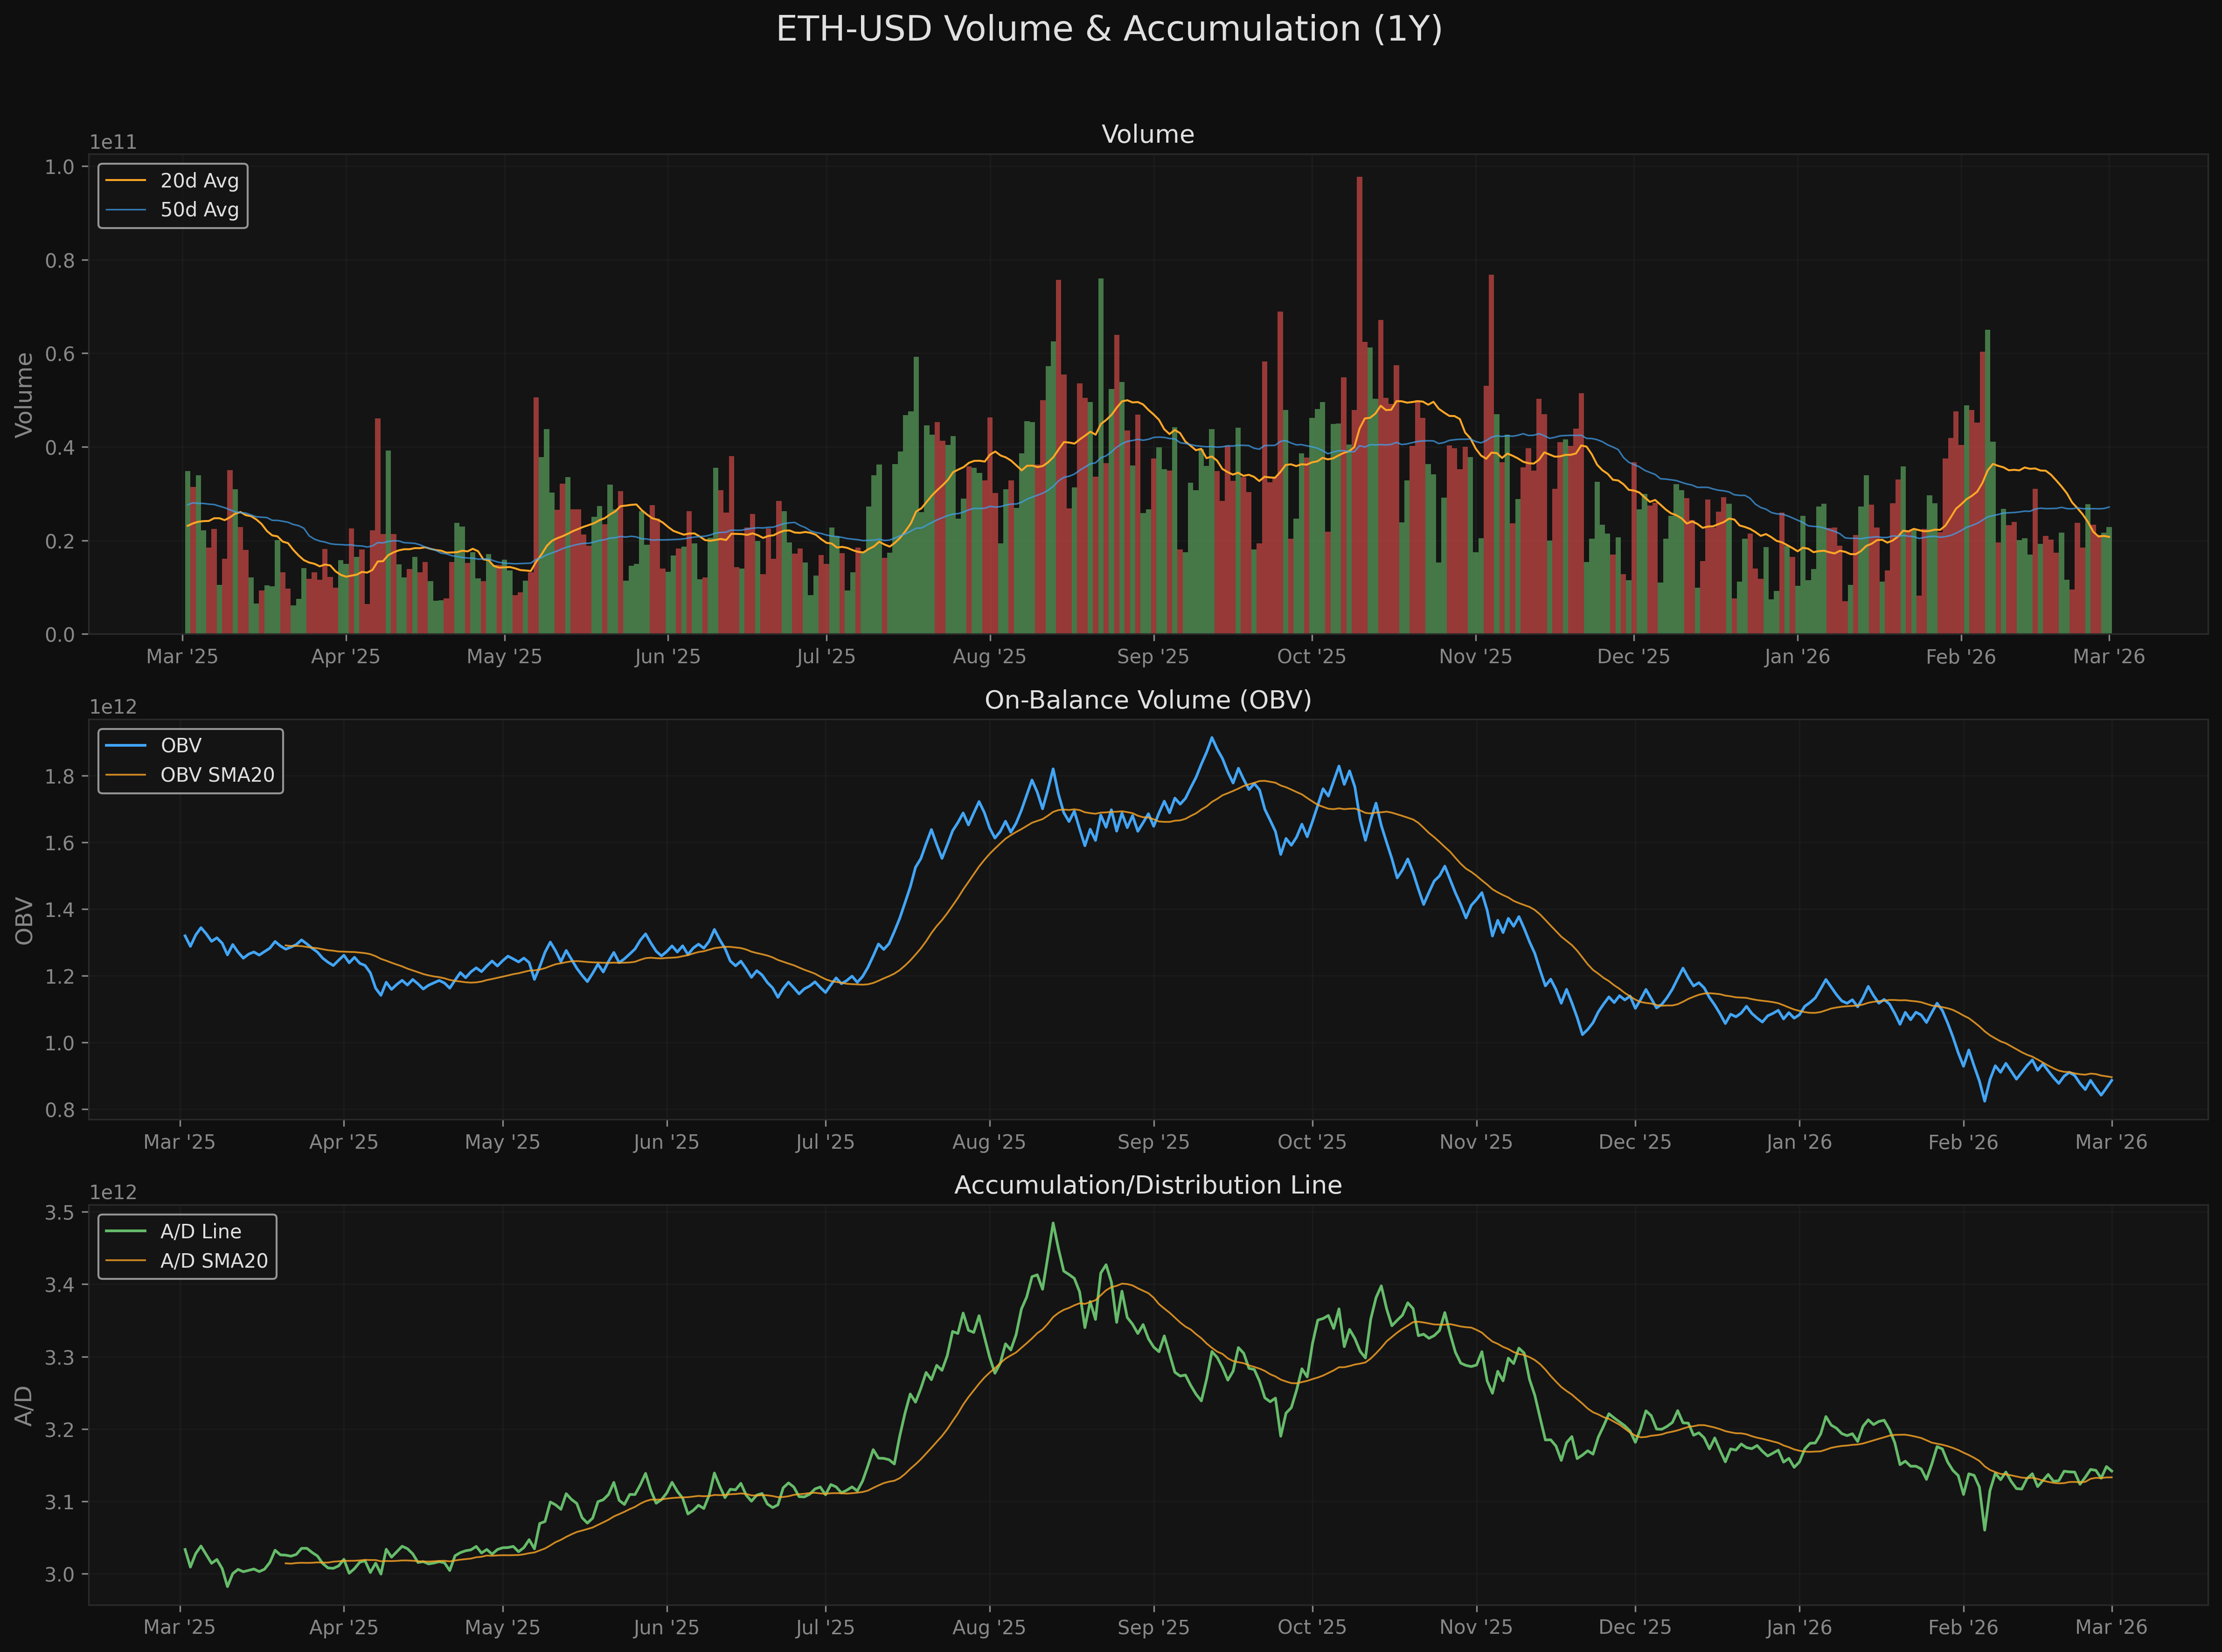
7. Volume Analysis
Volume Metrics
| Metric | Value |
|---|---|
| Current Volume | 22,812,594,176 |
| 20-day Average | 20,749,553,871 |
| Volume Ratio | 1.10x (slightly above average) |
| OBV 20-day Change | -50,763,970,276 |
| A/D Line Trend (20d) | Declining |
On-Balance Volume (OBV)
OBV has been declining over the past 20 days, with a loss of approximately 50.8 billion units. This indicates that volume on down days has outweighed volume on up days, confirming distribution (selling pressure) rather than accumulation. OBV is below its 20-day moving average, a bearish confirmation signal.
Accumulation/Distribution Line
The A/D line measures whether volume is flowing into or out of the asset based on the close's position within the day's range. The 20-day A/D slope is negative, corroborating the OBV reading: money flow is net negative.
Interpretation
Volume is slightly above its 20-day average (1.10x), which is neither extreme nor unusual. The concerning signal is the directional composition: both OBV and A/D confirm that selling pressure dominates. For a genuine trend reversal, one would want to see OBV diverging positively (rising while price stabilizes or makes lower lows). That divergence is not present.
Chart
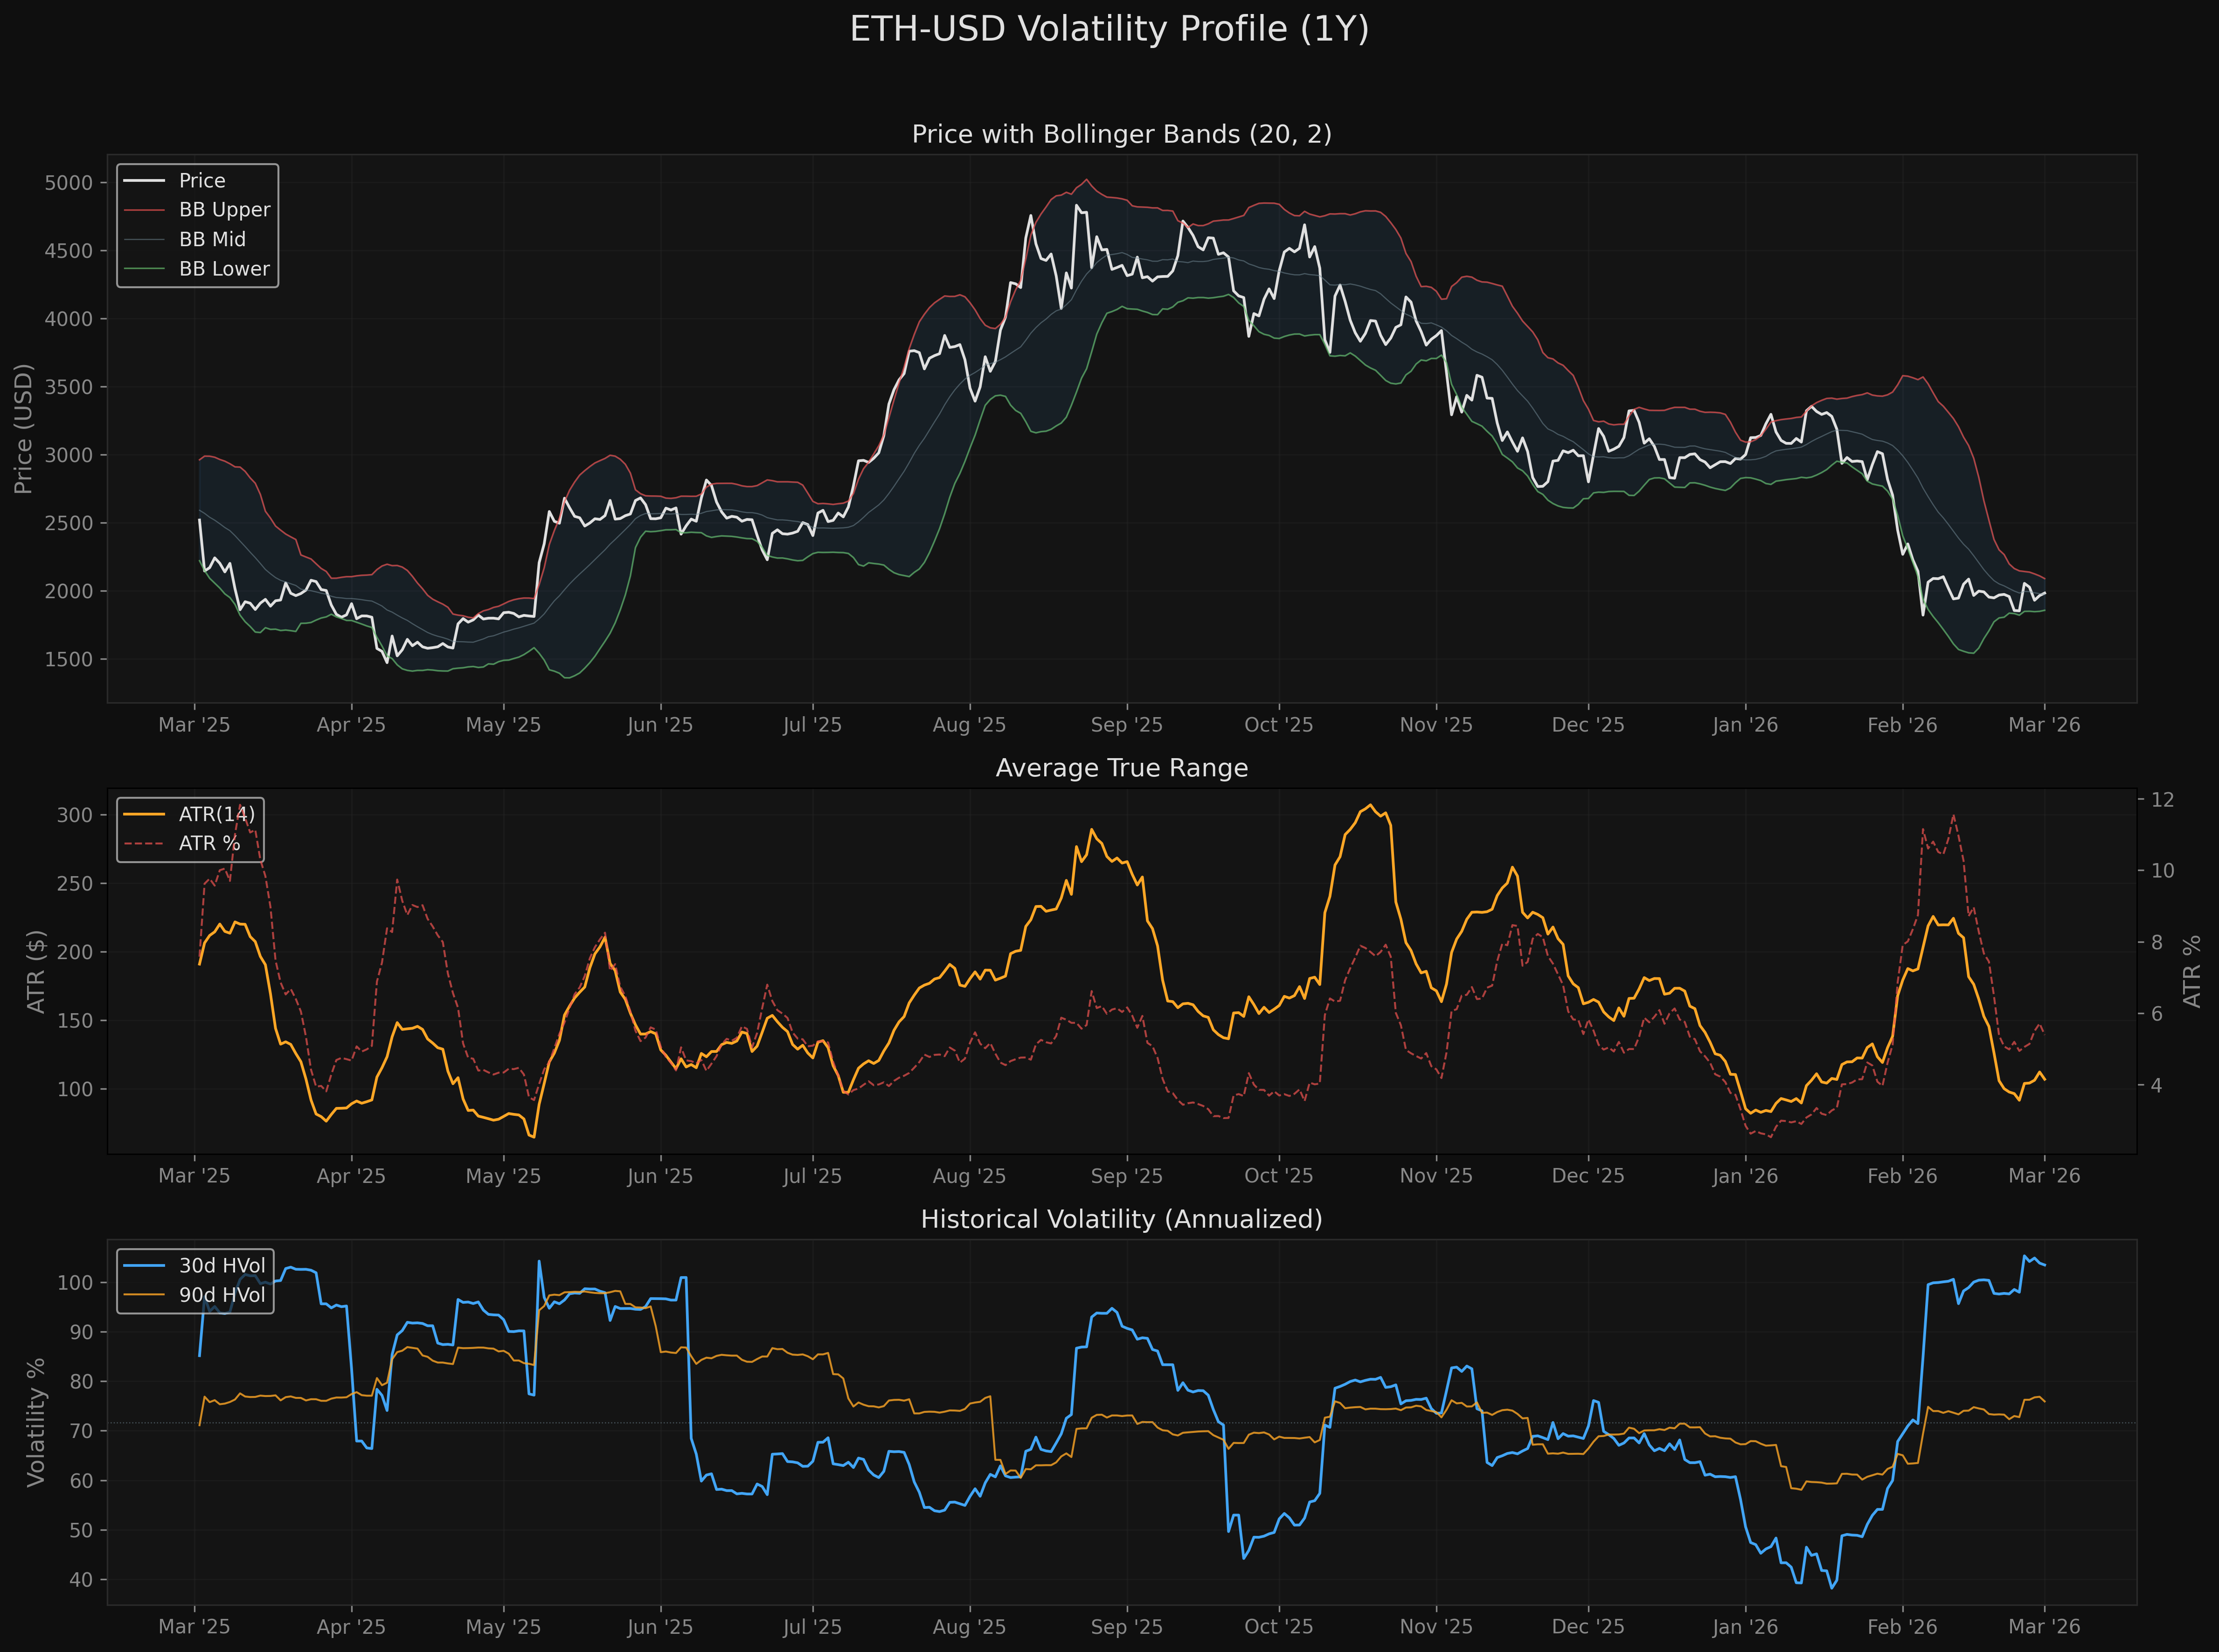
8. Volatility Profile
Volatility Metrics
| Metric | Value |
|---|---|
| ATR (14) | $106.90 |
| ATR % | 5.39% |
| Bollinger Band Width | 11.80% |
| BB %B | 0.5423 |
| 30-day Historical Vol (ann.) | 103.5% |
| 90-day Historical Vol (ann.) | 75.9% |
| Return Skew (1yr) | +0.1545 |
| Return Kurtosis (1yr) | 2.2350 |
ATR Analysis
ATR at $106.90 represents 5.39% of price. For a major crypto asset, this is elevated but not extreme (crypto typically ranges 3-8%). The ATR has been declining (slope of -0.73/day over the last 120 days), suggesting that volatility is contracting from its peak -- which could indicate either exhaustion of the selloff or a coiling period before the next major move.
Bollinger Bands
Price sits at 54.2% B-position (0.5423), placing it almost exactly at the midpoint of the Bollinger Bands. This is a neutral reading -- neither stretched nor compressed against the bands. The BB width at 11.80% is elevated, reflecting the high absolute volatility of the recent period.
Return Distribution
- Skew of +0.15: nearly symmetric with a slight positive skew. This is somewhat unusual for a bear market and may reflect the recent bounce distorting the 1-year distribution.
- Kurtosis of 2.24: below the normal distribution's kurtosis of 3 (platykurtic). This suggests returns have been less extreme than a normal distribution would predict over the trailing year, which is a mildly constructive finding for risk management purposes.
Chart
9. Entry Point Assessment
Given the bearish overall bias, entries should be approached with extreme caution. Any position must be sized for the possibility of further downside. The following confluence zones are identified:
Zone 1: Primary Support ($1,859 - $1,935)
Confluence factors: - Swing low cluster at $1,897.33 - Near 52-week low zone ($1,821.68) - Recent price stabilization in this area
Risk/Reward: - Entry: ~$1,897 - Stop: $1,768 (below 52-week low support cluster at $1,748) - Target 1: $2,532 (Fibonacci 23.6%) - R:R = 1:4.92
Quality: Moderate. This is a "catching a falling knife" entry. The support zone is identifiable but has not yet been tested with a convincing bounce-and-retest pattern. Suitable only for small tactical positions with hard stops.
Zone 2: 52-Week Low Retest ($1,748 - $1,822)
Confluence factors: - Absolute 52-week low at $1,821.68 - Swing low cluster at $1,748.63 - Psychological $1,800 round number
Risk/Reward: - Entry: ~$1,800 - Stop: $1,700 (below all support) - Target 1: $1,983 (current price as resistance) - R:R = 1:1.83
Quality: Low-moderate. This is a capitulation entry. Only viable if volume spikes on the test (climactic selling) followed by a reversal candle. Without that confirmation, this level may not hold.
10. Risk/Reward Framework
Scenario 1: Bear Market Rally to Fibonacci 23.6% (Bull Case)
| Parameter | Value |
|---|---|
| Entry | $1,983.33 (current) |
| Target | $2,531.96 (Fibonacci 23.6%) |
| Stop | $1,768.03 (below swing low cluster) |
| Risk | $215.30 (10.9%) |
| Reward | $548.63 (27.7%) |
| R:R | 1:2.55 |
| Probability Estimate | Low (25-35%) |
Rationale: In markdown phases, rallies to the first Fibonacci retracement level are common but unreliable. The 23.6% retracement at $2,532 also sits near the SMA 50 ($2,448), creating a resistance confluence that would be difficult to penetrate without fundamental catalysts. The MACD histogram turning positive supports the possibility of a multi-week bounce, but the depth of the downtrend limits upside potential.
Scenario 2: Continued Markdown to New Lows (Bear Case)
| Parameter | Value |
|---|---|
| Entry | Short or cash |
| Target | $1,500 (psychological/measured move) |
| Stop (for shorts) | $2,200 (above recent consolidation) |
| Risk | $216.67 (10.9%) |
| Reward | $483.33 (24.4%) |
| R:R | 1:2.23 |
| Probability Estimate | Moderate (40-50%) |
Rationale: The Markdown phase, Death Cross, declining OBV, and position near the bottom of the annual range all favor continued weakness. If support at $1,748-$1,822 breaks, the next historical support zone is in the $1,400-$1,600 range (2022 bear market lows). The ATR of $107 means a 5-day cascade could easily reach $1,500.
Scenario 3: Base Formation and Recovery (Neutral-to-Bull Case)
| Parameter | Value |
|---|---|
| Timeframe | 2-4 months |
| Entry | On confirmed base ($1,800-$2,000 range with declining volume) |
| Target | $3,057.04 (swing high cluster) |
| Stop | $1,748 (below base) |
| Risk | ~$200 (10-12%) |
| Reward | ~$1,074 (54.1%) |
| R:R | 1:5.37 |
| Probability Estimate | Low-moderate (20-30%) |
Rationale: If the current bounce develops into a multi-week consolidation with declining volume and ATR, it could form an accumulation base. This would be the most favorable entry but requires patience and confirmation. Key signals to watch: higher lows on daily chart, OBV divergence, RSI holding above 40.
11. Key Levels Summary
| Level | Price | Type | Description |
|---|---|---|---|
| $4,831.35 | Resistance | 52-week high | Major resistance, far overhead |
| $4,759.29 | Resistance | Swing high cluster | Near 52-week high |
| $4,250.67 | Resistance | Swing high | December 2025 peak zone |
| $3,681.66 | Resistance | Fibonacci 61.8% | Key Fibonacci level |
| $3,656.15 | Resistance | Swing high cluster | Late 2025 resistance |
| $3,406.96 | Resistance | SMA 200 | Long-term trend MA |
| $3,382.69 | Resistance | Swing high cluster | Secondary resistance |
| $3,326.52 | Resistance | Fibonacci 50.0% | Mid-range Fibonacci |
| $3,057.04 | Resistance | Swing high cluster | Nearest major resistance |
| $2,971.38 | Resistance | Fibonacci 38.2% | Key Fibonacci retracement |
| $2,531.96 | Resistance | Fibonacci 23.6% | First Fibonacci target for bounce |
| $2,448.02 | Resistance | SMA 50 | Declining intermediate MA |
| $2,032.43 | Resistance | EMA 20 | Short-term dynamic resistance |
| $1,973.48 | Support | SMA 20 | Short-term MA support |
| $1,983.33 | Current | -- | Current price |
| $1,956.96 | Support | SMA 10 | Immediate support |
| $1,897.33 | Support | Swing low | Recent swing low cluster |
| $1,821.68 | Support | 52-week low | Annual floor |
| $1,804.11 | Support | Swing low cluster | Secondary support |
| $1,748.63 | Support | Swing low | Deepest recent swing low |
12. Overall Technical Score
Weighted Composite Breakdown
| Component | Score | Weight | Weighted | Rationale |
|---|---|---|---|---|
| Trend Alignment | 2.5/10 | 25% | 0.625 | Price below all MAs except SMA 10/20; Death Cross; all MA slopes deeply negative |
| Momentum | 6.5/10 | 20% | 1.300 | MACD histogram positive, RSI recovering from oversold, Stochastic neutral -- but all within context of bear rally |
| Volume Confirmation | 3.5/10 | 20% | 0.700 | OBV declining, A/D line negative, volume composition favors sellers |
| Volatility Profile | 6.0/10 | 15% | 0.900 | ATR% elevated but contracting; BB %B neutral; return distribution not fat-tailed |
| Market Structure | 2.5/10 | 20% | 0.500 | Markdown Wyckoff phase; -58.9% from high; no higher lows or higher highs |
| Overall | 4.0/10 | 100% | 4.025 | Bearish |
The overall score of 4.0/10 reflects a market firmly in bearish territory. The only components scoring above 5.0 are momentum (which captures the short-term bounce) and volatility (which is not yet at crisis levels). The three structural components -- trend, volume, and market structure -- all score below 4.0, indicating that the fundamental technical picture is broken.
Score Interpretation
- 0-3.0: Strong sell / avoid entirely
- 3.1-4.5: Bearish -- minimal exposure, tight stops
- 4.6-5.5: Neutral -- watch for direction
- 5.6-7.0: Moderately bullish -- normal position sizing
- 7.1-10.0: Strongly bullish -- full conviction
At 4.0, ETH-USD falls in the "Bearish -- minimal exposure, tight stops" range.
13. Limitations
Data Quality
- OHLCV data from yfinance covers 2018-01-01 through 2026-03-01 (2,982 data points). This is a robust sample size for technical analysis.
- Volume figures represent estimated spot market volume and may not capture full derivatives market activity, which significantly impacts crypto price action.
- No adjustment for stock splits or dividends (not applicable to crypto).
Methodological Caveats
- Wyckoff phase identification is heuristic, not definitive. The classification relies on slope, R-squared, range ratio, and volume trend -- reasonable proxies, but Wyckoff analysis traditionally incorporates order flow and market microstructure data not available here.
- Support/resistance levels use 5-bar swing pivots over 180 days. Different pivot parameters would yield slightly different levels. The clustering algorithm uses a 3% threshold, which is appropriate for crypto volatility.
- Component scoring uses a rule-based system that maps indicator values to scores. The score ranges and weights are judgment-based, not empirically optimized. A different weighting scheme would produce a different overall score.
- The Fibonacci retracement is computed from the 52-week range, which may not correspond to the most relevant swing high/low for shorter-term traders.
Statistical Reliability
- The 120-day linear regression for Wyckoff phase has R-squared = 0.62, which is solid but means 38% of variance is unexplained. The trend is real but noisy.
- Return distribution statistics (skew, kurtosis) are computed over 252 trading days, a reasonable sample size, but crypto regime shifts can make these non-stationary.
- Momentum oscillators (RSI, MACD, Stochastic) are lagging indicators by construction. They confirm what has happened, not what will happen.
Key Assumptions That Could Break
- Support at $1,748-$1,822 holds. If this zone breaks, the analysis framework shifts entirely and targets reset to 2022 bear market lows ($880-$1,100).
- No external catalysts. A major ETH protocol event, regulatory action, or macro shock could invalidate the technical picture in either direction.
- Crypto market correlation. ETH-USD does not trade in isolation. BTC dominance, overall crypto market cap, and risk-on/risk-off flows in equities all impact ETH price action but are not modeled here.
Analysis generated: 2026-03-01
Script: analysis/quant-research/scripts/ETH-USD-technical-2026-03-01.py
Charts: analysis/quant-research/charts/eth_usd_*.png
Charts