ETH-USD
Conviction 3ETH-USD -- Combined Deep Dive Assessment
Date: 2026-03-01 Asset Class: Crypto Token Ticker: ETH-USD (Ethereum)
Fundamental Summary
Fundamental analysis not applicable for crypto tokens.
Technical Summary
| Metric | Value |
|---|---|
| Overall Score | 4.0/10 |
| Bias | Bearish |
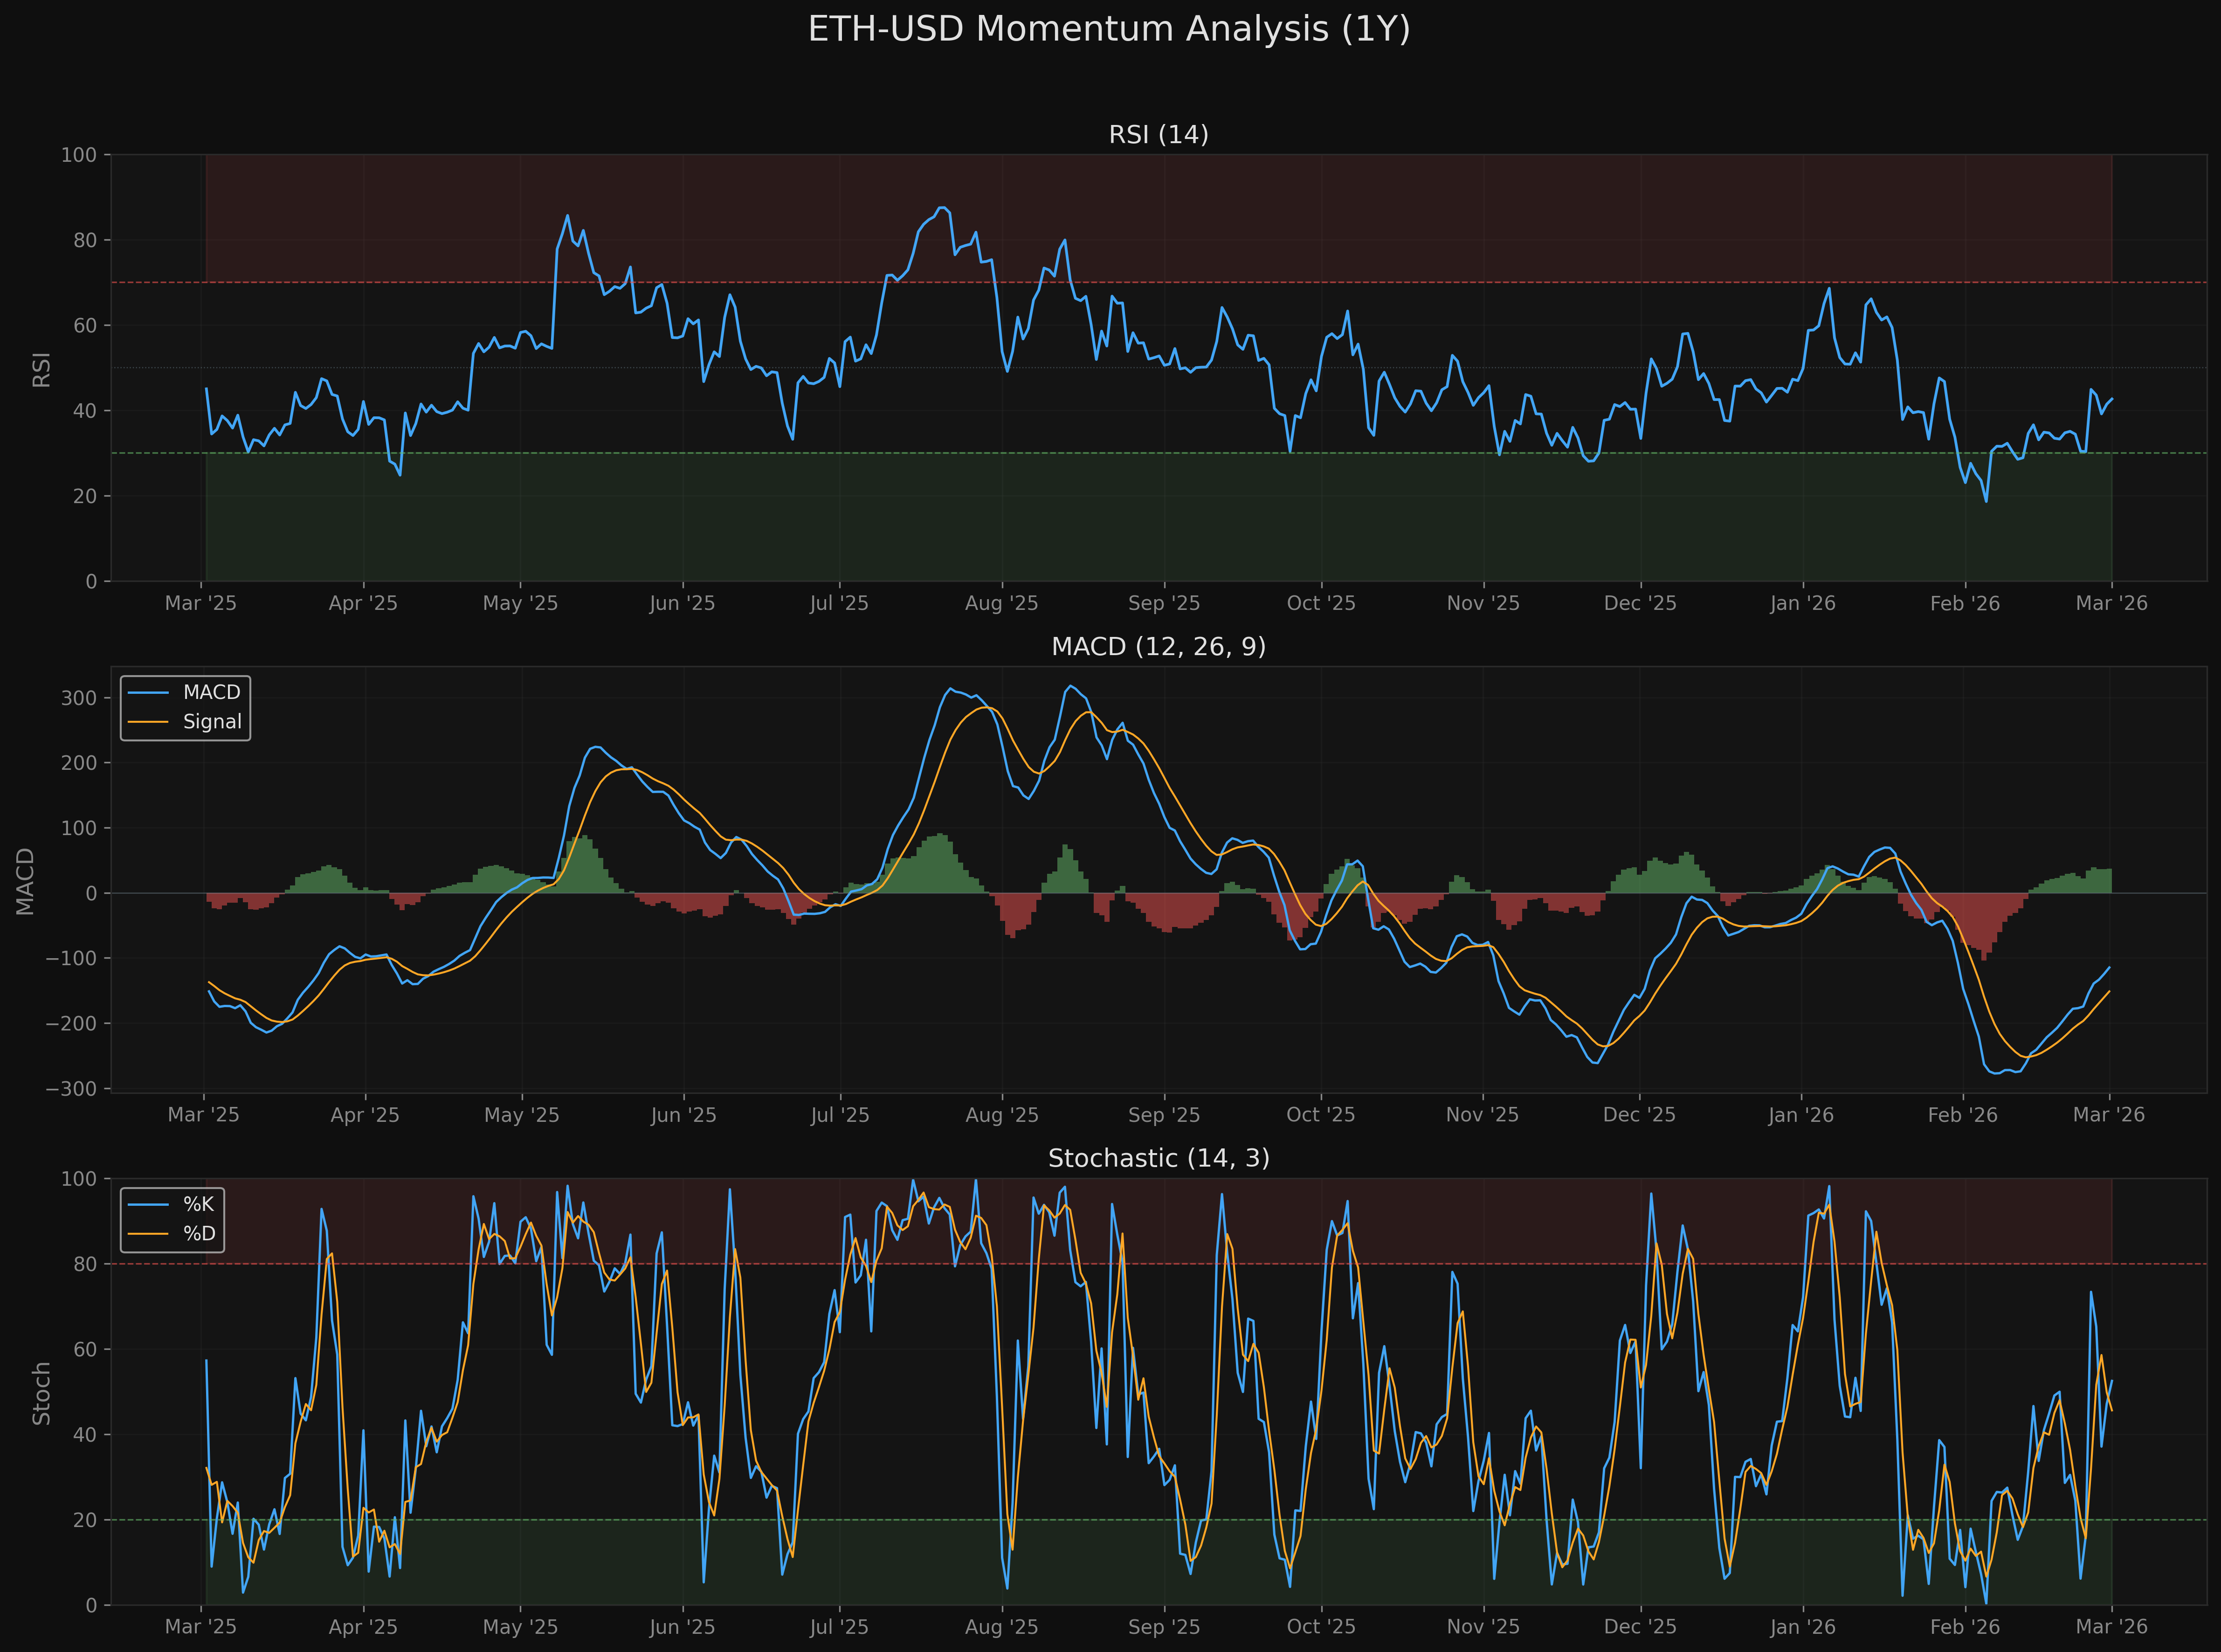
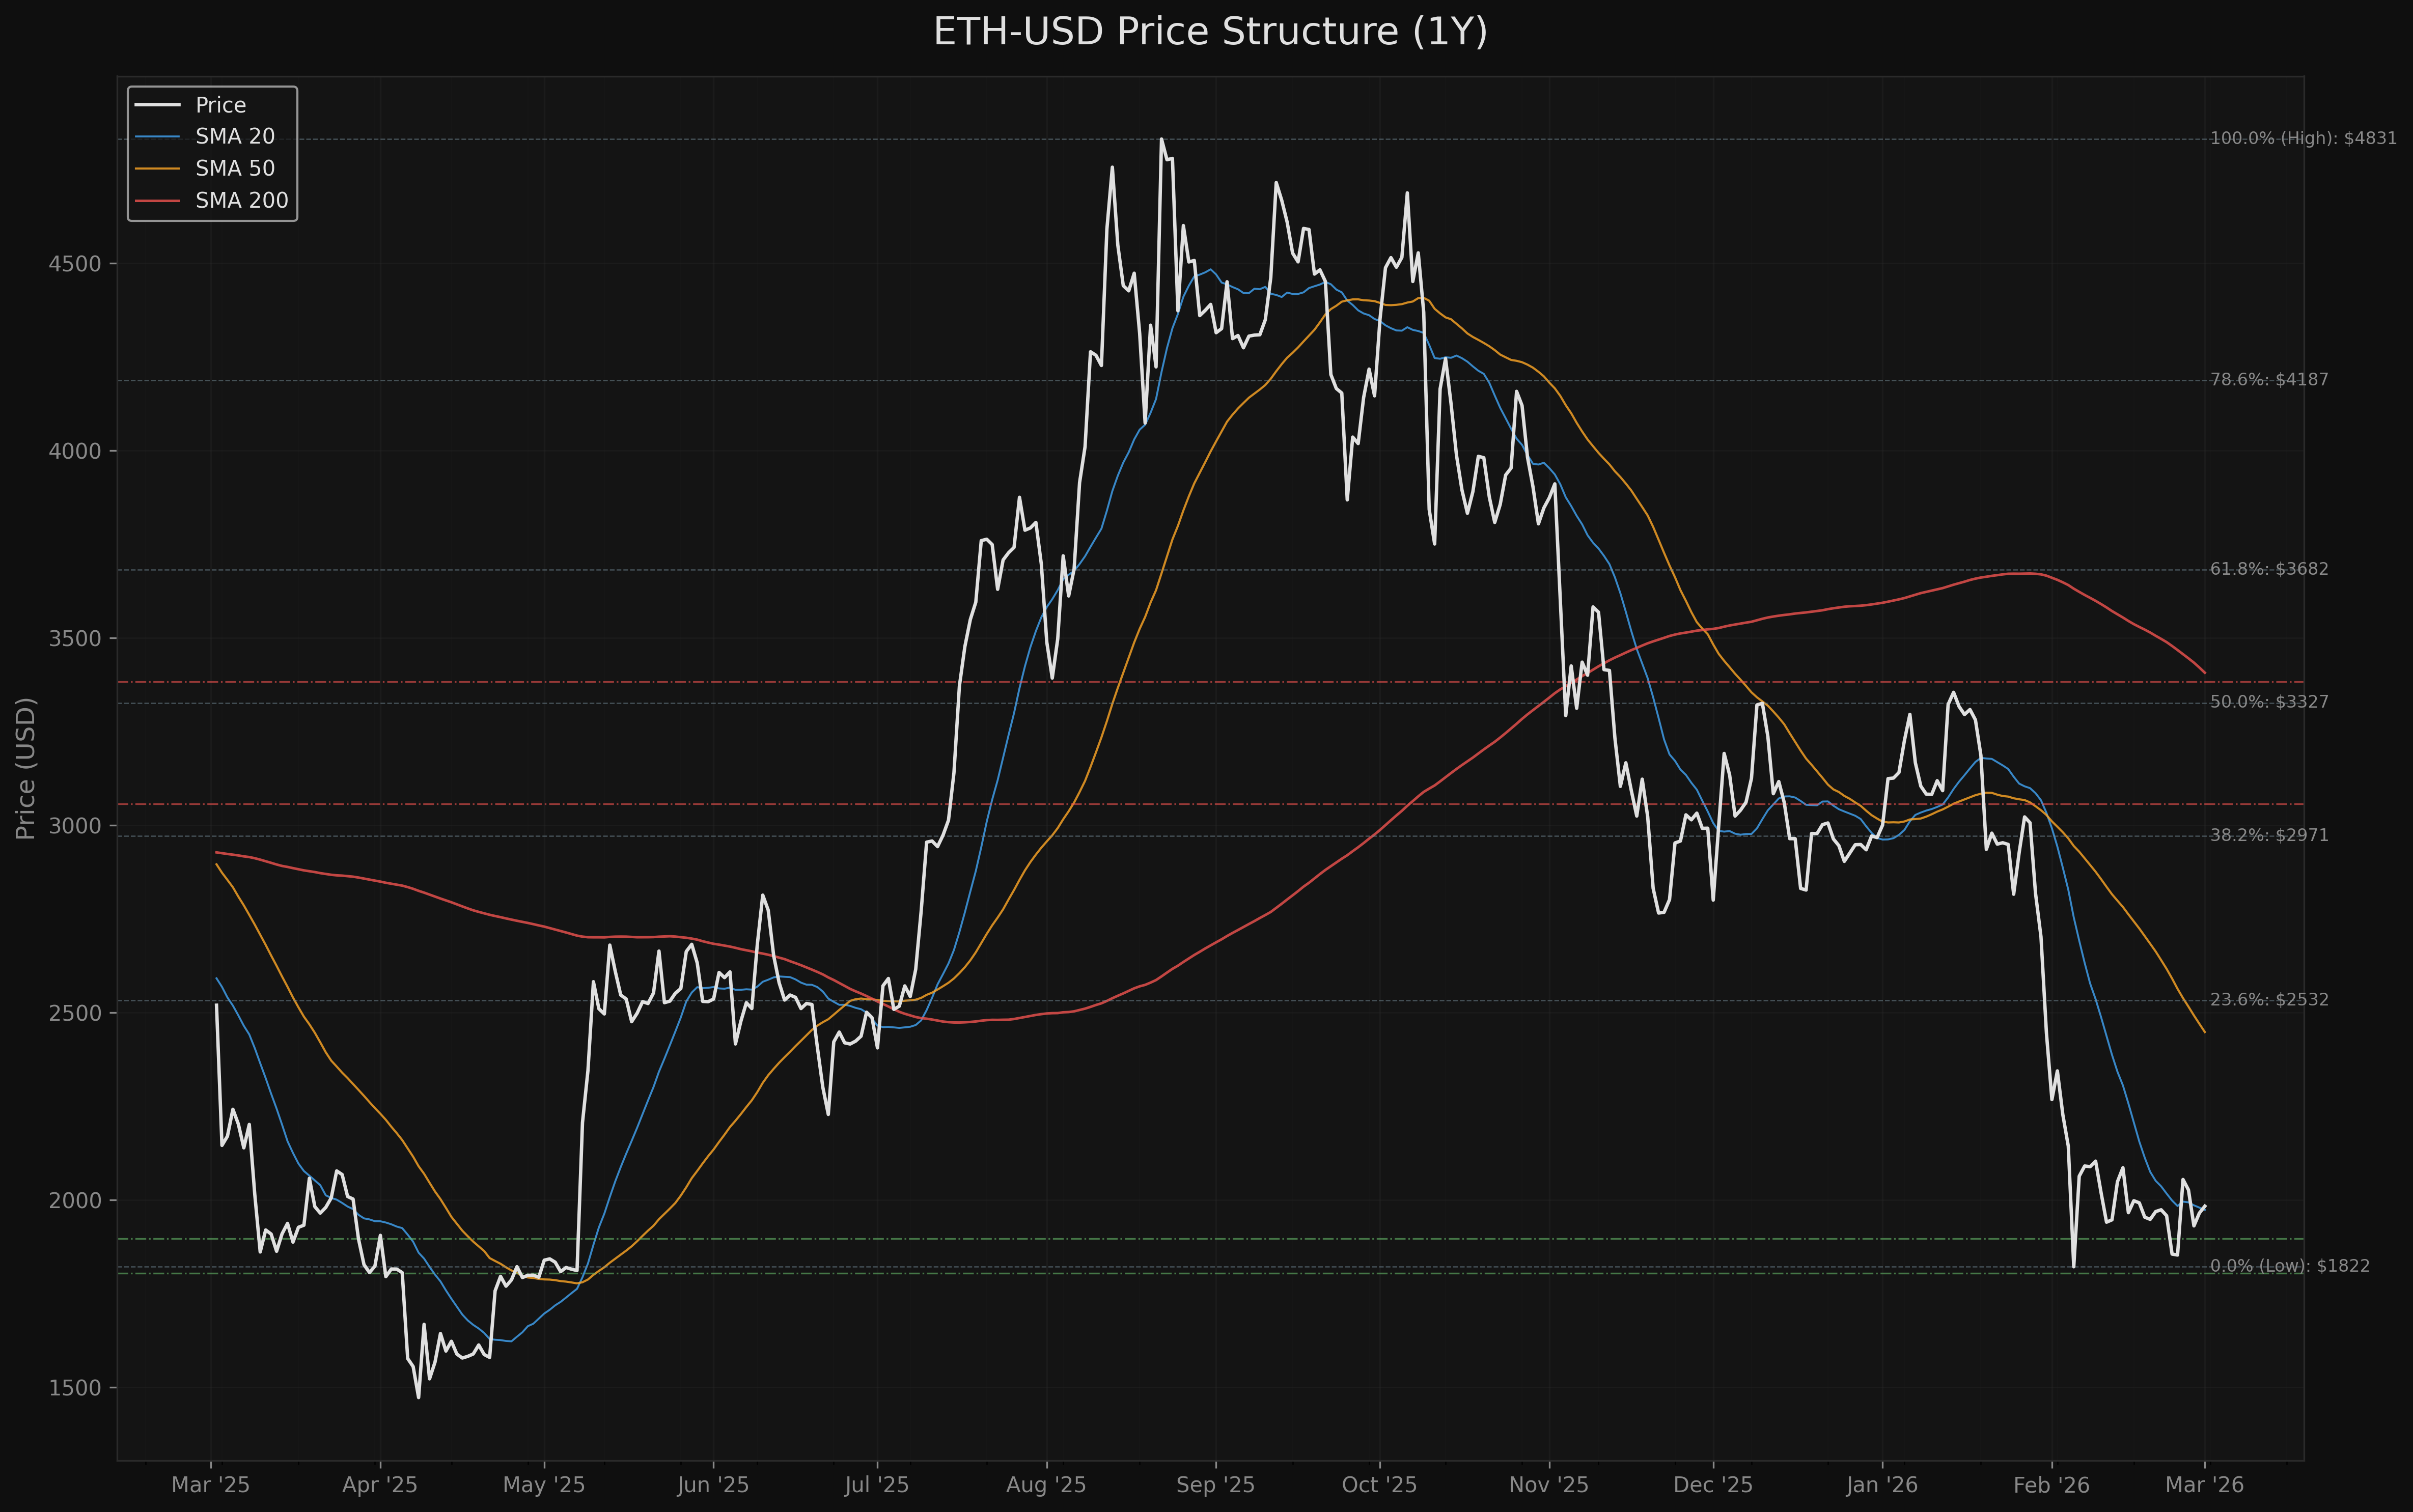
Trend: Death cross (SMA 50 $2,448 below SMA 200 $3,407), deep markdown phase. Momentum: RSI 42.65 (recovering from oversold), MACD histogram turned positive. Key Levels: Support $1,897 / $1,804, Resistance $3,057 / $3,383.
(Full report: analysis/quant-research/ETH-USD-technical-2026-03-01.md)
AGREEMENT Assessment
Multi-Timeframe Agreement: CONFLICTING
Crypto token -- no fundamental analysis. Assessed via Multi-Timeframe Agreement instead.
CONFLICTING across timeframes. The daily chart is firmly bearish: death cross with nearly $1,000 separation between SMA 50 ($2,448) and SMA 200 ($3,407), price at the 5.4th percentile of the 52-week range, Wyckoff Markdown phase confirmed by 120-day linear regression showing -$4,129/year annualized decline (R2 = 0.62).
However, short-term momentum is showing recovery: MACD histogram has turned positive, RSI is climbing from oversold territory (42.65), and price bounced +6.89% over the past 7 days. This is consistent with a bear market relief rally -- a temporary bounce within a prevailing downtrend -- not a trend reversal.
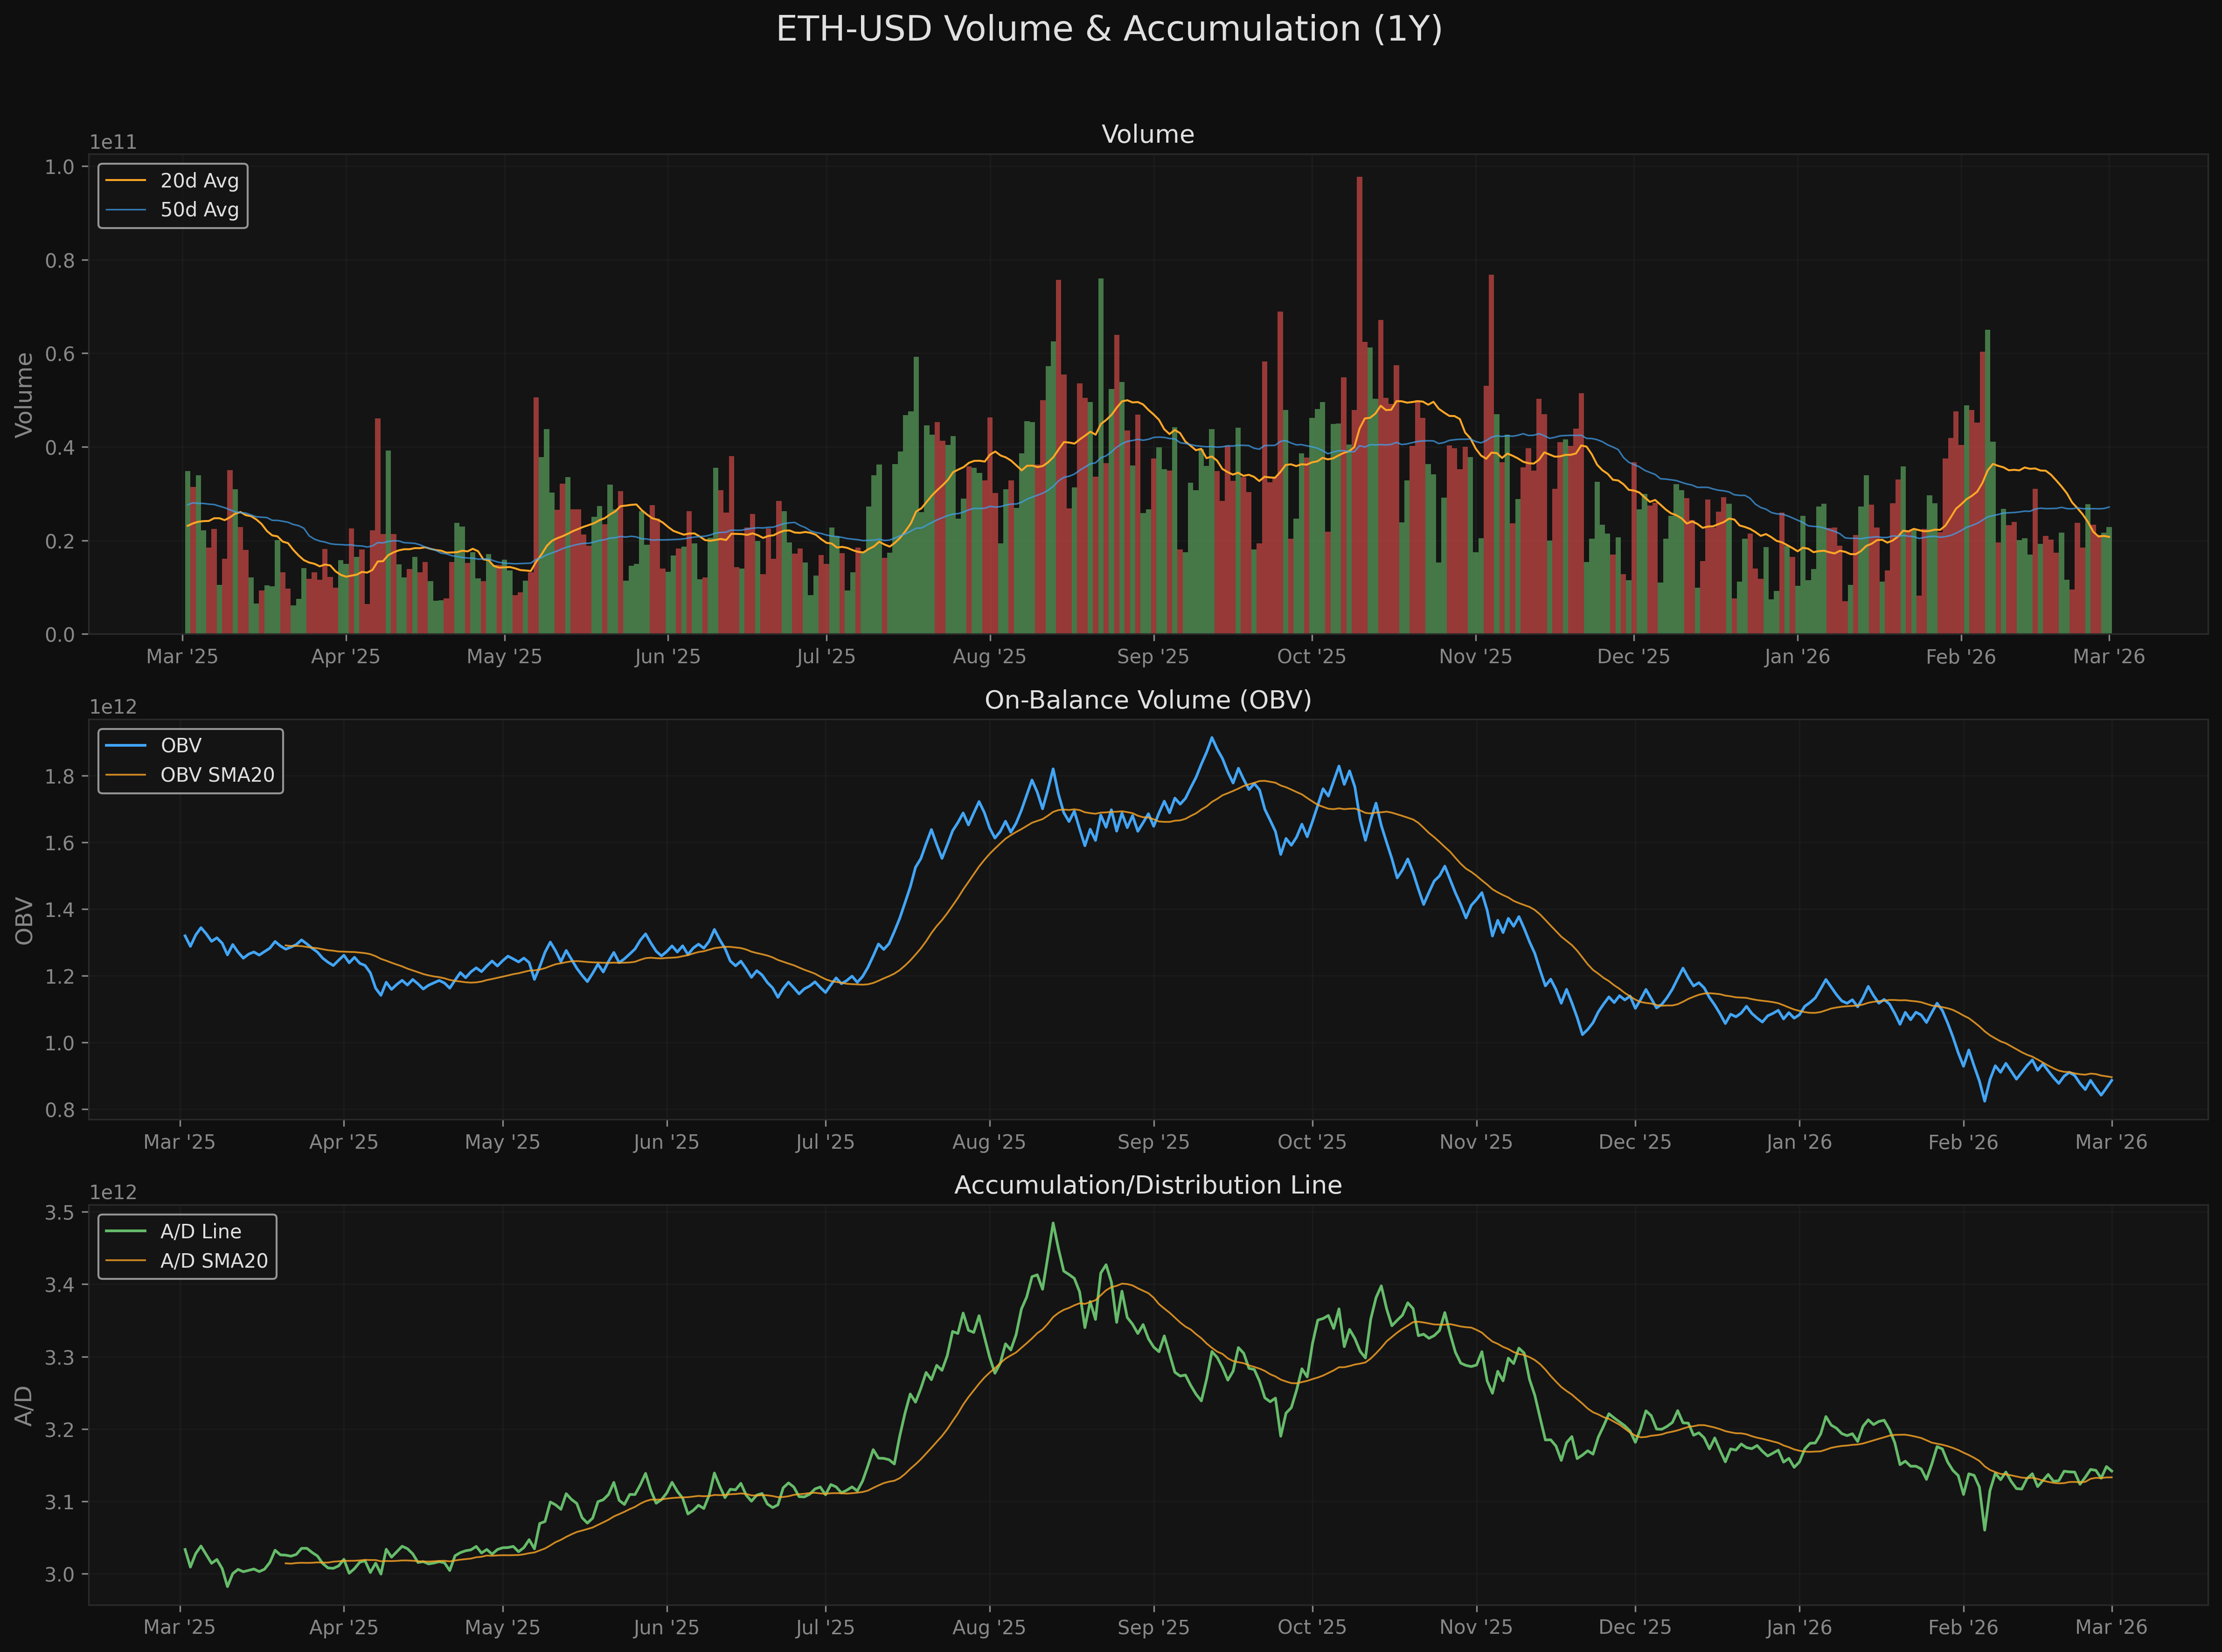
The recovery is NOT confirmed by volume: OBV is declining and the A/D line remains negative. Until volume confirms a reversal, the short-term bounce is suspect.
Market regime alignment: ETH is in a bearish phase consistent with broader crypto market weakness. No macro regime divergence to provide a contrarian signal.
Key Levels
| Level | Price | Source |
|---|---|---|
| Resistance 2 | $3,383 | Secondary resistance cluster |
| Resistance 1 | $3,057 | Nearest swing high cluster / initial resistance |
| Current Price | ~$1,935 | -- |
| Support 1 (Zone 1) | $1,859-$1,935 | Swing low cluster |
| Support 2 (Zone 2) | $1,750-$1,822 | 52-week low area (capitulation zone) |
Risk/Reward Framework
Scenario 1: Zone 1 Entry (Swing Low Cluster)
- Entry: $1,859-$1,935 (test of swing low cluster with volume support)
- Target: $3,057 (nearest swing high cluster / initial resistance)
- Stop: $1,768 (below recent swing low cluster)
- R:R: 6.7:1 (to T1 from Zone 1 midpoint)
- Probability: Low (markdown phase -- trend is against longs)
Scenario 2: Zone 2 Entry (Capitulation Zone)
- Entry: $1,750-$1,822 (retest of 52-week low area)
- Target: $3,057 (nearest swing high cluster)
- Stop: $1,700 (below capitulation zone)
- R:R: 8.5:1 (to T2 at $3,383 from Zone 1 midpoint)
- Probability: Low-Moderate (requires capitulation event, but offers exceptional R:R if support holds)
Conviction Assessment
| Component | Value | Rationale |
|---|---|---|
| Multi-TF Agreement | 0.30 | Conflicting -- daily bearish vs short-term recovery signals |
| Market Regime Alignment | 0.30 | Bearish, aligned with crypto macro weakness |
| Data Quality | 0.90 | Major crypto asset, full coverage across exchanges |
| Risk/Reward Asymmetry | 0.90 | R:R >5:1 from support zone to resistance |
| Red Flag Severity | 0.70 | All disclosed -- death cross, drawdown, markdown phase |
Conviction Score: 3 (Moderate) Weighted Score: 58.0/100 Position Sizing: 50% of target (starter position)
Note: The high conviction weighted score (58.0) is driven by excellent data quality (major asset) and favorable mechanical R:R from depressed levels. This does NOT imply the trade is probable -- the prevailing trend is against longs. The R:R is favorable IF the support zone holds, which is not assured in a markdown phase.
Actionable Framework
Position Type: Avoid (markdown phase -- wait for trend reversal confirmation) Position Size: 0% recommended at current levels. If trading the relief rally, limit to 1-2% max with tight risk management.
Entry Zones: - Zone 1: $1,859-$1,935 | Trigger: test of swing low cluster with volume support - Zone 2: $1,750-$1,822 | Trigger: retest of 52-week low area (capitulation zone)
Stop Loss: $1,768 | Below recent swing low cluster
Targets: - Target 1: $3,057 | Nearest swing high cluster / initial resistance - Target 2: $3,383 | Secondary resistance cluster
Key Monitoring Triggers:
Upgrade thesis if: - SMA 50 turns upward and price reclaims $2,448; OR OBV reverses to positive trend with 3+ days of rising volume; OR BTC establishes a confirmed uptrend (ETH typically follows)
Downgrade thesis if: - Price breaks below $1,750 (52-week low area) on elevated volume; OR MACD histogram turns negative again after failing to sustain recovery
Exit immediately if: - Price falls below $1,768 (stop loss); OR a major crypto-specific risk event (exchange failure, regulatory action, protocol exploit)
Limitations: - Crypto token -- no fundamental valuation anchor. Price is purely sentiment and flow-driven. - Bear market relief rallies are statistically common and often fail. The +6.89% 7-day bounce is within normal bear rally parameters. - Volume data for crypto includes 24/7 trading across multiple exchanges; volume spikes may reflect exchange-specific events rather than broad demand. - ETH-specific risks (staking mechanics, gas fee dynamics, L2 competition) are outside the scope of price-based technical analysis. - The favorable R:R ratios assume support zones hold, which is uncertain in a confirmed markdown/death cross environment.
Charts