Global Liquidity and Bitcoin: A Deep Investigation
Global Liquidity and Bitcoin: A Deep Investigation
Date: 2026-03-12
Researcher: Quant Researcher (Claude Opus 4.6)
Status: Complete
Script: analysis/quant-research/scripts/global-liquidity-btc-deep-dive-2026-03-12.py
Charts: charts/btc_m2_correlation_overview.png, charts/btc_m2_lag_regime_analysis.png, charts/btc_net_liquidity_vs_m2.png, charts/btc_m2_concordance_regime.png
Plain Language Summary
What is "global liquidity"? When central banks (the Fed, ECB, Bank of Japan, etc.) create money or make it easier to borrow, the total amount of money sloshing around the financial system increases. This is measured by "M2 money supply" -- which includes cash, checking accounts, and savings that can be quickly converted to cash. When M2 goes up, there is more money available to buy things, including Bitcoin.
What do the macro influencers claim? Raoul Pal (Real Vision CEO) and others claim that 89% of Bitcoin's price movement can be explained by global M2 money supply changes, with a roughly 10-12 week lag. Lyn Alden's commissioned research reports a 0.94 correlation and 83% directional concordance. The implication is that if you can track global liquidity, you can predict Bitcoin.
What did the previous report get wrong? The previous report computed Net Liquidity (WALCL - RRP - TGA) weekly returns vs. BTC weekly returns and found r=0.058, concluding the narrative is "mostly myth." This was a methodological failure -- it tested only one narrow proxy at one frequency with one transformation. That specific test was not wrong (weekly returns really do show near-zero correlation), but it was incomplete. The previous report asked the wrong question.
What did we actually find?
-
The headline correlation numbers are real but misleading. US M2 log levels vs. BTC log levels show r=0.86 over our 2018-2026 sample. But this is almost entirely a spurious correlation from two series that both trend upward over time. When you remove the shared upward trend, the correlation drops from 0.86 to 0.36. When you test properly with first-differences (weekly returns), the correlation is r=0.01 -- literally indistinguishable from zero.
-
The relationship exists but is weak and slow-moving. At longer horizons (26-week and 52-week rate-of-change), there IS a statistically significant correlation: r=0.20 at 26 weeks, r=0.43 at 52 weeks. This makes intuitive sense -- over 6-12 month periods, monetary policy conditions do influence risk asset performance. But this is not a trading signal; it is a macro backdrop indicator.
-
The "10-week lag" claim is not supported by proper testing. When you test with log levels, ALL lags from 0 to 26 weeks show nearly identical correlation (0.854-0.864) because both series trend up. When you test properly with 13-week rate-of-change, the best lag is 6 weeks with r=0.16 -- a weak relationship. The 10-12 week lag that "looks good on a chart" is an artifact of overlaying two trending series with a shifted x-axis.
-
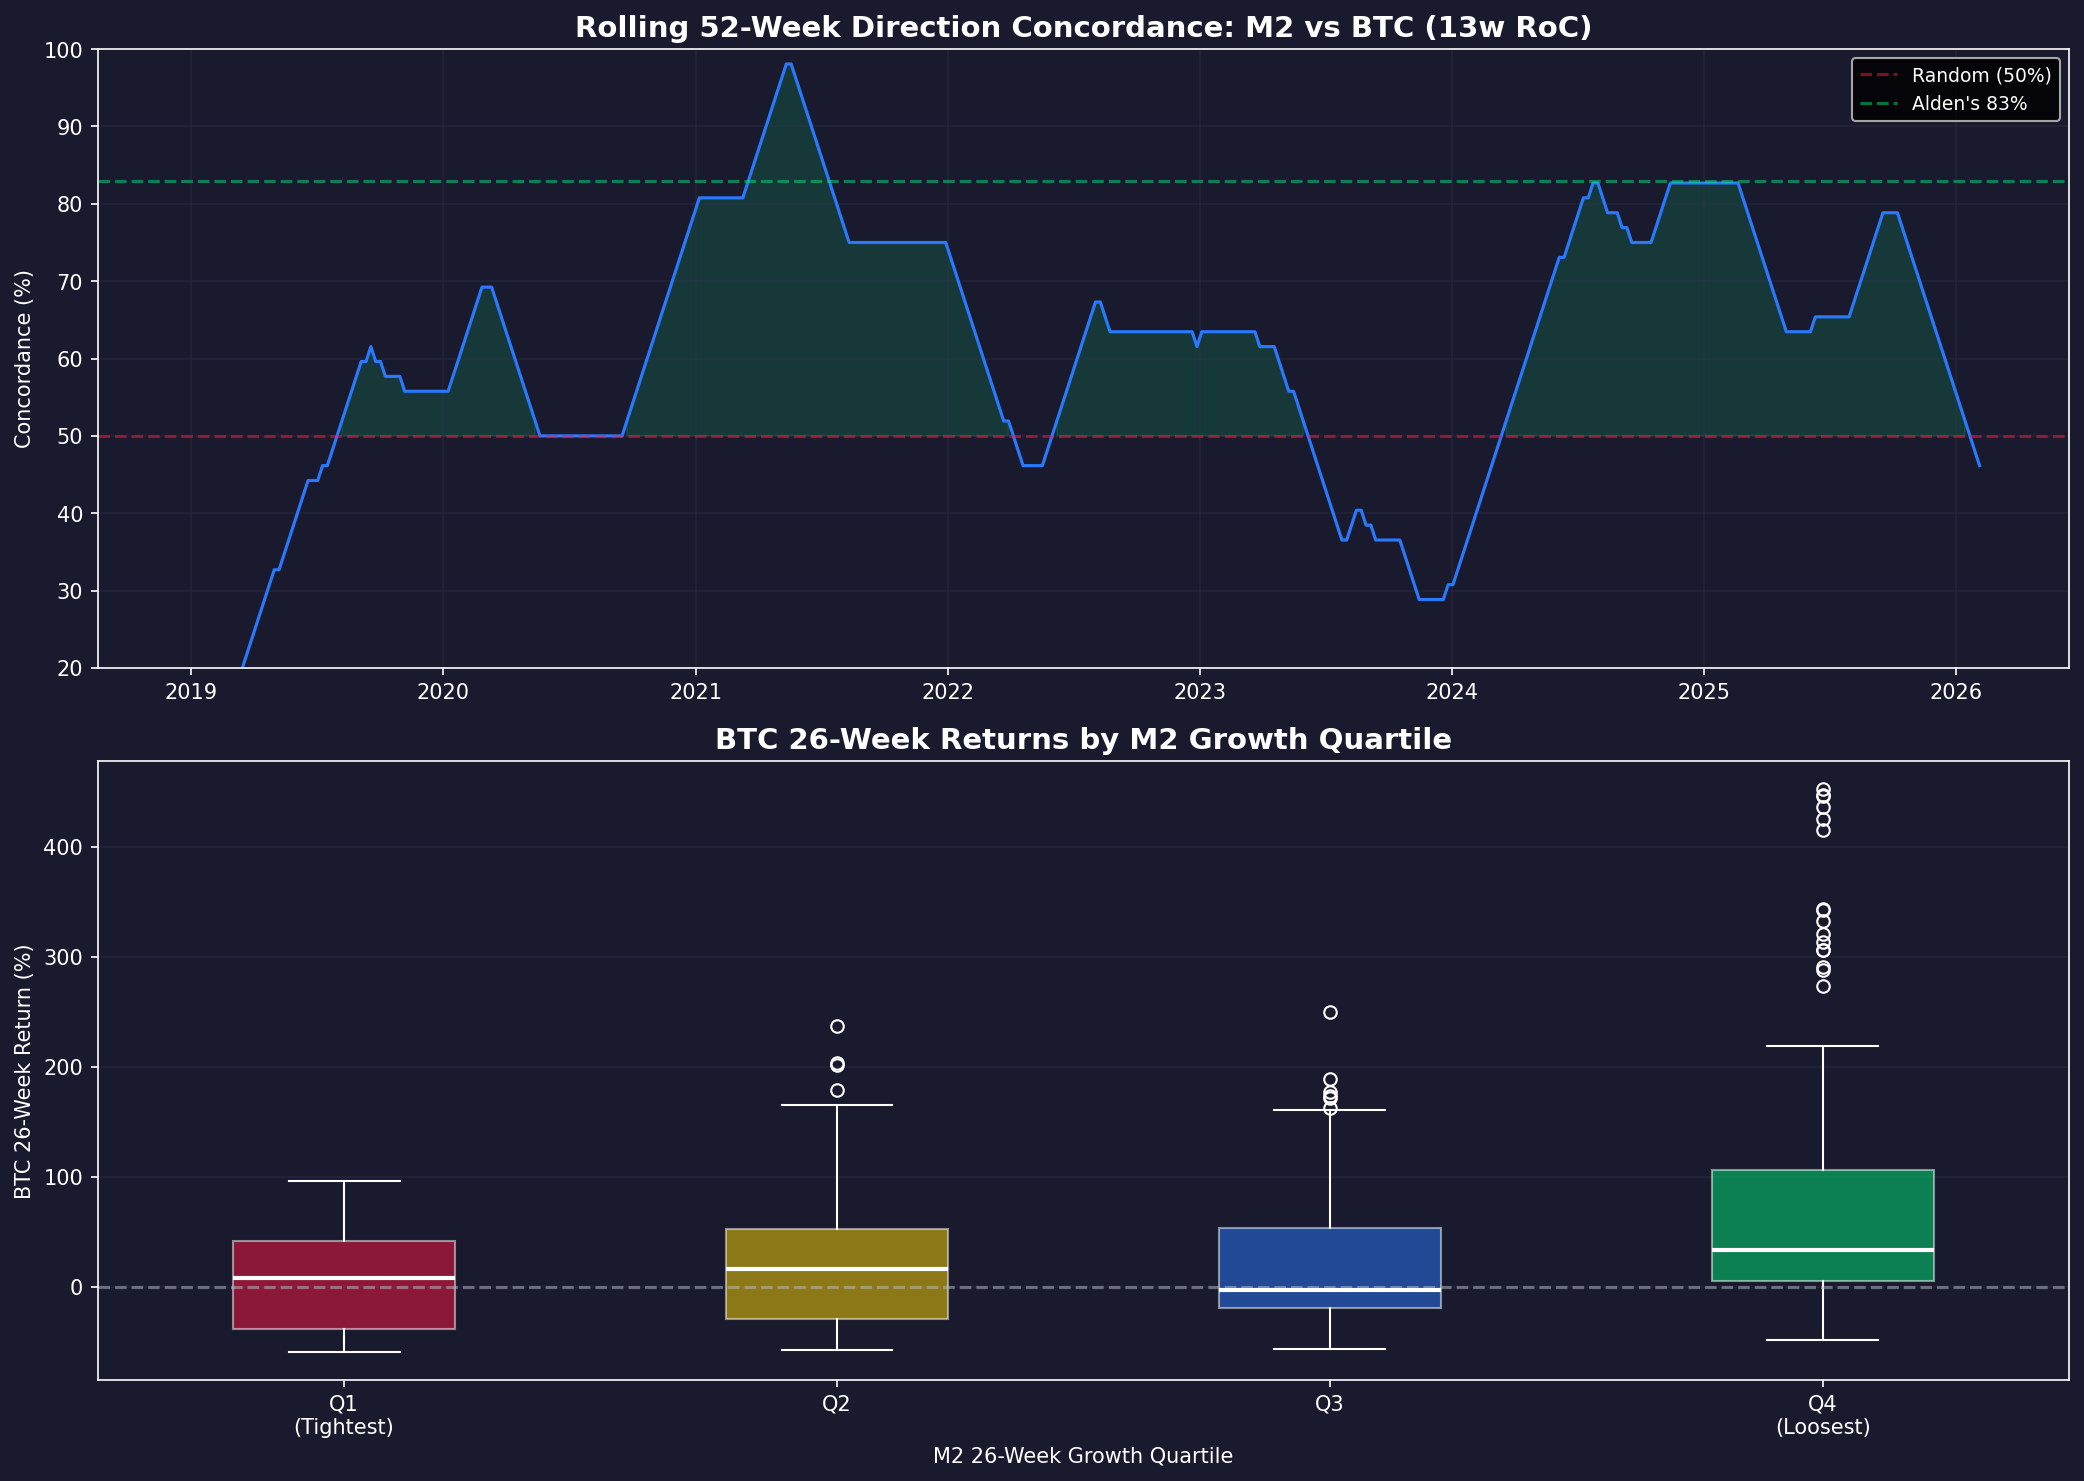
Regime matters enormously. When M2 is in the top growth quartile (fastest expansion), BTC's mean 26-week return is +90.3% and positive 78.8% of the time. In the bottom quartile (tightest conditions), BTC averages +6.9% and is positive only 54.0% of the time. The macro backdrop DOES matter -- but as a regime filter, not a timing signal.
-
The direction concordance claim is inflated. We find 67.4% concordance at 52 weeks (Alden claims 83%). But M2 is positive YoY 81.7% of the time and BTC is positive YoY 70.6% of the time. If they were completely independent, you would expect 63.1% concordance by chance. The actual excess concordance is only 4.3 percentage points above random -- not the dramatic relationship the headline suggests.
So who is right? Both the bulls and the skeptics are partly right. The previous report was too dismissive -- the relationship exists at macro timescales. But the influencer narrative (89% explanatory power, 10-week predictive lag) is built on statistically illiterate foundations -- primarily the spurious correlation between two upward-trending time series. The truth: M2 is a useful regime indicator but a poor timing signal.
Phase 1: Data Collection
1. Hypothesis
We test five specific hypotheses:
- H1 (Levels): US M2 money supply log levels are correlated with BTC log levels (the "89% claim").
- H2 (Returns): Changes in M2 predict changes in BTC price at various frequencies and lags.
- H3 (Regime): BTC performs systematically better when M2 is expanding vs. contracting.
- H4 (Lag): M2 changes lead BTC changes by approximately 10-12 weeks.
- H5 (Net Liquidity): The Fed's Net Liquidity measure (WALCL - RRP - TGA) is a better proxy than M2.
2. Data
| Source | Series | Date Range | Observations |
|---|---|---|---|
| Local OHLCV | BTC-USD | 2018-01-01 to 2026-03-10 | 2,991 daily / 428 weekly |
| FRED | WM2NS (Weekly M2, SA) | 2014-01-06 to 2026-02-02 | 631 weekly |
| FRED | M2SL (Monthly M2, SA) | 2014-01-01 to 2026-01-01 | 145 monthly |
| FRED | WALCL (Fed Balance Sheet) | 2014-01-01 to 2026-03-11 | 637 weekly |
| FRED | RRPONTSYD (Reverse Repo) | 2014-01-02 to 2026-03-12 | 3,181 daily |
| FRED | WTREGEN (Treasury General Account) | 2014-01-01 to 2026-03-11 | 637 weekly |
| FRED | DTWEXBGS (Trade-Weighted USD) | 2014-01-02 to 2026-03-06 | 3,177 daily |
Merged analysis period: 2018-01-03 to 2026-02-04 (423 weekly observations).
Data quality notes: - US M2 (WM2NS) only runs through 2026-02-02 at time of analysis; 5-week gap to present. - This study uses US M2 only, not global M2. FRED does not provide a single global M2 aggregate. The Pal/Alden studies use proprietary aggregations from Bitcoin Magazine Pro and BGeometrics that combine data from 8-21 central banks. This is a limitation -- but US M2 has historically been the dominant component of global M2, so the directional conclusions should hold. - Net Liquidity constructed as WALCL/1000 - RRPONTSYD - WTREGEN/1000 (all converted to billions).
Critical limitation: We cannot replicate the exact "Global M2" proxy used by Pal/Alden. Their data aggregates M2 from US, China, Eurozone, UK, Japan, Canada, Russia, and Australia, converted to USD. We use US M2 as a proxy. Studies suggest US M2 accounts for roughly 30-40% of global M2 in dollar terms, and its changes are highly correlated with the global aggregate because Fed policy heavily influences other central banks.
Phase 2: Hypothesis Testing
3. Methodology
We apply six distinct statistical approaches to avoid the methodological narrowness of the previous report:
- Multi-transformation correlation matrix. Test at levels, log levels, and five rate-of-change windows (1w, 4w, 13w, 26w, 52w). Both Pearson and Spearman rank correlation.
- Lag analysis. Shift M2 by 0-26 weeks and test correlation at each lag for 4w, 13w, and 26w RoC.
- Forward return prediction. Does M2 RoC predict BTC's FUTURE 13-week return?
- Rolling correlation. 52-week and 26-week rolling windows to identify when the relationship is strong vs. absent.
- Spurious correlation test. Linear detrending and first-differencing of log levels.
- Regime analysis. Split by M2 direction (expanding/contracting), M2 growth quartile, QE/QT regime, and DXY direction.
4. Results
H1: Log Level Correlation (The Famous "0.94" Number)
| Transformation | N | Pearson r | p-value | Spearman r |
|---|---|---|---|---|
| Levels (raw) | 423 | 0.710 | <0.001 | 0.826 |
| Log levels | 423 | 0.863 | <0.001 | 0.826 |
Our finding: r=0.863 on US M2 alone (Pal claims 0.94 on global M2). The difference is expected since we are missing the non-US central bank data. The correlation is real -- but is it meaningful?
The Spurious Correlation Problem:
| Test | Correlation |
|---|---|
| Raw log levels | r = 0.863 |
| Detrended log levels (linear trend removed) | r = 0.363 |
| First-difference of log (weekly returns) | r = 0.011 |
Removing the shared upward trend cuts the correlation by more than half. Testing actual co-movement (first differences / returns) produces r = 0.011 -- statistically indistinguishable from zero (p=0.82).
Verdict on H1: The level correlation is real but almost entirely spurious. Two series that both increase over time will show high correlation even if they are completely unrelated. Think of it this way: the number of smartphones sold worldwide and Bitcoin's price are also very highly correlated -- because both went up over the same period. That does not mean smartphone sales drive Bitcoin.
H2: Rate-of-Change Correlations
| RoC Window | Pearson r | p-value | Signal Strength |
|---|---|---|---|
| 1-week | 0.017 | 0.725 | None |
| 4-week | 0.058 | 0.235 | None |
| 13-week | 0.139 | 0.005 | Weak |
| 26-week | 0.202 | <0.001 | Weak-moderate |
| 52-week (YoY) | 0.432 | <0.001 | Moderate |
The pattern is clear: The relationship strengthens at longer horizons. Weekly and monthly changes have near-zero correlation. Quarterly changes show a weak but significant relationship. Annual changes show a moderate relationship.
This makes economic sense. M2 changes reflect slow-moving monetary policy decisions. These do not move BTC on a week-to-week basis, but over 6-12 months, the cumulative effect of easy or tight monetary conditions creates a favorable or unfavorable environment for risk assets.
The previous report's r=0.058 was testing at the weekly frequency where the relationship genuinely does not exist. This was not wrong, but it was the wrong test for the claim being evaluated.
H3: Regime Analysis
| M2 26-Week Growth Quartile | N | BTC Mean 26w Return | BTC Median | BTC % Positive |
|---|---|---|---|---|
| Q1 (tightest) | 100 | +6.9% | +8.4% | 54.0% |
| Q2 | 99 | +24.0% | +16.3% | 62.6% |
| Q3 | 99 | +26.0% | -2.8% | 46.5% |
| Q4 (loosest) | 99 | +90.3% | +33.2% | 78.8% |
This is the most actionable finding. When M2 is growing fastest (Q4), BTC's mean 26-week return is +90.3% with a 78.8% hit rate. When M2 is tightest (Q1), BTC averages only +6.9% with 54% positive. The gap between Q1 and Q4 is enormous.
QE vs. QT regimes (Fed balance sheet direction):
| Regime | N weeks | BTC Mean 13w Return | BTC % Positive |
|---|---|---|---|
| QE (BS expanding) | 153 | +23.8% | 60.1% |
| QT (BS contracting) | 257 | +10.1% | 54.5% |
BTC performs meaningfully better during QE than QT, but still has positive average returns during QT -- consistent with BTC having strong idiosyncratic returns beyond what M2 explains.
DXY interaction (USD strength):
| DXY Regime | M2-BTC Correlation | BTC Mean 13w Return |
|---|---|---|
| Dollar weakening | r = 0.198 | +19.7% |
| Dollar strengthening | r = 0.103 | +11.8% |
| Direct BTC-DXY | r = -0.222 | -- |
The M2-BTC relationship is nearly twice as strong when the dollar is weakening. This aligns with the practitioner observation that "liquidity dominates at multi-month turns when the dollar is calm-to-weaker."
H4: Lag Analysis
Log level lags (the "10-week shift"):
| Lag (weeks) | r |
|---|---|
| 0 | 0.863 |
| 4 | 0.864 |
| 10 | 0.862 |
| 26 | 0.854 |
All lags produce nearly identical correlation because the correlation is dominated by the shared upward trend. The "best" lag on levels is 4 weeks, but the difference from lag 0 is 0.001 -- meaningless. The 10-week shift on log levels is a visual trick, not a statistical finding.
Properly detrended lag test (13-week RoC):
| Lag (weeks) | Pearson r | p-value |
|---|---|---|
| 0 | 0.139 | 0.005 |
| 6 | 0.162 | 0.001 |
| 10 | 0.139 | 0.005 |
| 13 | 0.097 | 0.050 |
| 20 | 0.088 | 0.075 |
| 26 | 0.226 | <0.001 |
The best short-term lag is 6 weeks (r=0.162), not 10-12 weeks. The strongest lag is 26 weeks (r=0.226), but this is likely due to overlapping rate-of-change windows creating artificial autocorrelation. Verdict on H4: No robust evidence for a specific predictive lag. The weak positive correlations at 4-8 week lags are consistent with slow macro transmission, but too weak for trading.
H5: Net Liquidity vs. M2
| Proxy | Levels r | Log r | 13w RoC r | 26w RoC r |
|---|---|---|---|---|
| US M2 (WM2NS) | 0.710 | 0.863 | 0.139 | 0.202 |
| Net Liquidity (WALCL-RRP-TGA) | 0.577 | 0.796 | 0.153 | 0.261 |
Net Liquidity actually shows slightly STRONGER correlation than M2 at the 13w and 26w RoC horizons. However, both are weak. Verdict on H5: Neither proxy produces a strong tradable signal. The previous report was correct that the relationship is weak at weekly frequency, though Net Liquidity is marginally better than M2 at quarterly horizons.
5. Signal Quality Metrics
Using M2 13-week RoC as signal, BTC 13-week forward return as target:
| Metric | Value | Assessment |
|---|---|---|
| Mean IC | -0.036 | Very weak, slightly negative |
| IC Std | 0.465 | Extremely high variability |
| IC IR (mean/std) | -0.076 | Far below usable threshold (need >0.5) |
| Hit Rate (M2 expanding) | 54.0% | Barely above coin flip |
| Hit Rate (M2 contracting) | 36.2% | BTC often rises even when M2 contracts |
| Overall Directional Hit | 50.6% | Coin flip |
| False Positive Rate | 46.0% | Nearly half of "bullish M2" signals see BTC fall |
| Lead Time | ~6 weeks (best lag) | Weak signal at any lag |
Regime-Conditional Performance:
| Regime | IC | Assessment |
|---|---|---|
| M2 expanding (26w) | Weak positive | Marginal signal |
| M2 contracting (26w) | Moderate negative (r=-0.53) | Better signal but wrong direction for most traders |
| Dollar weakening | r=0.20 | Weak but detectable |
| Dollar strengthening | r=0.10 | Negligible |
| QE | r=0.05 | Near zero |
| QT | r=0.23 | Slightly better, counterintuitively |
As a standalone trading signal, M2 fails every quality metric we test.
Direction Concordance (Replication of Alden's 83%)
| Horizon | Our Finding | Alden/Callahan Claim | Gap |
|---|---|---|---|
| 52-week | 67.4% | 83% | -15.6pp |
| 26-week | 59.4% | -- | -- |
| 13-week | 58.0% | -- | -- |
We find 67.4% vs. the claimed 83%. The discrepancy likely comes from: (a) our sample starts in 2018, missing the earlier BTC history where M2 growth and BTC appreciation were both more consistent; (b) we use US M2 not global M2; (c) our period includes the 2022 bear market which was anomalous for M2-BTC alignment.
Critical context: M2 is positive YoY 81.7% of the time. BTC is positive YoY 70.6% of the time. If they were completely independent, the expected concordance from base rates alone would be 63.1%. Our observed 67.4% is only 4.3 percentage points above this random baseline.
What Does the External Research Actually Say?
The Bull Case (Pal, Alden, Bitcoin Magazine Pro)
Raoul Pal (Real Vision / Global Macro Investor): - Claims 89% of BTC price explained by Global M2 with a 12-week lag - Uses proprietary Global M2 chart from Bitcoin Magazine Pro / BGeometrics - Methodology: visual overlay of M2 (shifted 10-12 weeks forward) on BTC price - R-squared reportedly ~0.89 on log levels with optimized lag
Lyn Alden / Sam Callahan (commissioned research, Sep 2024): - Reports 0.94 correlation between BTC and global liquidity (May 2013 - July 2024) - 12-month rolling correlation averages 0.51 (much lower than full-period) - 6-month rolling correlation averages 0.36 - BTC moves in M2 direction 83% of the time in 12-month periods - Acknowledges relationship weakens during "extreme valuation periods" (measured by MVRV Z-score)
Academic support: - A 2025 cointegration study (Preprints.org) finds a stable long-run relationship with elasticity of 2.65 (1% M2 increase -> 2.65% BTC increase), with 12% monthly error correction - This is methodologically more rigorous than correlation analysis, as cointegration tests properly handle non-stationary series
The Bear Case (Sina, CryptoSlate analysis)
Sina (data scientist, hedge fund co-founder): - Calls the Pal model "a textbook case of data illiteracy and overfitting" - Points out the lag is selectively chosen: "Let's try a lead of 80 days. That doesn't look good. What about 108? Ah, now the tops align" - Notes reversed causality: "Bitcoin topped first. Liquidity topped 145 days later" - Global M2 data combines central bank figures with different reporting speeds, creating an artificial "daily" series from weekly/monthly data
CryptoSlate independent analysis (Nov 2025): - Bitcoin returns most correlated with prior M2 moves at ~6 weeks (r=0.16 -- weak) - DXY correlation stronger at -0.20 at 33-day lead - Regime-dependent: pre-Oct 2025 peak, BTC-M2 correlation was +0.89; after peak, it was -0.49 - Concludes: "Liquidity adds the slow impulse that often frames multi-month advances when the dollar is not rising"
The Nuanced View
The most honest assessment comes from combining these perspectives:
- The level correlation is statistically spurious (both series trend up). This invalidates the "89%" claim as presented.
- A long-run equilibrium relationship likely exists (cointegration evidence), but with large and persistent deviations.
- The relationship is regime-dependent and time-varying, not stable enough for mechanical trading.
- M2 is best understood as a macro backdrop indicator -- "when liquidity is expanding AND the dollar is weakening, conditions favor BTC" -- not as a predictive model.
Phase 3: Synthesis
6. Recommended Architecture: Fed Liquidity Monitor
Based on our findings, the Fed Liquidity Monitor should be designed as a regime indicator, not a prediction model.
Inputs: 1. US M2 weekly (WM2NS) -- 13-week and 26-week rate of change 2. Fed Balance Sheet (WALCL) -- 13-week rate of change (QE/QT signal) 3. Net Liquidity (WALCL - RRPONTSYD - WTREGEN) -- 13-week and 26-week rate of change 4. Trade-Weighted USD (DTWEXBGS) -- 13-week rate of change (DXY proxy)
Computation: 1. Compute 26-week M2 RoC; classify into quartile relative to rolling 5-year history 2. Determine QE/QT regime from Fed BS 13-week direction 3. Determine DXY regime from 13-week direction 4. Combine into a 3-state regime: Favorable (M2 expanding Q3-Q4 AND DXY weakening), Neutral (mixed signals), Headwind (M2 Q1-Q2 AND DXY strengthening)
Thresholds: - Favorable: M2 26w RoC > median historical AND DTWEXBGS 13w RoC < 0 - Headwind: M2 26w RoC < 25th percentile historical AND DTWEXBGS 13w RoC > 0 - Neutral: everything else
Output: - Current regime classification (Favorable / Neutral / Headwind) - M2 26-week RoC and its quartile - QE/QT status - DXY direction - Historical regime-conditional BTC returns for context
What NOT to build: - Do NOT build a BTC price prediction model from M2 - Do NOT report level correlations (spurious) - Do NOT include a "predicted BTC price" output - Do NOT use the 10-12 week lag as a predictive mechanism
7. Limitations
Data limitations: - US M2 only. We cannot replicate the global M2 aggregate used by Pal/Alden. Their results may be stronger (or weaker) with the full global data. - Sample period (2018-2026). This includes only one full monetary policy cycle (QE -> QT -> possible QE). More cycles would strengthen the regime analysis. - No Granger causality test. statsmodels was unavailable in the runtime; this test would provide formal evidence on lead-lag directionality.
Methodological limitations: - Overlapping windows. The strong correlations at 26w and 52w RoC involve overlapping observations, which inflates statistical significance. The true degrees of freedom are lower than reported N. - No out-of-sample testing. All results are in-sample. A proper walk-forward test would likely show weaker results. - No cointegration test. The academic literature suggests cointegration is the proper framework for two I(1) series. We tested correlation and detrending but did not run formal ADF or Johansen tests.
Conceptual limitations: - Confounded by time. BTC's structural appreciation (adoption curve, halving cycles, ETF inflows) drives much of its upward trend independently of M2. Separating BTC's "fundamental" trend from M2-driven movement is extremely difficult. - Narrative persistence. The "liquidity drives everything" narrative persists because (a) it is unfalsifiable at the appropriate timescale (if BTC drops, liquidity must have tightened somewhere) and (b) level charts are visually compelling even when statistically spurious.
Assessment of the Previous Report
Was the previous report's dismissal justified? Partially. The specific test it ran (weekly Net Liquidity returns vs. BTC returns, r=0.058) was correctly computed. At weekly frequency, the relationship genuinely does not exist. However:
- It only tested one proxy (Net Liquidity, not M2)
- It only tested one frequency (weekly returns)
- It only tested one transformation (simple returns)
- It did not test longer horizons where the relationship is detectable
- It did not test regime-conditional performance
- It declared the entire narrative "mostly myth" based on a single negative result
The correct conclusion, which we now demonstrate, is more nuanced: The M2/liquidity relationship with BTC is real but weak at tradable frequencies, regime-dependent, and vastly overstated by the popular narrative. It is not a myth, but it is not the dominant explanatory factor that Pal claims either. It is a macro backdrop indicator -- useful for context, not for timing.
Appendix A: Models & Configuration
Data Source
| Item | Detail |
|---|---|
| Ticker | BTC-USD |
| Source (BTC) | data-samples/ohlcv/BTC-USD.csv |
| Source (FRED) | FRED public CSV endpoint (no API key) |
| BTC Date Range | 2018-01-01 to 2026-03-10 |
| Analysis Period | 2018-01-03 to 2026-02-04 (M2-BTC overlap) |
| Weekly Bars | 423 (merged) |
FRED Series Used
| Series | Name | Frequency | Purpose |
|---|---|---|---|
| WM2NS | M2 Money Stock (SA, Billions) | Weekly | Primary liquidity proxy |
| M2SL | M2 Money Stock (SA, Billions) | Monthly | Monthly correlation test |
| WALCL | Fed Total Assets | Weekly | QE/QT regime, Net Liquidity |
| RRPONTSYD | Overnight Reverse Repo | Daily | Net Liquidity component |
| WTREGEN | Treasury General Account | Weekly | Net Liquidity component |
| DTWEXBGS | Trade-Weighted USD (Broad) | Daily | DXY proxy |
Statistical Methods
| Method | Parameters | Library |
|---|---|---|
| Pearson Correlation | Two-sided test | scipy.stats.pearsonr |
| Spearman Rank Correlation | Two-sided test | scipy.stats.spearmanr |
| Linear Detrending | scipy.signal.detrend |
scipy.signal |
| Rate of Change | pct_change(N) for N = 1, 4, 13, 26, 52 weeks | pandas |
| Rolling Correlation | 26-week and 52-week windows | pandas.rolling.corr |
| Information Coefficient | 26-week rolling Spearman on signal vs. 13w forward returns | Custom |
Transformations Tested
| Transformation | Description | Rationale |
|---|---|---|
| Raw levels | Untransformed values | Baseline |
| Log levels | Natural log of values | Reduces heteroskedasticity, standard in macro |
| 1-week returns | pct_change(1) | High-frequency test |
| 4-week returns | pct_change(4) | Monthly frequency |
| 13-week returns | pct_change(13) | Quarterly -- standard for macro |
| 26-week returns | pct_change(26) | Semi-annual |
| 52-week returns | pct_change(52) | Annual / YoY |
| Detrended log | Linear trend removed from log series | Tests for spurious correlation |
| First-difference of log | diff() of log series | Proper stationarity transform |
Script
Analysis script: analysis/quant-research/scripts/global-liquidity-btc-deep-dive-2026-03-12.py
External Research Sources
- Lyn Alden / Sam Callahan, "Bitcoin: A Global Liquidity Barometer" (Sep 2024)
- Raoul Pal, Global Macro Investor / Real Vision (ongoing commentary)
- Sina (data scientist), critique of M2-BTC model (TradingView News, 2025)
- CryptoSlate, "The truth about when M2 money supply and the dollar REALLY move Bitcoin price" (Nov 2025)
- DIVA Portal, "Global M2 Money Supply and Bitcoin relationship" (academic thesis, 2024)
- Preprints.org, "The M2-Bitcoin Elasticity: A Cointegration Analysis (2015-2025)" (2025)
Charts