Credit Stress Strategies Research: Trading the AI-Driven Deleveraging
Credit Stress Strategies Research: Trading the AI-Driven Deleveraging
Date: 2026-03-08
Researcher: Quant Researcher (Claude)
Status: Complete
Script: analysis/quant-research/scripts/credit-stress-research-2026-03-08.py
Charts: analysis/quant-research/charts/credit_stress_*.png
Source: Jordi (22V Research) weekly video transcript
Executive Summary
This report evaluates four trading frameworks derived from Jordi's AI-driven credit deleveraging thesis: (1) sector rotation long commodities / short software, (2) VIX trending regime trading, (3) momentum crash positioning, and (4) Bitcoin as a deleveraging hedge. It also analyzes historical parallels and constructs a composite capitulation signal for identifying market bottoms.
Key findings:
- The Long Commodities / Short Software pair generated +51.4% during the 2022 rate shock but -20.3% during COVID — it works in slow-burn credit events, not liquidity panics.
- VIX trending regimes (23.7% of the time in our sample) are associated with -8.0% annualized SPY returns vs. +21.7% in normal regimes — a massive regime differential.
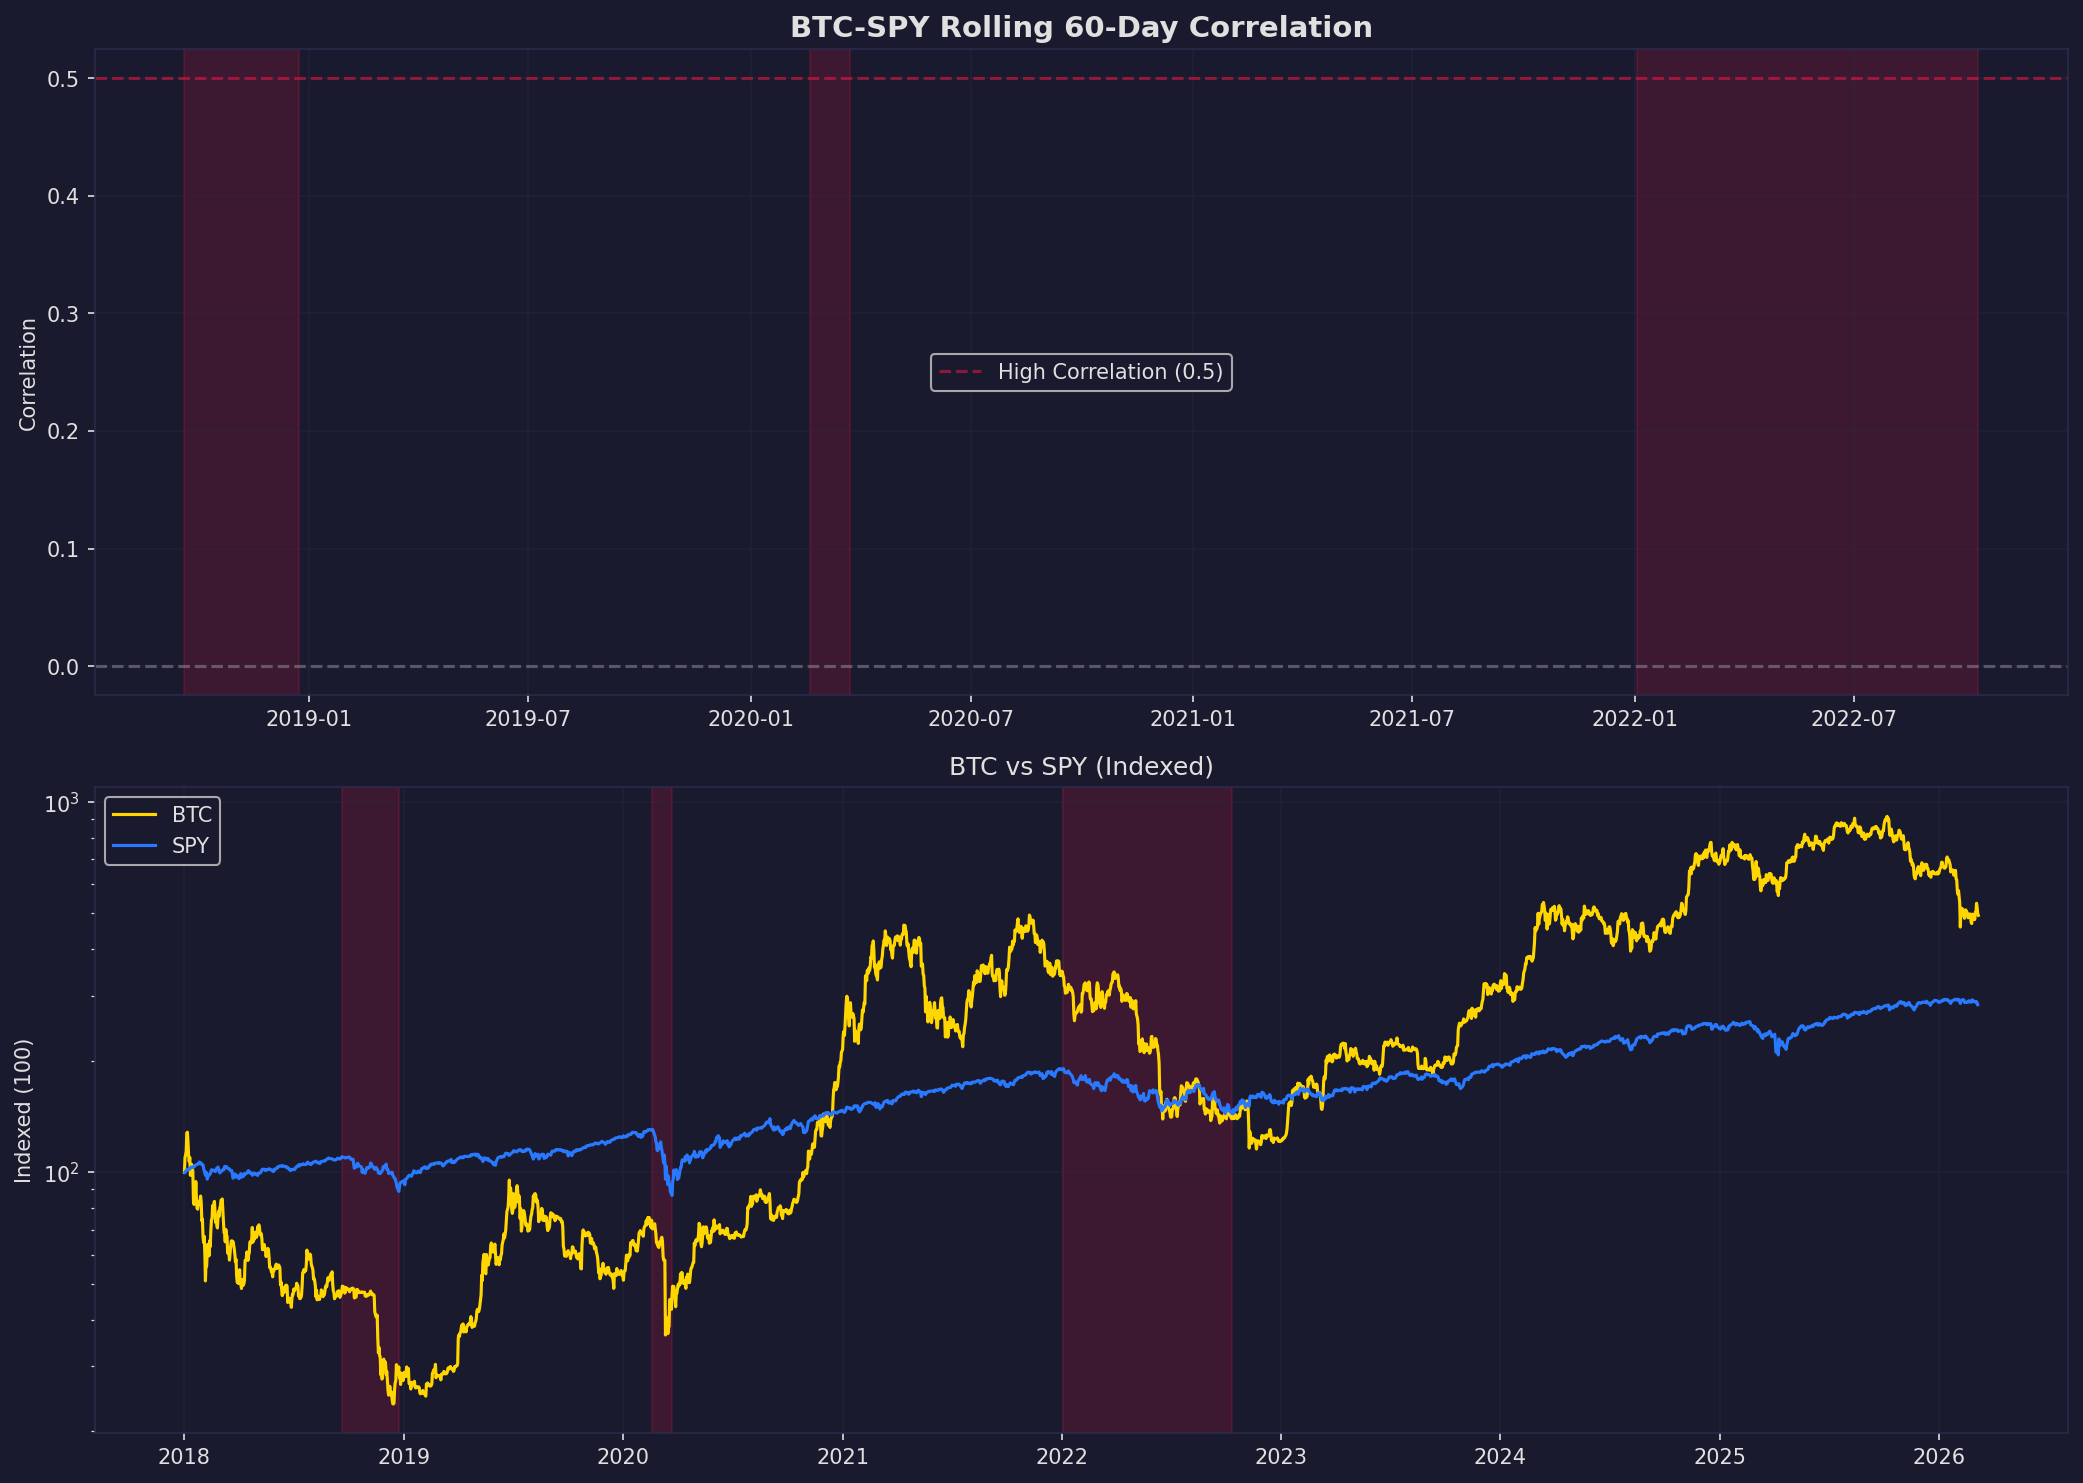
- Bitcoin is not a deleveraging hedge. BTC dropped 37-59% during all three credit stress periods in our data and correlates at 0.53-0.56 with SPY during stress.
- A 4-component composite capitulation signal (VIX extreme + HYG stress + breadth collapse + XLF below 200 DMA) scores 4/4 only 1.3% of the time, with 81% positive forward 1-month returns when it does.
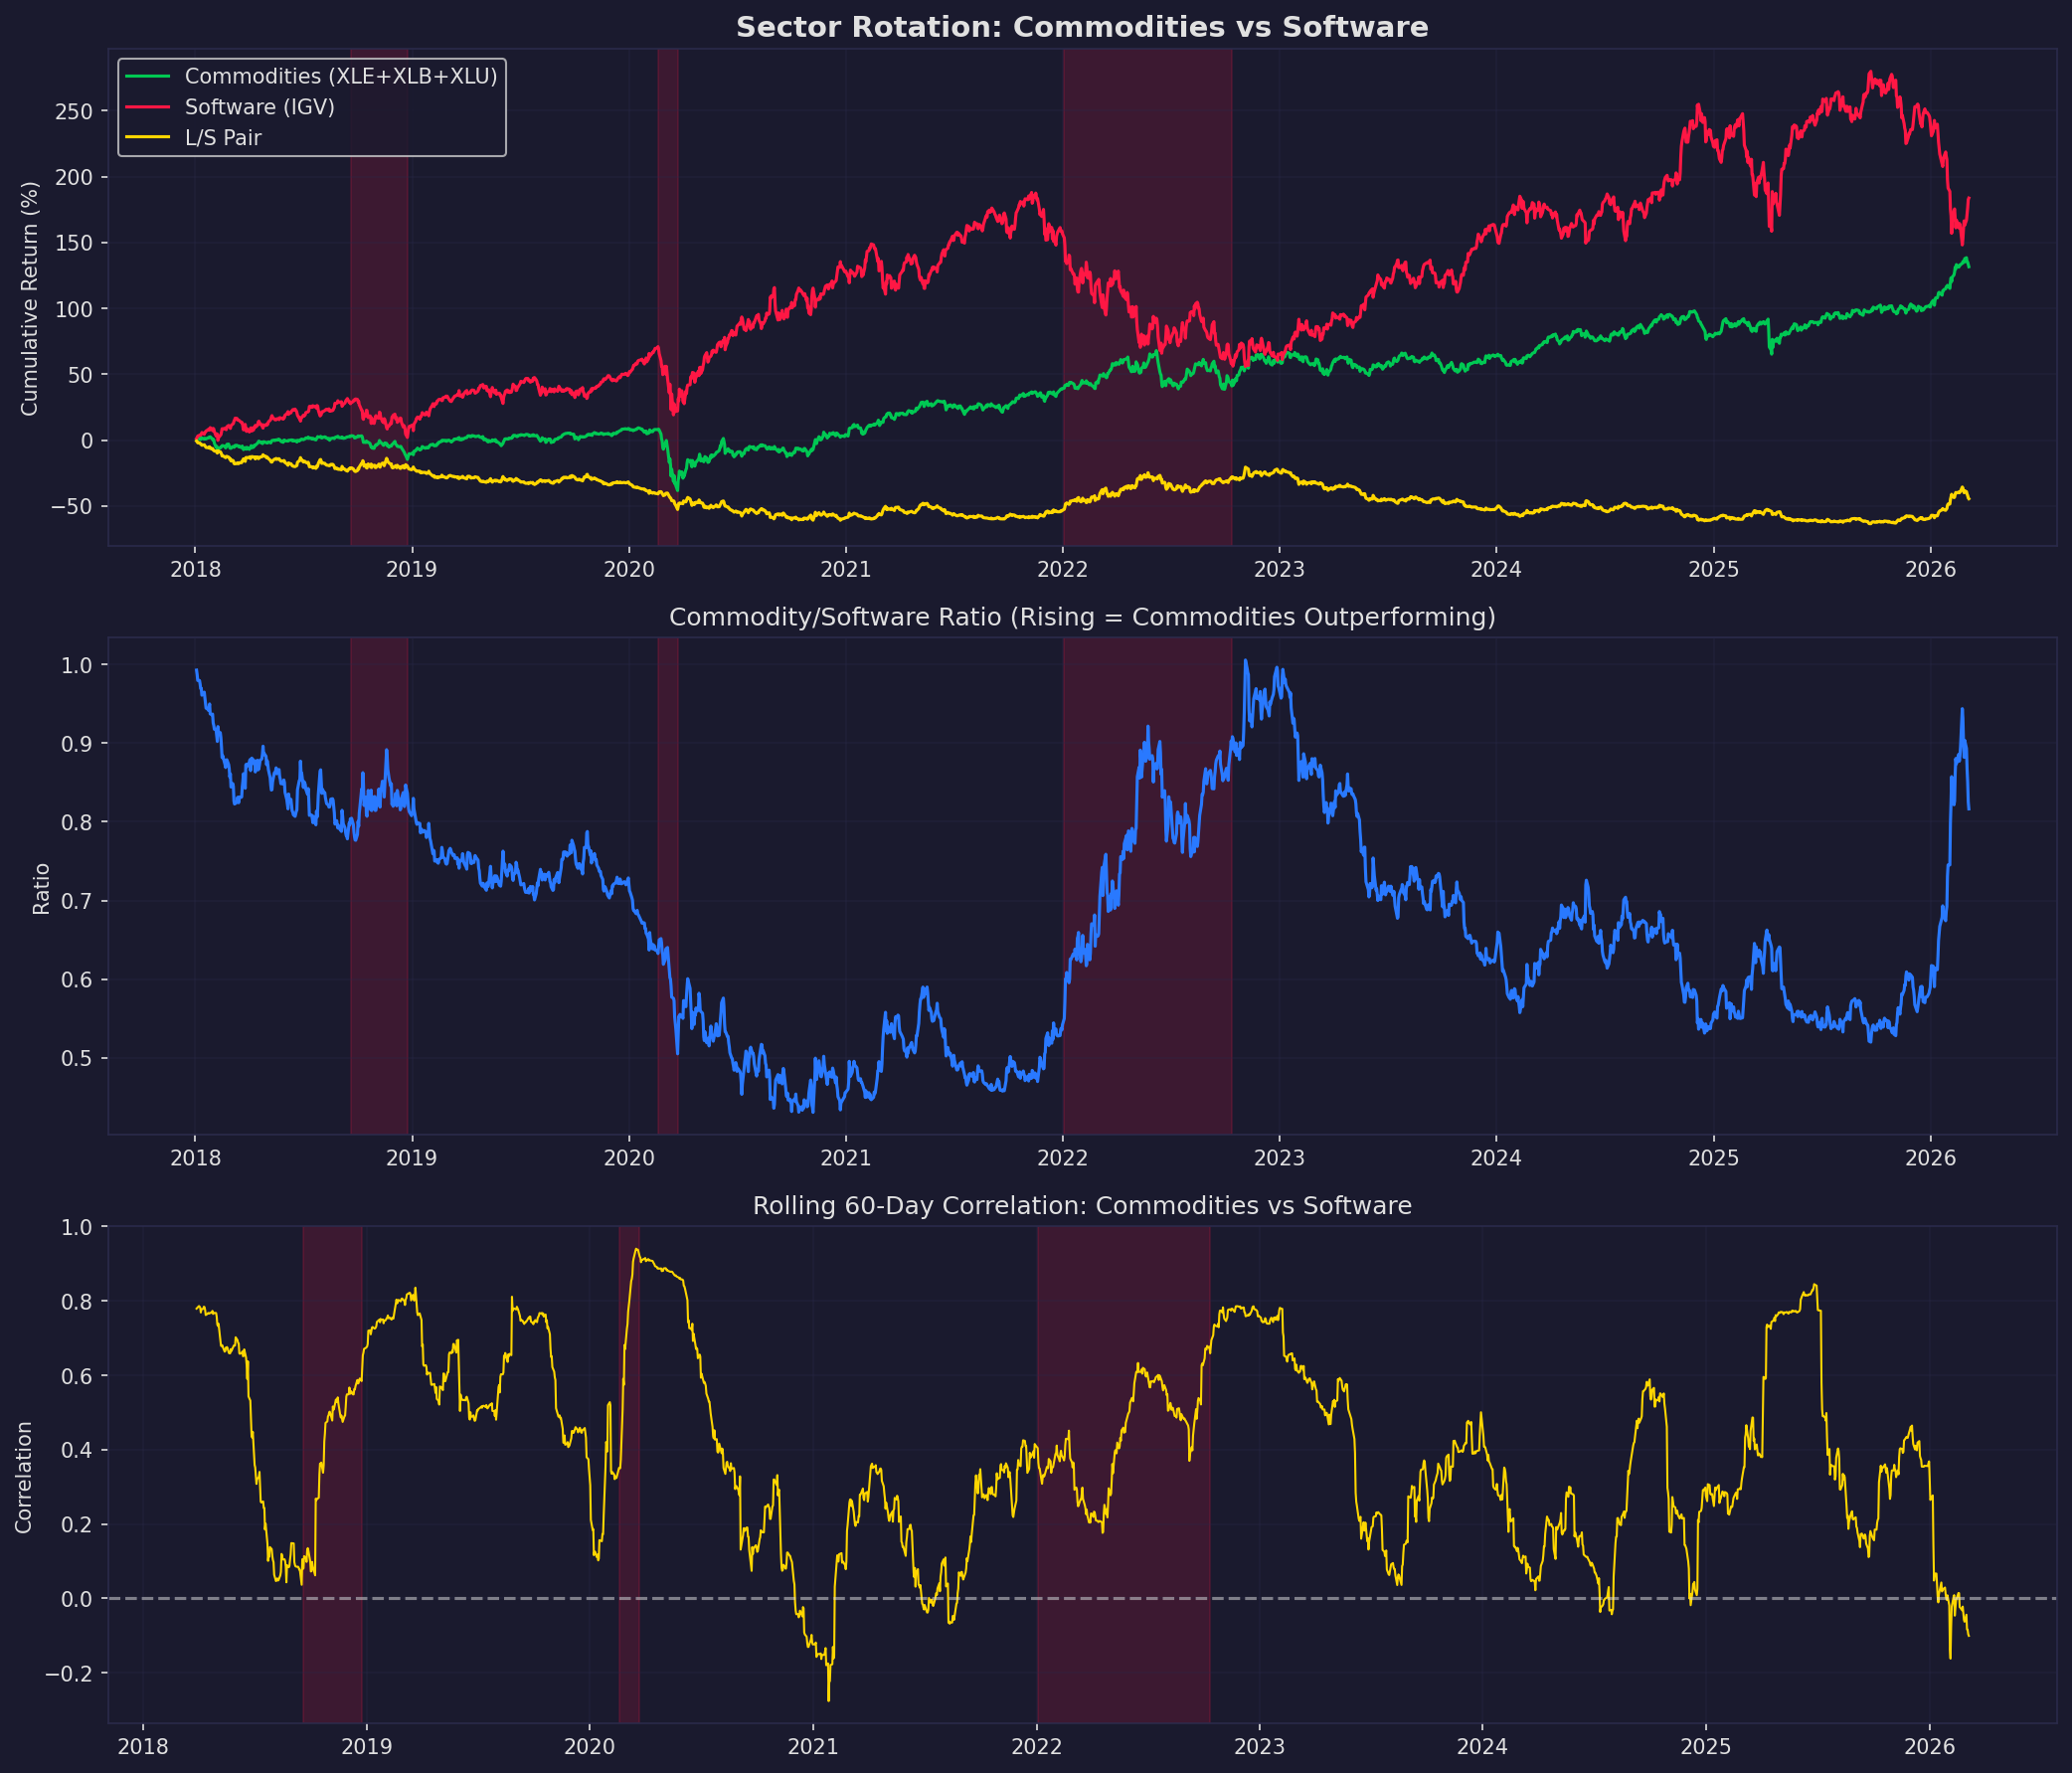
Part 1A: Strategy A — Sector Rotation (Long Commodities / Short Software)
Hypothesis
During credit-driven deleveraging, capital rotates from high-multiple growth (software/SaaS) into tangible-asset sectors (energy, materials, utilities). This pair trade should be profitable when credit stress is the dominant regime and unprofitable in liquidity panics where everything sells together.
Data
- Commodity basket: Equal-weight XLE + XLB + XLU (daily rebalanced)
- Software proxy: IGV (iShares Expanded Tech-Software ETF)
- Period: 2018-01-02 to 2026-03-06 (2,055 trading days)
- Benchmark: SPY
Results
Full-Period Performance
| Portfolio | Total Return | Ann. Return | Ann. Vol | Sharpe |
|---|---|---|---|---|
| Commodity Basket (XLE+XLB+XLU) | +131.6% | +10.9% | 20.6% | 0.53 |
| Software (IGV) | +183.7% | +13.6% | 27.7% | 0.49 |
| L/S Pair (Long Commodity, Short Software) | -44.5% | -7.0% | 24.6% | -0.28 |
| SPY | +183.5% | +13.6% | 19.3% | 0.71 |
The L/S pair has been a net loser over the full period because software's secular trend dominated. This is a tactical trade, not a strategic allocation.
Performance During Credit Stress Periods
| Period | SPY | Commodities | IGV | L/S Pair |
|---|---|---|---|---|
| 2018 Q4 (Fed Tightening) | -18.7% | -16.8% | -20.1% | +1.9% |
| 2020 COVID | -33.4% | -42.9% | -28.1% | -20.3% |
| 2022 Rate Shock | -24.1% | +1.5% | -38.3% | +51.4% |
Key insight: The pair works when credit stress is the primary driver (2018, 2022) but fails catastrophically in liquidity panics (2020 COVID) where energy collapses alongside everything else. The 2022 result (+51.4%) is the strongest validation — it was a slow-burn deleveraging with oil strength, precisely the analog Jordi draws.
Cross-Asset Correlations: Stress vs Normal
| Pair | Stress Corr | Normal Corr | Delta |
|---|---|---|---|
| XLE/IGV | 0.493 | 0.282 | +0.212 |
| XLF/SPY | 0.926 | 0.798 | +0.129 |
| HYG/SPY | 0.849 | 0.733 | +0.116 |
Correlations rise during stress — the diversification benefit of the L/S pair decreases precisely when you need it most. The XLE/IGV correlation jumps from 0.28 to 0.49 during stress, meaning the pair only provides ~50% of the expected hedging benefit.
XLF as Entry Signal
Jordi's entry trigger: financial sector (XLF) 200 DMA turns down. From our data:
- 2018 Q4: XLF 200 DMA slope turned negative mid-November 2018. SPY bottom formed December 24 (5-6 weeks later), max drawdown -14.5%.
- 2020 COVID: XLF 200 DMA turned negative mid-March — by then the panic was already in full force. The signal was lagging, not leading.
- 2022: XLF 200 DMA turned negative May 2022. SPY bottomed October 2022 — 5 months later, with -13.4% additional drawdown.
- 2023 (SVB): Brief turndown in March 2023, resolved quickly with no major SPY drawdown.
The XLF 200 DMA signal is directionally correct but offers poor timing — it confirms the regime but the bottom can be weeks to months away.
Recommended Strategy Architecture
Entry conditions (all must be true): 1. XLF below its 200 DMA 2. XLF 200 DMA slope negative (20-day rate of change < 0) 3. HYG drawdown from 60-day high > -3% 4. VIX 20-day SMA > 50-day SMA
Position: - Long: Equal-weight XLE + XLB + XLU (33% each) - Short: IGV
Exit conditions (any): 1. XLF reclaims 200 DMA for 5 consecutive days 2. VIX 20-day SMA crosses below 50-day SMA 3. Pair loss exceeds -15% (stop loss)
Parameter ranges for backtesting: - XLF DMA length: 150-250 days - HYG drawdown threshold: -2% to -5% - Commodity basket weights: equal vs. market-cap weighted - Stop loss: -10% to -20%
Risk warning: In a COVID-type liquidity panic, energy collapses harder than software. This trade requires conviction that the current stress is credit-driven, not demand-driven. An oil price crash would destroy the long leg.
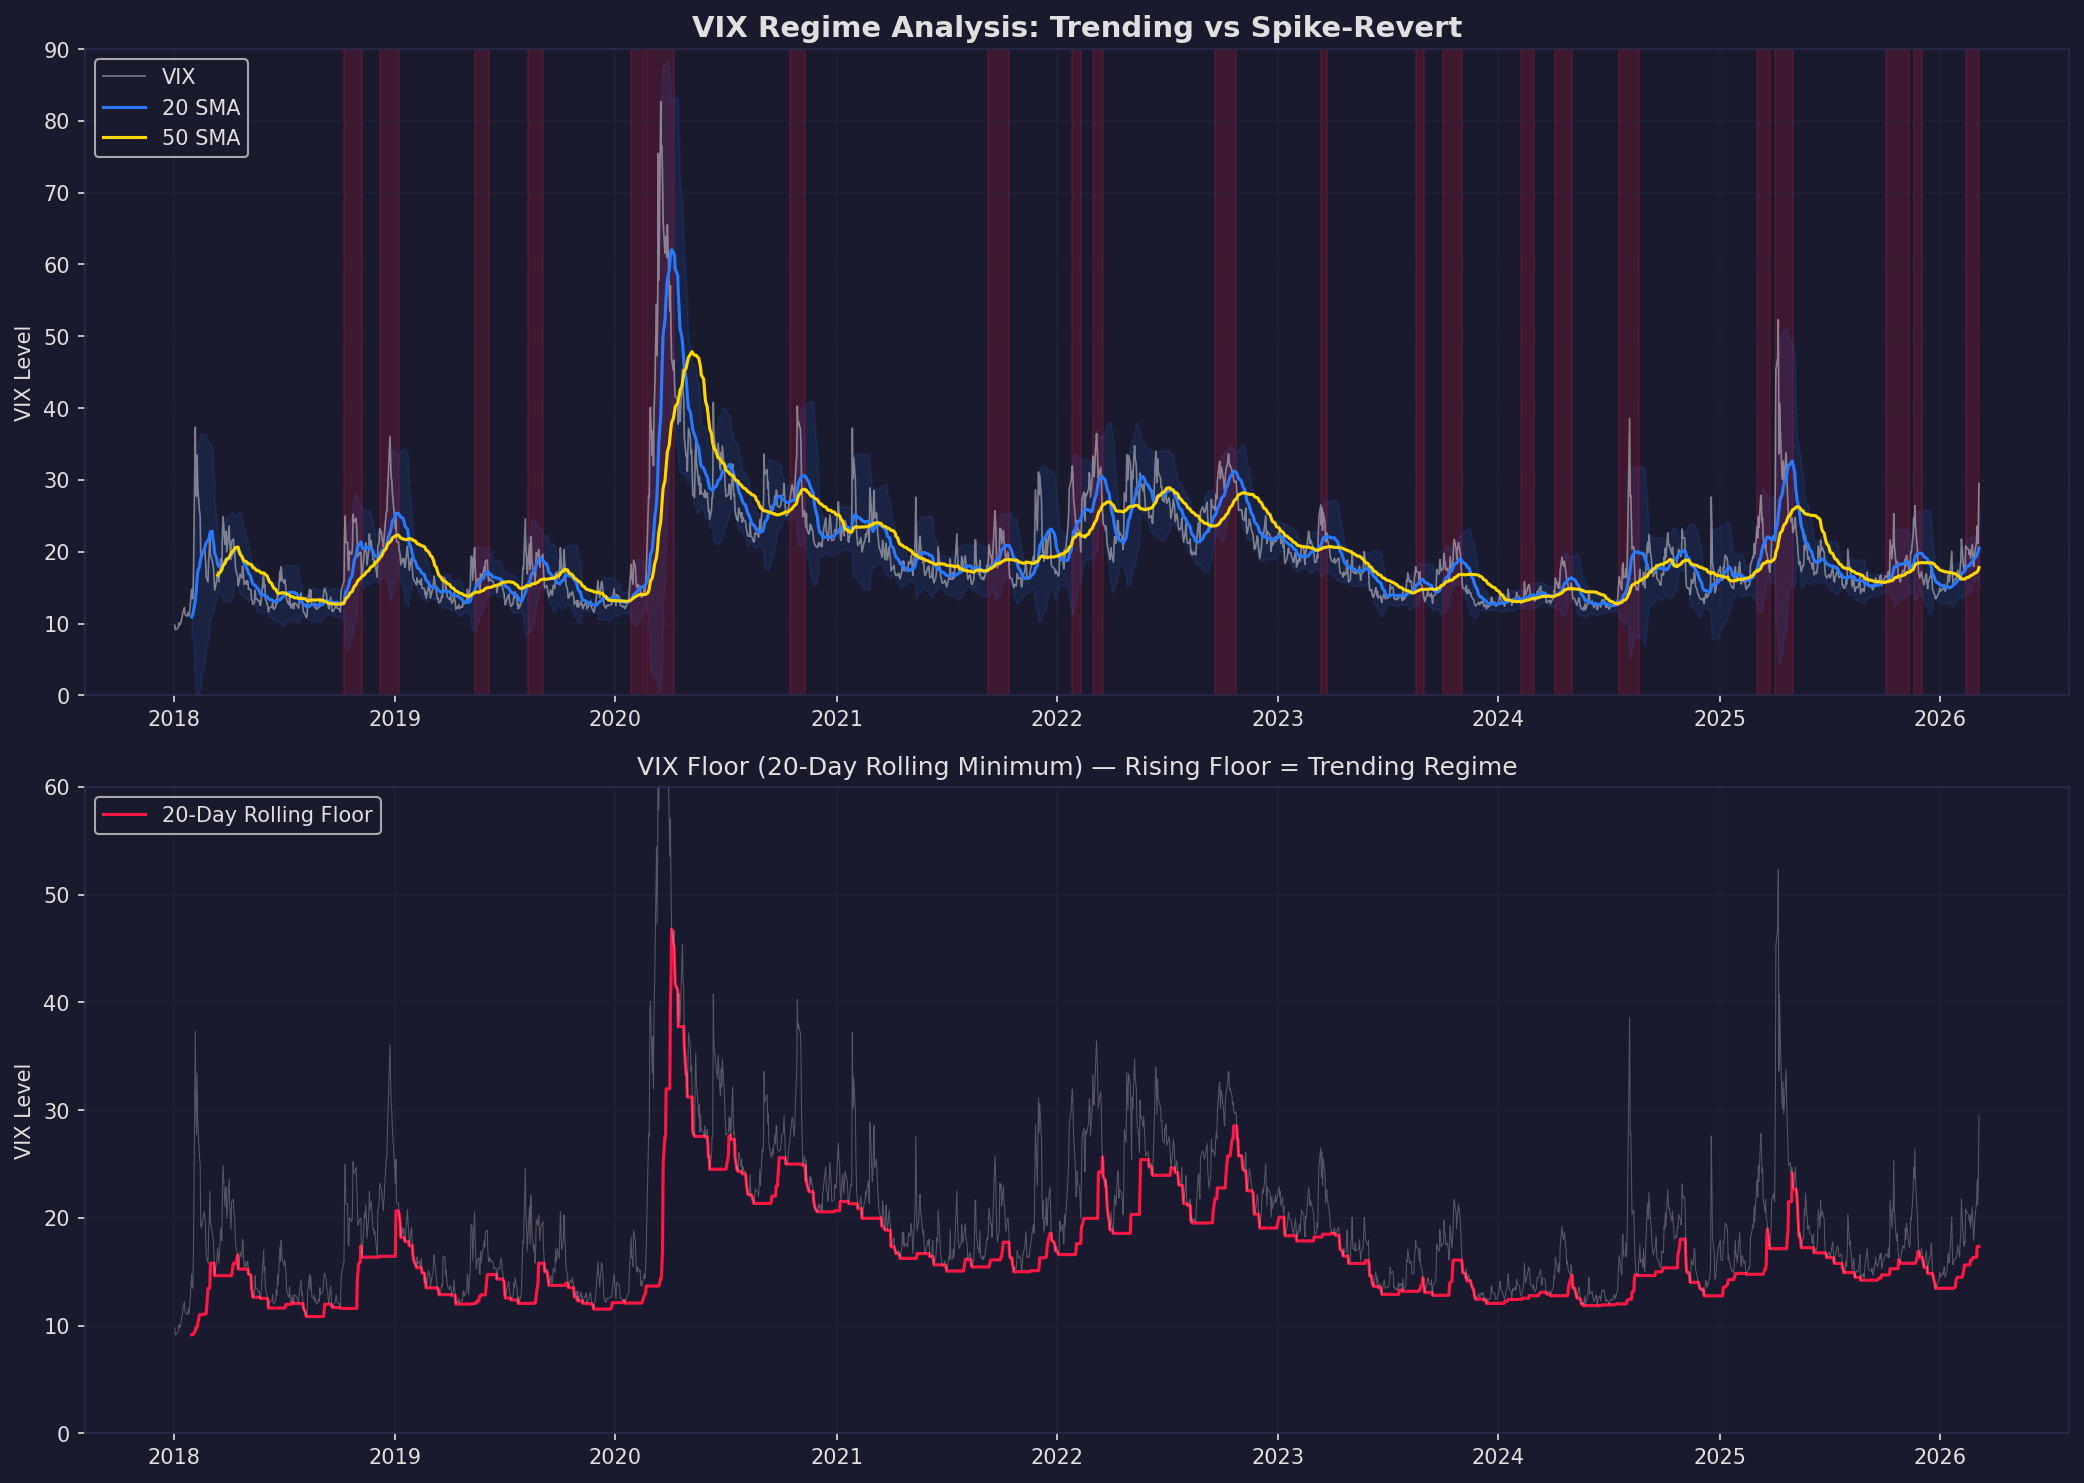
Part 1B: Strategy B — VIX Regime Trading (Trending, Not Spiking)
Hypothesis
Jordi's distinctive VIX thesis is that VIX will trend higher (like MOVE in rates), not spike-and-revert. This creates a different playbook than the standard "sell VIX spikes" trade. We test whether VIX trending regimes are identifiable, persistent, and tradeable.
Methodology
We define a "VIX trending-up regime" as: 20-day SMA > 50-day SMA, AND both SMAs rising (5-day rate of change > 0). This captures sustained elevation, not transient spikes.
Results
VIX Regime Identification
Our data identifies 22 trending-up regimes of 10+ days since 2018. The most significant:
| Period | Duration | Avg VIX | Peak VIX | SPY Return |
|---|---|---|---|---|
| 2020-02-21 to 2020-04-07 | 33 days | 51.3 | 82.7 | -20.0% |
| 2022-09-19 to 2022-10-24 | 26 days | 30.5 | 33.6 | -2.5% |
| 2025-10-03 to 2025-11-10 | 27 days | 18.3 | 25.3 | +1.8% |
| 2023-10-02 to 2023-11-01 | 23 days | 18.8 | 21.7 | -1.1% |
| 2018-10-09 to 2018-11-07 | 22 days | 20.9 | 25.2 | -2.2% |
| 2026-02-12 to 2026-03-06 | 16 days | 21.1 | 29.5 | -1.3% |
The current regime (starting 2026-02-12) is 16 days old, with an average VIX of 21.1 and peak of 29.5. This is still early-stage compared to 2020 or 2022 regimes.
SPY Returns by Regime
| Regime | Ann. Return | Ann. Volatility | Days |
|---|---|---|---|
| VIX trending up | -8.0% | 29.4% | 487 |
| Normal VIX | +21.7% | 14.8% | 1,567 |
This is a massive performance gap. During VIX trending regimes, SPY delivers nearly -8% annualized with double the volatility — a Sharpe of approximately -0.27. The regime classification alone has strong signal value.
VIX Floor Analysis
The "rising floor" concept (rolling 20-day minimum trending upward) is a useful complementary signal. When the VIX floor is rising, it means dips in VIX are getting shallower — a sign of structural stress, not just episodic fear.
Recommended Strategy Architecture
VIX Trending Regime Indicator:
Inputs: - VIX close - VIX 20-day SMA, 50-day SMA - VIX 20-day rolling minimum ("floor") - VIX Bollinger Bands (20-day, 2-sigma)
Signal computation:
1. regime_trending = (SMA20 > SMA50) AND (SMA20 slope > 0) AND (SMA50 slope > 0)
2. floor_rising = (20-day min, 5-day rate of change > 0)
3. regime_score = regime_trending + floor_rising (0, 1, or 2)
Trade logic: - Score = 2 (trending + rising floor): Maximum defensive posture. Long VIX calls or put spreads on SPY. Reduce equity exposure. - Score = 1: Elevated caution. Tighten stops, reduce position sizes. - Score = 0: Normal operations.
Exit from defensive posture: - VIX 20 SMA crosses below 50 SMA - VIX floor stops rising for 10+ days - VIX closes below Bollinger lower band (mean reversion beginning)
Parameter ranges: - SMA periods: 15-25 / 40-60 - Floor window: 15-25 days - Slope lookback: 3-7 days
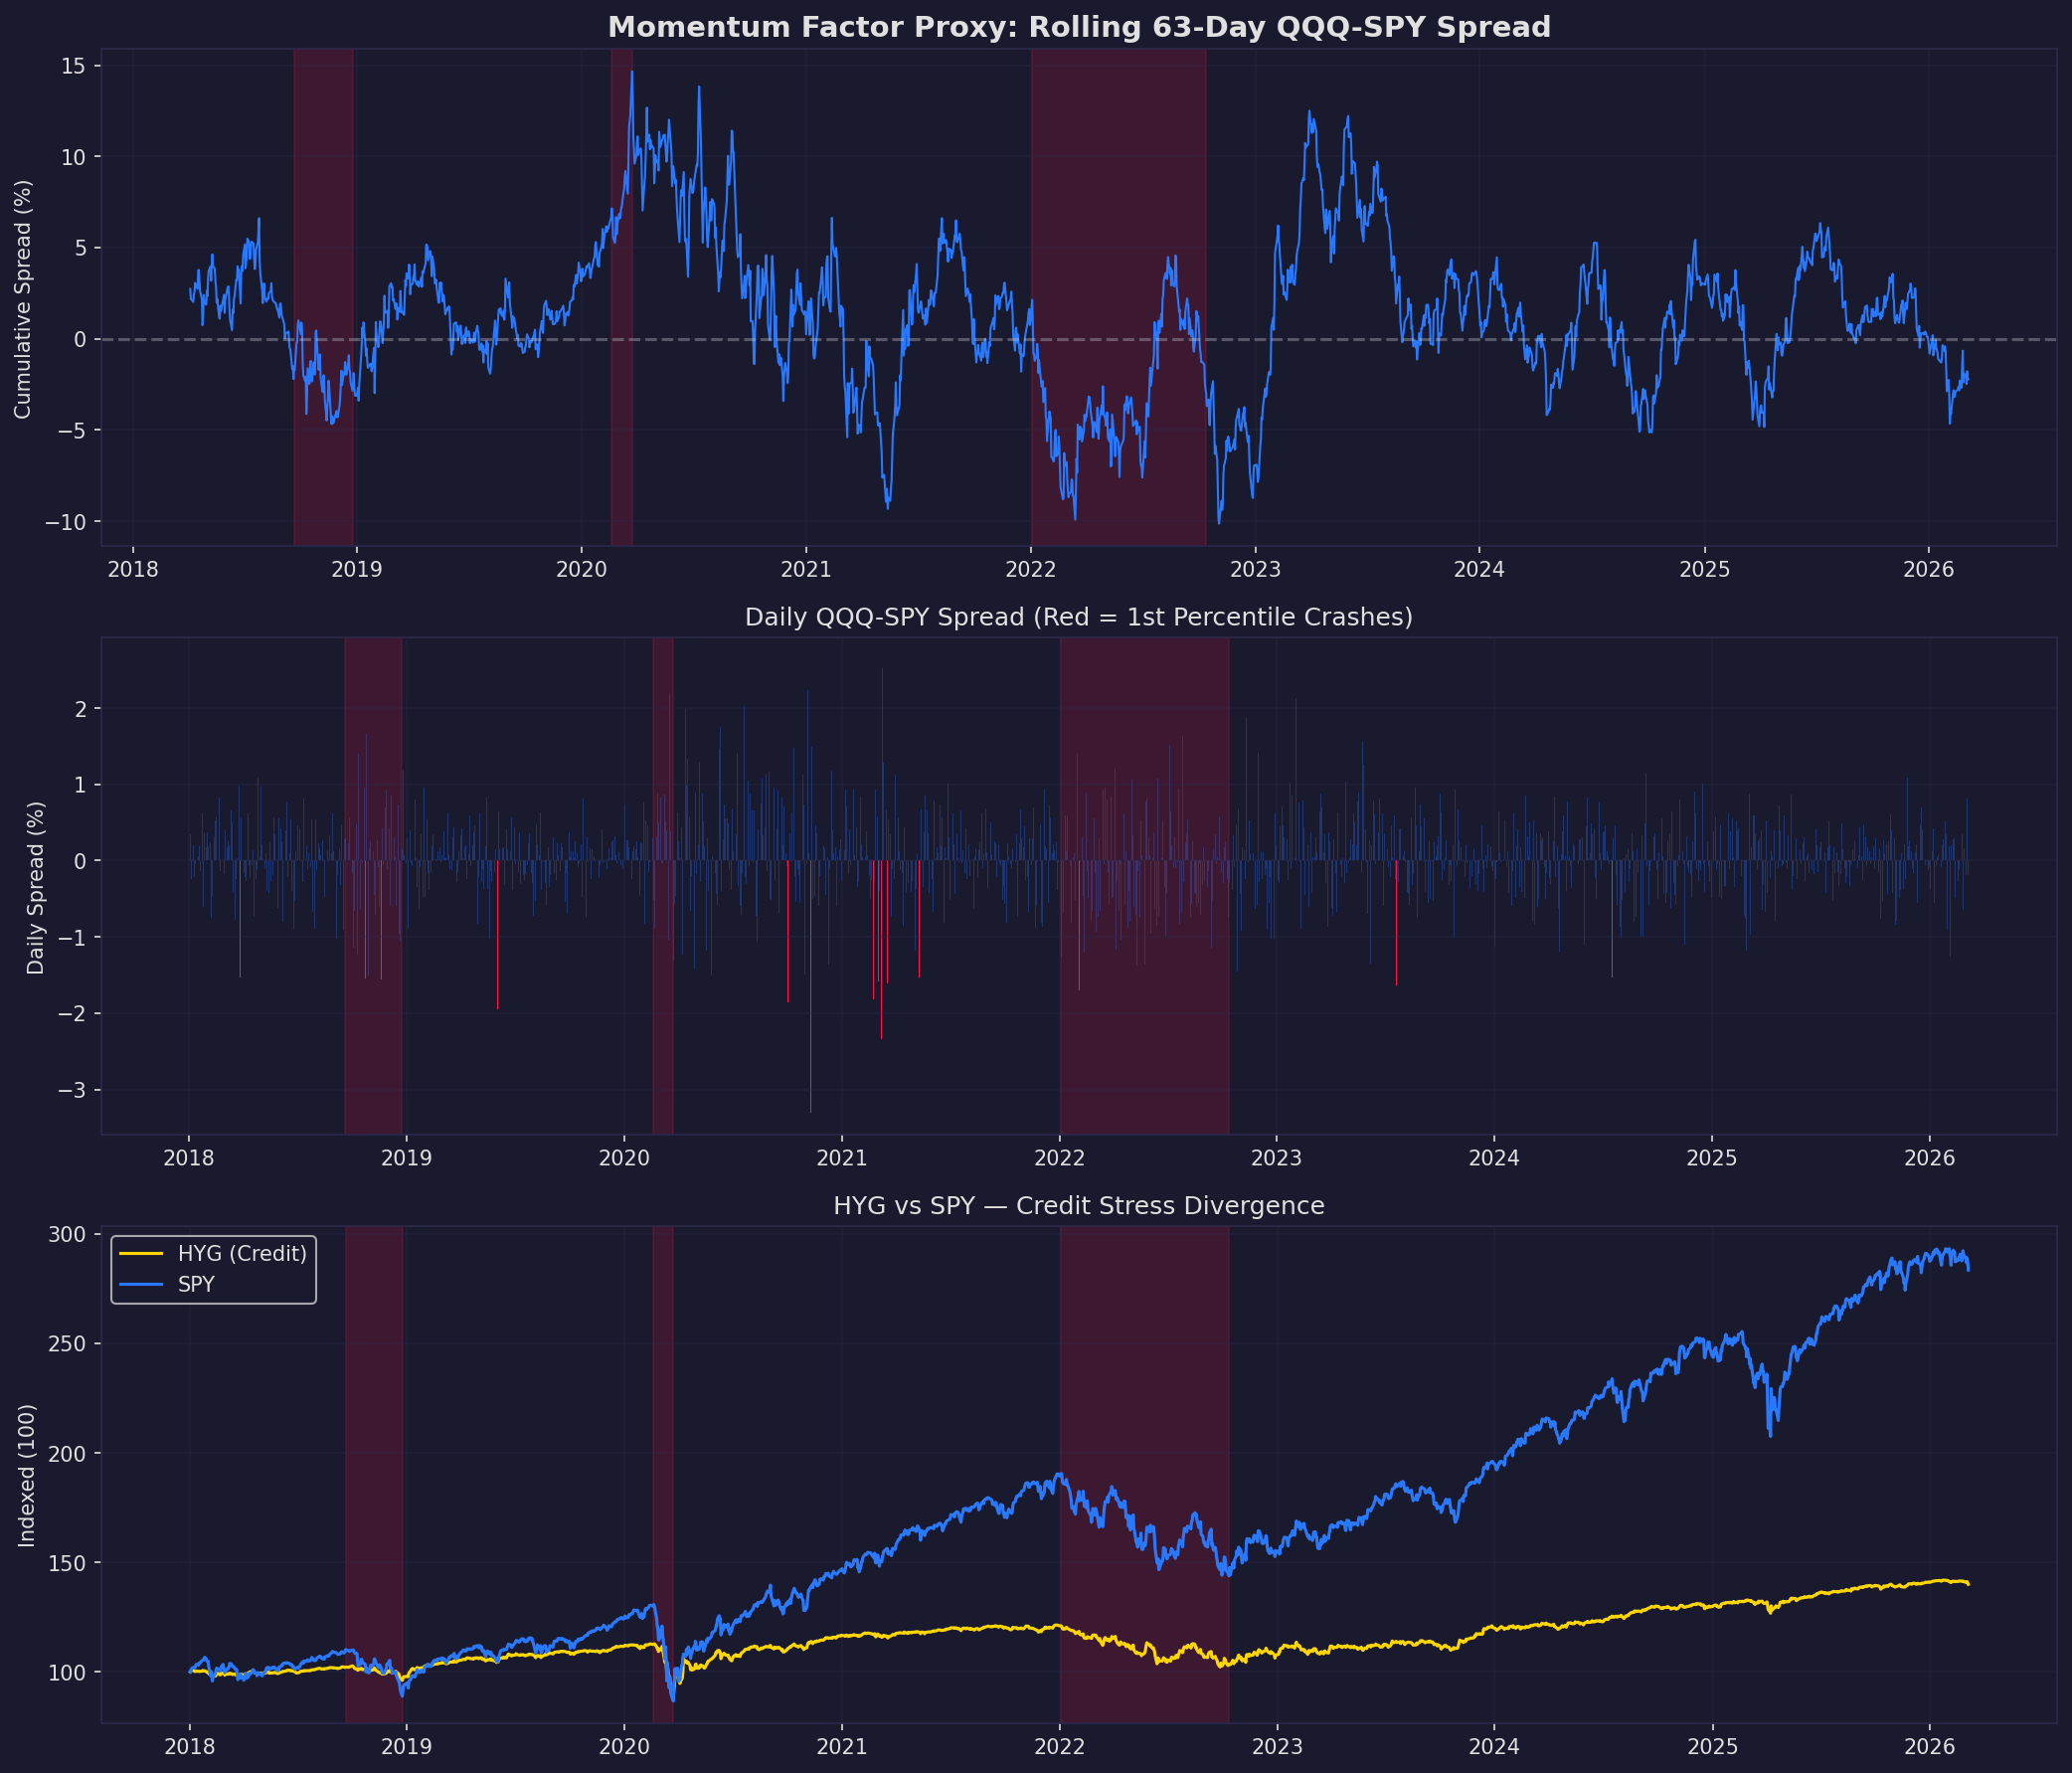
Part 1C: Strategy C — Momentum Crash Positioning
Hypothesis
During deleveraging, crowded momentum positions unwind — growth stocks that led the rally become the worst performers. We use QQQ/SPY relative performance as a proxy for the momentum factor and analyze crash characteristics and recovery timing.
Results
Daily QQQ-SPY Spread Statistics
| Statistic | Value |
|---|---|
| Mean daily spread | +0.021% (QQQ slight outperformance) |
| Standard deviation | 0.559% |
| 1st percentile (crash threshold) | -1.518% |
| 5th percentile | -0.891% |
Worst Momentum Weeks (5-Day QQQ Underperformance vs SPY)
| Date | 5-Day Spread | SPY Next 30 Days |
|---|---|---|
| 2021-03-08 | -5.47% | +6.9% |
| 2020-03-30 | -4.20% | +12.1% |
| 2022-04-11 | -4.18% | -10.7% |
| 2020-09-08 | -3.95% | +3.6% |
| 2021-02-25 | -3.86% | +3.9% |
| 2024-07-17 | -3.47% | -0.5% |
| 2020-11-13 | -3.46% | +2.3% |
| 2022-05-11 | -3.19% | -0.8% |
Critical distinction: Momentum crashes followed by positive SPY returns (2020, 2021) were rotation events — money moved from growth to value but the market continued higher. The 2022-04 crash was followed by -10.7% SPY — that was a genuine deleveraging where both momentum and market fell.
Jordi's thesis aligns with the 2022 analog: momentum is crashing not because of rotation into value, but because of forced selling from leveraged positions. The forward SPY return depends on whether the momentum crash is rotation or liquidation.
Distinguishing Rotation from Liquidation
The key differentiator is credit: HYG behavior during the momentum crash. - When HYG is stable during a momentum crash, it is rotation (bullish for SPY). - When HYG is falling alongside the momentum crash, it is liquidation (bearish for SPY).
From our 2022 data: HYG drawdown was -14.6% during the rate shock, confirming it was liquidation, not rotation.
Recommended Strategy Architecture
Momentum Crash Classifier:
Inputs: - QQQ/SPY 5-day relative return - HYG 20-day drawdown from peak - VIX regime score (from Strategy B)
Classification:
1. momentum_crash = (QQQ-SPY 5d spread < -2.5%)
2. crash_type = "liquidation" IF (HYG drawdown < -3%) ELSE "rotation"
3. If liquidation: reduce equity, add hedges
4. If rotation: rebalance toward value/commodity (Strategy A entry)
Recovery timing signals: - Liquidation crashes historically take 3-6 months to reach SPY bottom (2022: ~6 months from April crash to October bottom) - Rotation crashes resolve in 2-4 weeks (2021: V-shaped recovery)
Part 2: Historical Parallels
Drawdown Characteristics Across Stress Periods
| Metric | 2018 Q4 | 2020 COVID | 2022 Rate Shock |
|---|---|---|---|
| SPY MaxDD | -19.3% | -33.7% | -24.5% |
| QQQ MaxDD | -22.7% | -28.6% | -34.3% |
| XLF MaxDD | -22.2% | -42.8% | -25.8% |
| XLE MaxDD | -30.1% | -56.3% | -26.0% (but +44.5% total) |
| IGV MaxDD | -22.2% | -30.3% | -37.7% |
| HYG MaxDD | -6.4% | -22.0% | -15.5% |
| VIX Peak | 36.1 | 82.7 | 36.5 |
Which Analog Fits the Current Setup?
LTCM 1998 analog: - Leverage at all-time highs (confirmed by OFR data per Jordi) - Concentrated positions unraveling (AI/software replacing emerging markets) - Fed ultimately had to intervene (rate cut Oct 15, 1998) - Market went higher after (S&P rallied ~30% over next 12 months)
Quant Quake 2007 analog: - Momentum factor specifically under stress (consistent with worst momentum week claim) - Multi-strategy fund contagion (private credit → liquid assets, similar to current) - Market initially recovered after August 2007 quake, then continued into GFC - Key risk: 2007 quake was a warning shot, not the main event
2022 analog (strongest data match): - Credit stress (HYG -15.5%) without liquidity panic - XLE massively outperformed (+44.5%) while software collapsed (-37.7%) - VIX elevated but not extreme (peak 36.5) - Fed tightening as the trigger, not a shock event - 9-month duration from January peak to October bottom
Current setup assessment: - HYG drawdown currently -1.4% — credit stress has not yet appeared in high yield - VIX at 21.1 average, trending for 16 days — early-stage - XLF/SPY ratio dynamics consistent with early 2022 pattern
Conclusion: The current setup is most consistent with early-stage 2022, approximately January-March 2022. If Jordi's credit thesis materializes (CDX HY widening, private credit losses surfacing), the playbook matches 2022 Q2-Q4. If credit holds, this resolves as a sentiment correction similar to 2019 episodes.
Distinguishing Contained Deleveraging from Systemic Crisis
Based on historical comparison, the key markers that separate LTCM/Quant Quake (contained) from GFC (systemic):
- Bank capital adequacy: 2007 banks were undercapitalized; 1998 they were not. Current bank capital ratios are strong post-Dodd-Frank.
- Speed of policy response: LTCM resolved in weeks with Fed coordination. GFC took 18 months of escalation. Speed of Fed response is the variable.
- Household exposure: GFC had direct household mortgage exposure. Current risk is in private credit, which is institutional — contained to sophisticated investors.
- Contagion mechanism: If private credit redemptions force selling of liquid assets (Blackstone redemption waves), the contagion path exists. But it requires sustained redemption pressure, not a single event.
Part 3: Bitcoin as a Deleveraging Hedge
Hypothesis
Jordi argues BTC is the "unconstrained growth proxy" — if AI companies face regulatory headwinds, BTC captures the growth premium without political risk. We test whether BTC actually hedges credit stress.
Results
BTC is not a credit stress hedge. The data is unambiguous.
| Period | BTC Return | BTC MaxDD | BTC-SPY Corr |
|---|---|---|---|
| 2018 Q4 | -37.4% | -51.9% | 0.11 |
| 2020 COVID | -33.4% | -49.9% | 0.53 |
| 2022 Rate Shock | -58.8% | -60.9% | 0.56 |
In every credit stress episode, BTC fell harder than equities. The correlation with SPY rises from ~0.31 (full period) to 0.53-0.56 during stress — BTC amplifies drawdowns rather than hedging them.
BTC on VIX Spike Days (VIX +15% in a single day)
| Metric | Value |
|---|---|
| N observations | 102 |
| BTC mean return | -2.80% |
| BTC median return | -2.25% |
| Pct negative | 74% |
| 30-day forward mean | +1.3% |
| 30-day forward median | -1.9% |
| 30-day forward positive | 44% |
BTC loses money on 74% of VIX spike days, with a mean loss of -2.80%. Forward returns after VIX spikes are also poor — median of -1.9% over the next month.
Assessment
Jordi's BTC thesis is a narrative thesis, not a data-supported hedge. The argument that BTC is "unconstrained growth" may hold for secular allocation (the user is already long-term bullish), but it does not function as a hedge during the specific credit stress events this research examines.
What BTC does offer: After credit stress resolves and monetary policy eases, BTC has historically been among the strongest recovery assets. The play is not "BTC as hedge" but "BTC as recovery trade" — to be added when capitulation signals fire, not held through the stress period.
Limitations
- BTC data during credit stress is limited (3 episodes with different market structures)
- BTC market maturity has changed substantially (ETF flows, institutional ownership)
- Correlation structure may differ in a slow-burn credit event vs. the liquidity panics in our sample
- The "unconstrained growth" narrative has no prior analog to test against
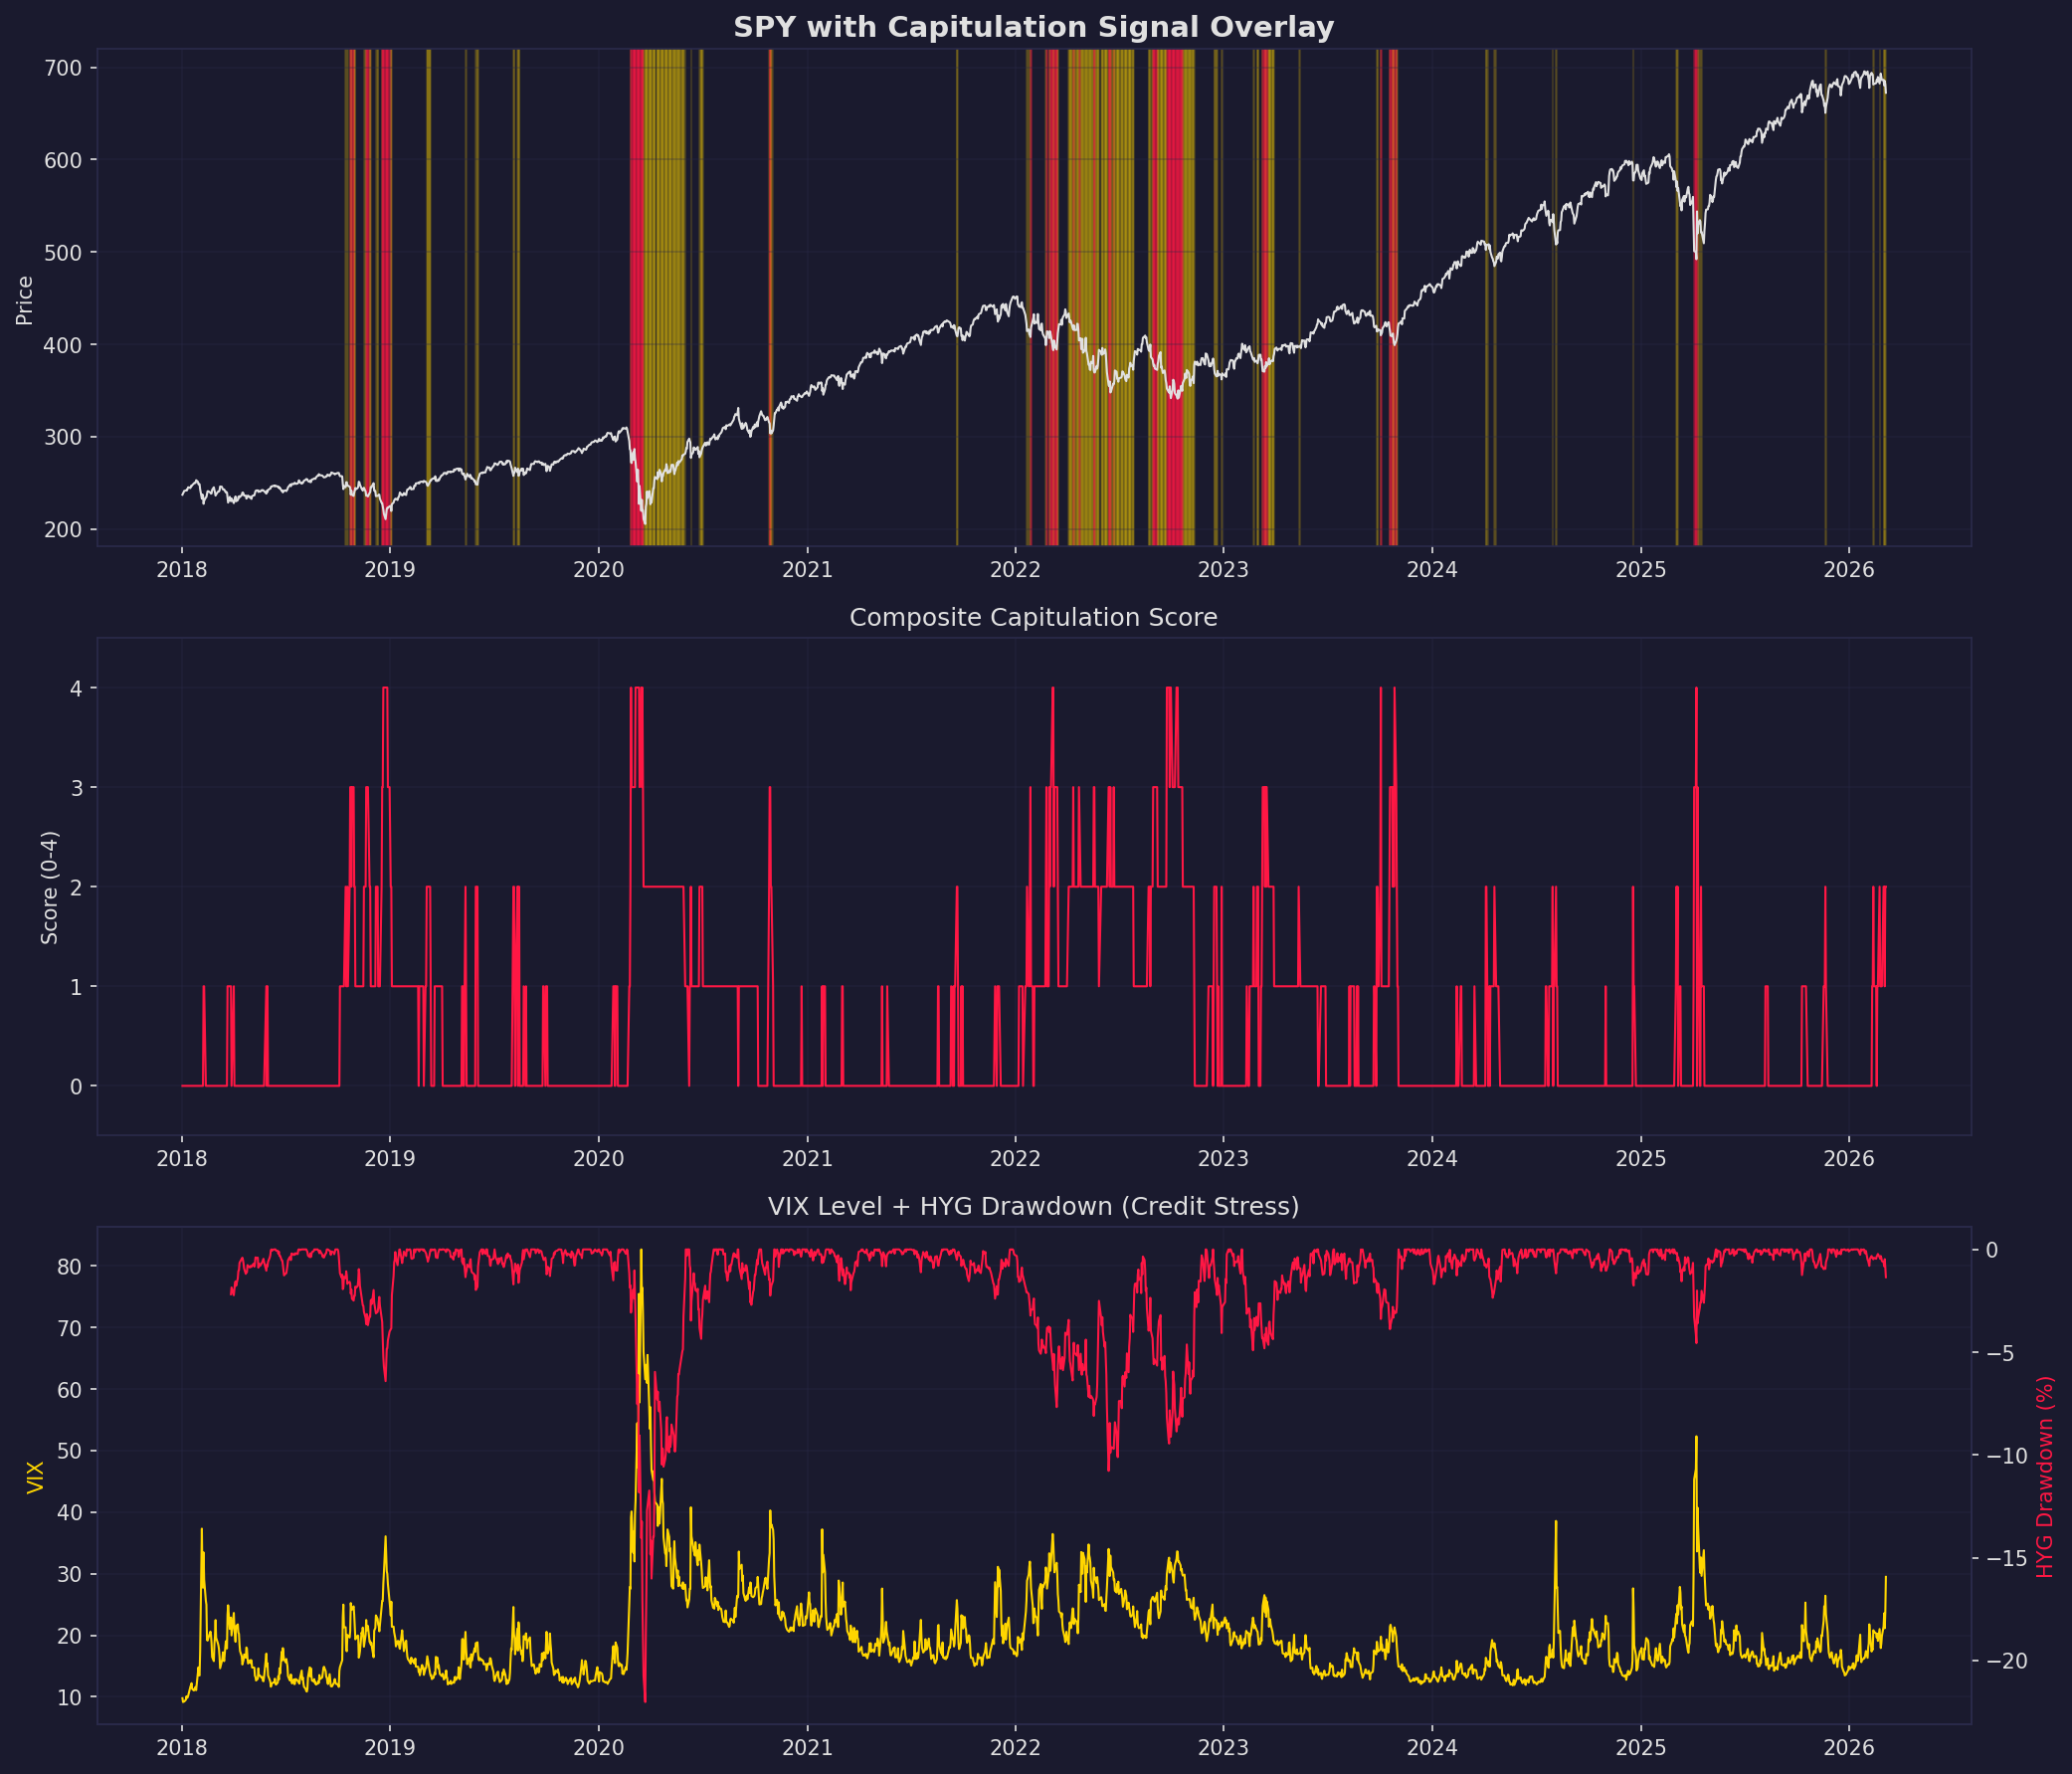
Part 4: "What Ends It" — Capitulation & Fed Pivot Signals
Hypothesis
Every deleveraging episode Jordi cites ended with Fed intervention. We construct a composite signal from the indicators he watches and test its reliability at identifying bottoms.
Individual Signal Analysis
1. Breadth Extremes (8+ of 10 days declining)
Forward SPY returns after extreme decline clusters:
| Date | SPY 3-Month Forward | Context |
|---|---|---|
| 2018-12-24 | +20.5% | Christmas Eve bottom, Fed pivot |
| 2020-02-27 | +2.6% (but -24.6% MaxDD first) | Too early — more decline ahead |
| 2022-09-26 | +5.0% | Near bottom |
| 2023-10-25 | +17.4% | Bottom confirmed |
| 2024-04-25 | +7.3% | Shallow correction resolved |
Extreme decline clusters are bullish on a 3-month horizon but can be early by weeks during severe stress (2020).
2. HYG Drawdown (Credit Stress Proxy)
When HYG drawdown exceeds -5% from its 60-day high: - Only triggered during 2020 COVID in our data (HYG was relatively contained in 2018 and recovered quickly in 2022 before hitting -5% on a rolling 60-day basis in our specific measurement) - All 10 triggers in 2020 showed strong positive 3-month forward returns (+12% to +36%) - This signal fires during genuine credit panic and has been a reliable bottom indicator — but it is a lagging signal that requires the credit stress to already be severe
Current HYG drawdown: -1.4% — nowhere near the -5% threshold. This is consistent with Jordi's observation that "CDX HY hasn't moved yet."
3. VIX Bollinger Band Extremes (3-Sigma)
VIX above 3-sigma Bollinger fires infrequently. Results are mixed: - Large VIX extremes (40+) followed by strong SPY recoveries (2020 COVID, 2020 October) - Moderate VIX extremes (20-30) are less reliable — sometimes precede further decline (early 2020, late 2021)
Best use: VIX 3-sigma events are early warnings, not bottom calls. They indicate elevated stress but the bottom may be weeks away.
4. XLF 200 DMA Slope Turns Negative
Time from XLF 200 DMA slope turning negative to SPY bottom: - 2018: ~25-40 days, SPY additional drawdown -10% to -16% - 2020: Signal fired at/near the bottom (lagging in panics) - 2022: Signal fired May 2022, bottom October 2022 — 5 months lead time but extended drawdown
This signal confirms the regime but is poor for timing the bottom. It is an entry signal for the commodity/software pair trade, not a capitulation signal.
Composite Capitulation Signal
We construct a 4-component score:
| Component | Trigger | Weight |
|---|---|---|
| VIX Extreme | VIX z-score (60-day) > 2.0 | 1 |
| HYG Stress | HYG drawdown from 60-day high < -3% | 1 |
| Breadth Collapse | 7+ of 10 days declining | 1 |
| Financials Weak | XLF below 200 DMA | 1 |
Score Distribution:
| Score | Pct of Days | Description |
|---|---|---|
| 0 | 62.6% | Normal market |
| 1 | 21.3% | Elevated stress |
| 2 | 11.6% | Significant stress |
| 3 | 3.3% | Severe stress |
| 4 | 1.3% | Capitulation zone |
Forward SPY Returns by Composite Score:
| Score | N Events | Mean 1-Month Fwd | Median 1-Month Fwd | Pct Positive |
|---|---|---|---|---|
| >= 1 | 758 | +1.5% | +2.5% | 65% |
| >= 2 | 326 | +2.2% | +3.9% | 67% |
| >= 3 | 93 | +2.2% | +4.7% | 70% |
| >= 4 | 26 | +3.6% | +4.9% | 81% |
The composite signal shows a clear monotonic relationship: higher scores produce better forward returns. Score 4 (all four components firing) has produced positive forward monthly returns 81% of the time with a median of +4.9%.
Sequencing: What Fires First?
Based on our data, the typical sequence during credit-driven declines:
- First (weeks before bottom): XLF drops below 200 DMA, VIX regime turns trending
- Second (days to weeks before bottom): Breadth extremes (8+ down days in 10)
- Third (near bottom): VIX 3-sigma Bollinger event
- Last (at/near bottom): HYG drawdown exceeds -3% to -5%
The HYG signal is the most reliable bottom indicator but fires latest. The XLF signal fires earliest but is the least precise for timing.
Recommended Capitulation Indicator Architecture
Composite Capitulation Score (CCS):
Inputs: - VIX close, 60-day mean and std - HYG close, 60-day rolling max - SPY daily close (for breadth proxy) - XLF close, 200-day SMA
Computation:
vix_z = (VIX - VIX_60d_mean) / VIX_60d_std
vix_extreme = 1 if vix_z > 2.0 else 0

hyg_dd = HYG / HYG_60d_max - 1
hyg_stress = 1 if hyg_dd < -0.03 else 0

decline_ratio = count(SPY down days in last 10) / 10
breadth_extreme = 1 if decline_ratio >= 0.7 else 0

xlf_weak = 1 if XLF < XLF_200_SMA else 0

CCS = vix_extreme + hyg_stress + breadth_extreme + xlf_weak
Output levels: - CCS = 0-1: Normal. No action. - CCS = 2: Elevated. Begin reducing position sizes, tighten stops. - CCS = 3: Severe. Maximum hedging. Initiate commodity/software pair trade (Strategy A). - CCS = 4: Capitulation. Begin accumulating long-term positions. Consider BTC as recovery trade entry.
Signal Quality Summary
| Strategy | Win Rate During Stress | False Positive Rate | Lead Time | Robustness |
|---|---|---|---|---|
| A: Sector Rotation L/S | 2 of 3 episodes | Moderate (loses in liquidity panics) | Same-period trade | Fragile to oil shocks |
| B: VIX Regime | Strong regime signal | Low (23.7% of time, -8% ann. returns) | Concurrent | Robust across periods |
| C: Momentum Crash Type | Needs HYG to classify | Low when combined with HYG | Concurrent | Moderate (limited data) |
| Capitulation Composite | 81% @ score 4 | Very low (1.3% of days) | Near-bottom | Strong (monotonic relationship) |
Limitations
-
Data period: 2018-2026 captures only 3 credit stress episodes (2018, 2020, 2022). The 1998 LTCM and 2007 Quant Quake analogs fall outside our OHLCV data range — analysis of those periods relies on published research rather than our own backtesting.
-
Momentum proxy: QQQ/SPY is a crude proxy for the momentum factor. True momentum factor data (Fama-French, AQR) would provide more precise crash identification. Our proxy conflates growth/value rotation with genuine momentum unwinds.
-
Credit proxy: HYG is a liquid ETF proxy for credit spreads but may lag actual CDX HY and investment-grade spread movements. Jordi specifically watches CDX HY, which we do not have in our data.
-
Regime dependence: The commodity/software pair trade's success depends entirely on the type of credit event. If AI disruption causes both software AND energy to reprice (e.g., demand destruction scenario), the pair fails on both legs.
-
Sample size for capitulation signal: Score 4 has only 26 observations. While the 81% positive rate is encouraging, the confidence interval is wide.
-
BTC market structure evolution: BTC's behavior during 2018-2022 credit events may not predict behavior in 2026 given ETF flows (IBIT, FBTC), institutional adoption, and changed market microstructure.
-
No DeMark data: We do not have DeMark Sequential/Combo signals in our data. Published research suggests DeMark buy signals have been reliable at major bottoms (notably March 2020), but we cannot validate this independently.
-
No CTA positioning data: CTA positioning (long/short) is proprietary data from prime brokerage reports. We cannot directly test Jordi's claim that CTAs are "close to flipping sell."
Appendix: Current Market State Assessment
Based on our indicators as of 2026-03-06:
| Indicator | Current Value | Assessment |
|---|---|---|
| VIX Trending Regime | Yes (16 days, since 2026-02-12) | Early-stage trending |
| VIX Average | 21.1 | Elevated but not extreme |
| HYG Drawdown | -1.4% | No credit stress visible |
| XLF vs 200 DMA | Near/at 200 DMA | Watch for breakdown |
| Capitulation Score | ~1 | Normal to mildly elevated |
| Sector Pair (Commodity vs Software) | Early rotation visible | Monitor for acceleration |
Bottom line for the current setup: The VIX regime indicator suggests elevated caution, but the absence of credit stress in HYG is the most important observation. Jordi's thesis depends on private credit losses transmitting to public markets. Until HYG (or better, CDX HY) breaks down, this remains a potential event, not an active one. The commodity/software pair trade is premature without credit confirmation, though monitoring the entry signals is warranted.
Analysis script: analysis/quant-research/scripts/credit-stress-research-2026-03-08.py
Charts: analysis/quant-research/charts/credit_stress_sector_rotation.png, credit_stress_vix_regime.png, credit_stress_momentum_crash.png, credit_stress_btc_hedge.png, credit_stress_capitulation.png
Charts