BTC Relief Rally Thesis: Can Price Rally Back to the 50-Week EMA?
BTC Relief Rally Thesis: Can Price Rally Back to the 50-Week EMA?
Date: 2026-03-04 Author: Quant Researcher Agent Asset: BTC-USD Data Period: 2018-01-01 to 2026-03-04 (weekly timeframe) Status: Complete Script:
analysis/quant-research/scripts/btc-relief-rally-thesis-2026-03-04.py
Verdict
The thesis that BTC will rally back to the 50-week EMA is not well-supported by historical evidence. The data shows that from the current position (25% below the 50-week EMA), the probability of reaching the EMA within 12 weeks is approximately 10% (3 of 29 historical instances). In 79% of comparable cases, price eventually reclaimed the 50-week EMA -- but only after 45-68 weeks, and primarily because the EMA declined to meet price, not because price rallied to meet the EMA.
There are bullish factors (200-week EMA support, oversold RSI, MACD histogram divergence, declining selling volume) that support a bounce -- but a bounce is not the same as a rally to the 50-week EMA. The median historical bounce from this position is approximately 17%, which would take BTC from $68K to roughly $80K. That would still leave it 12% below the 50-week EMA.
A more realistic near-term scenario is a 10-20% bounce that fails to reach the 50-week EMA, consistent with the historical base rate.
1. Hypothesis
Primary hypothesis: BTC is setting up for a relief rally that will carry price back to the 50-week EMA (~$91,194 at current levels).
Null hypothesis: BTC's current position (25% below the 50-week EMA) is more consistent with a mid-bear transit zone than a bottoming formation, and historical precedent does not support a rapid rally to the 50-week EMA from this depth.
2. Data
| Source | Range | Bars (Weekly) | Notes |
|---|---|---|---|
data-samples/ohlcv/BTC-USD.csv |
2018-01-01 to 2026-03-04 | 428 | Daily resampled to weekly (Monday start) |
Cleaning: Daily OHLCV resampled to weekly using standard aggregation (first open, max high, min low, last close, sum volume). No missing data. All EMAs computed using exponential weighting with adjust=False (recursive implementation).
3. Current Setup Characterization
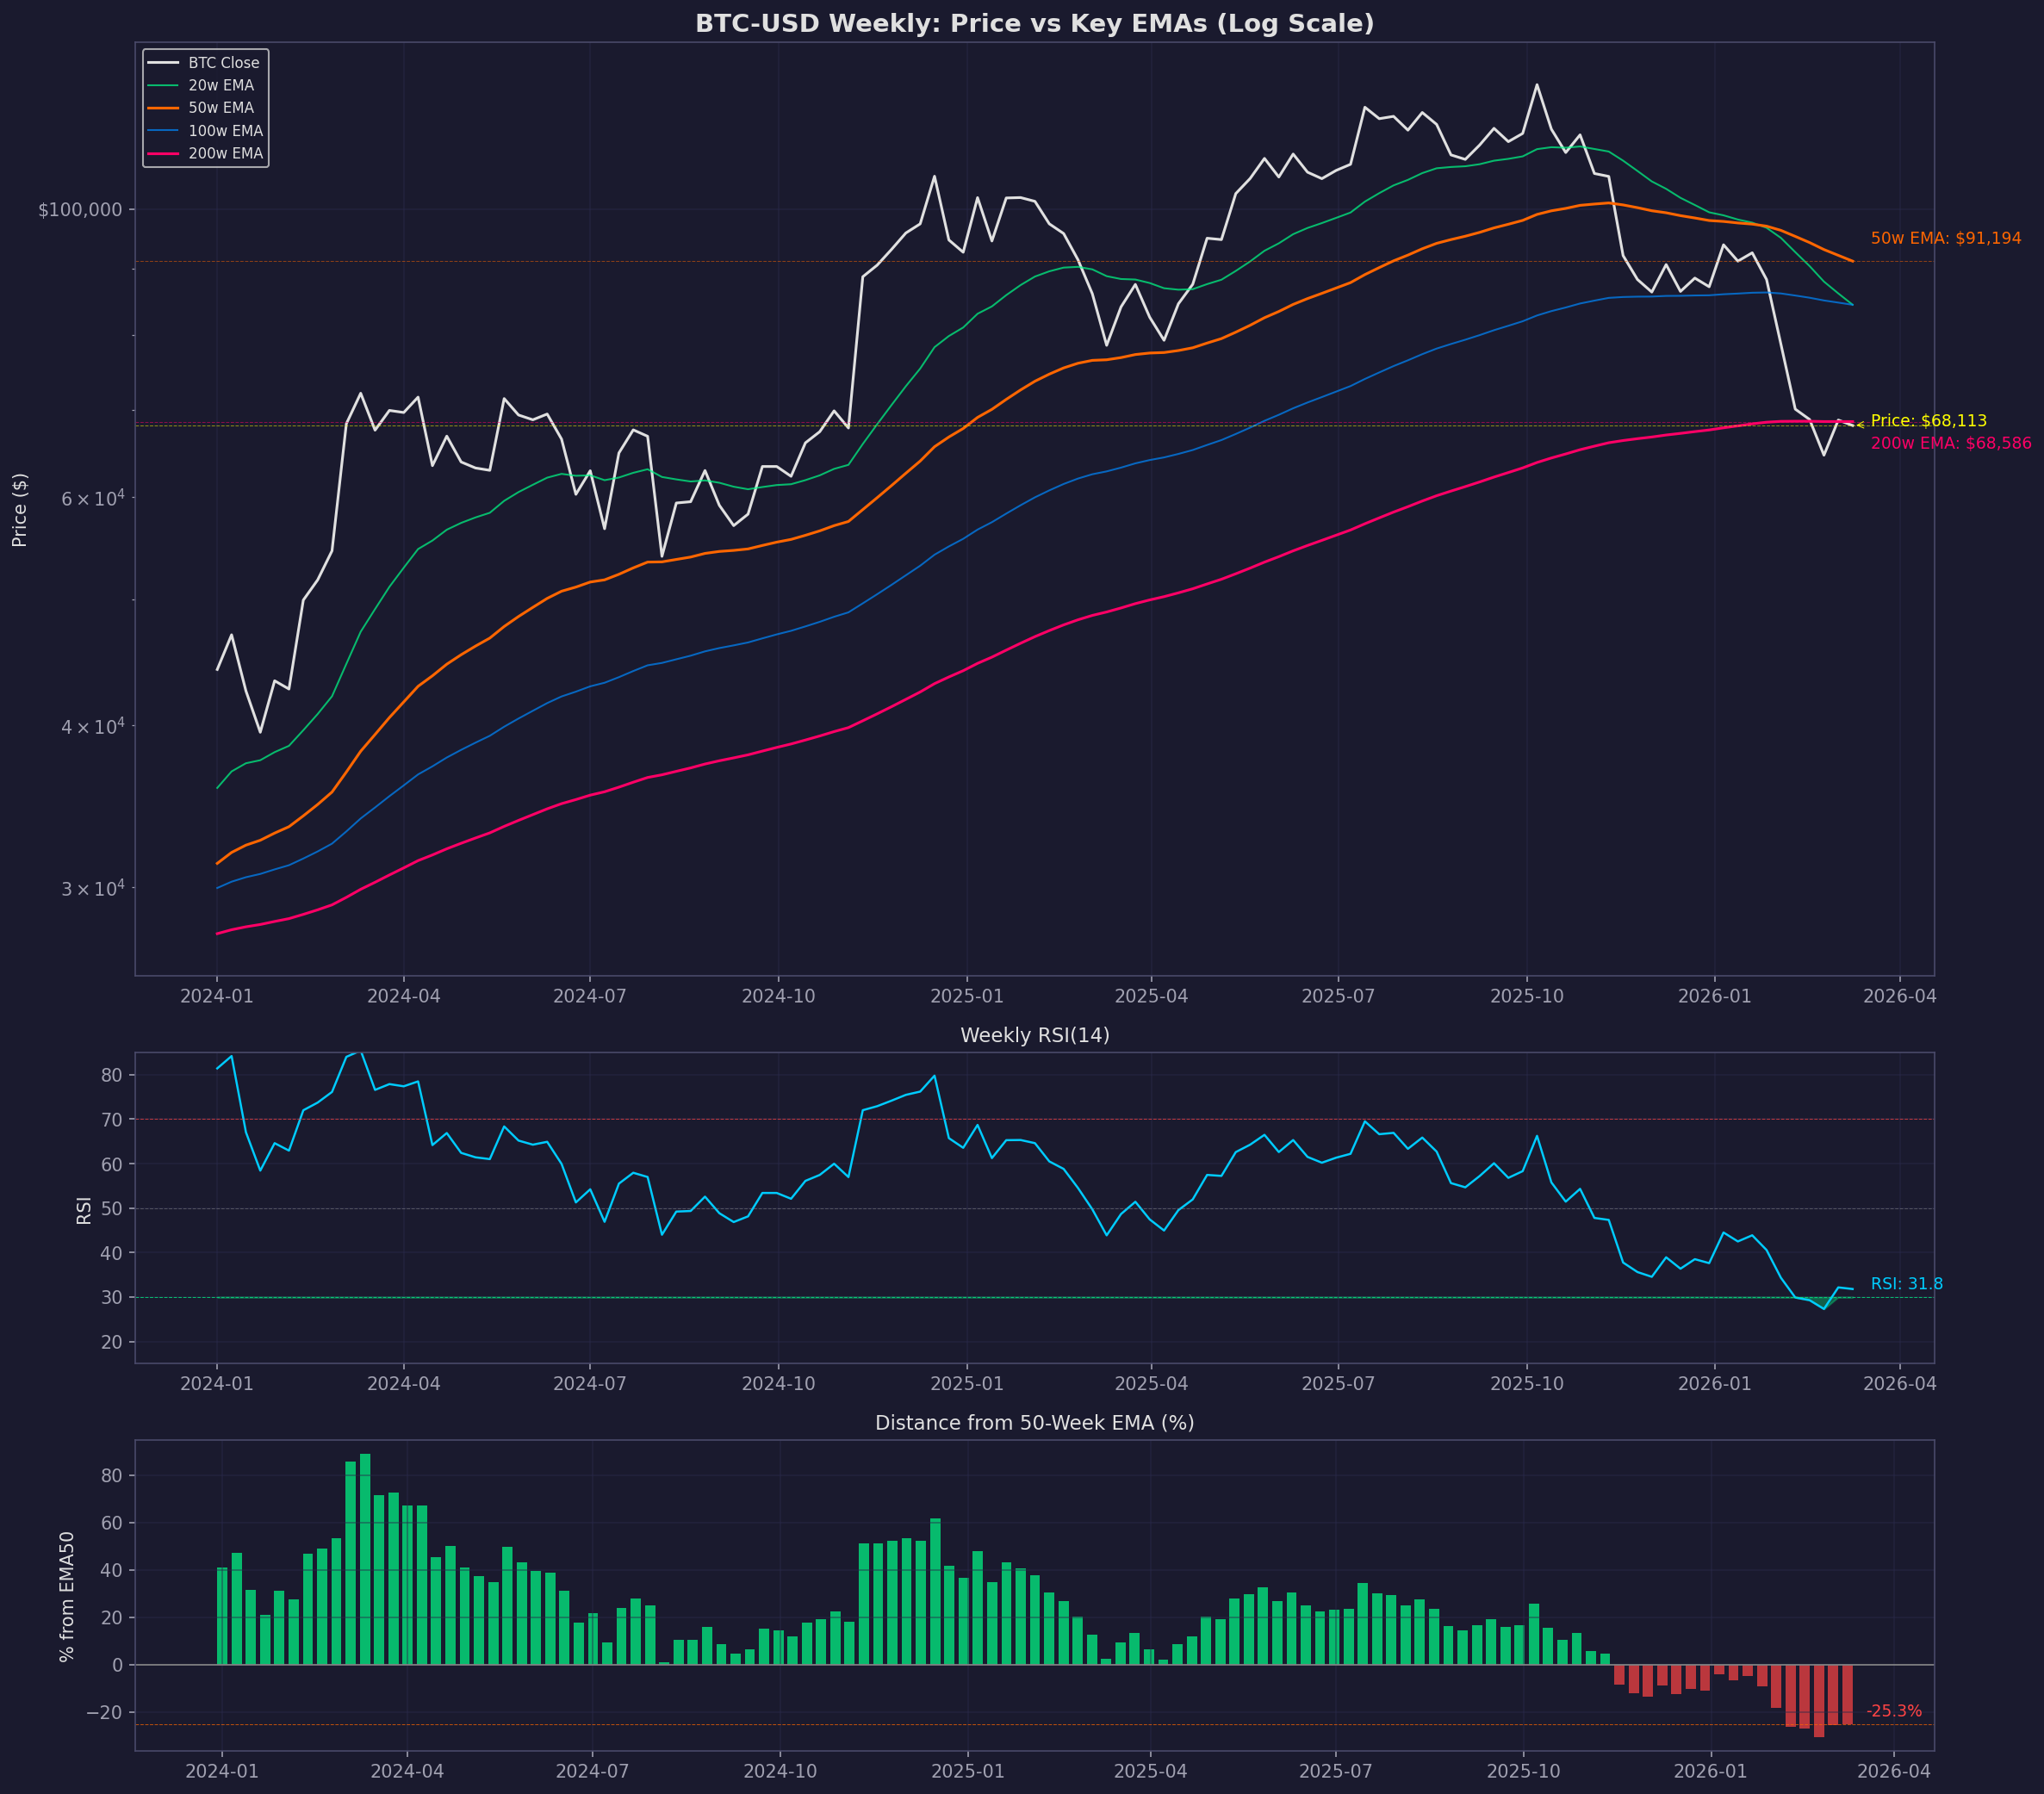
Weekly EMA Positioning
| Metric | Value | Assessment |
|---|---|---|
| Price | $68,113 | |
| 20-week EMA | $84,399 | -19.3% below |
| 50-week EMA | $91,194 | -25.3% below |
| 100-week EMA | $84,393 | -19.3% below |
| 200-week EMA | $68,586 | -0.7% below (at support) |
| Weekly RSI(14) | 31.8 | Oversold (below 35) |
| MACD Line | -9,486 | Deep negative |
| MACD Signal | -7,148 | Deep negative |
| MACD Histogram | -2,338 | Negative but improving |
| Drawdown from ATH | -46.0% | ($126,198 ATH on 2025-10-06) |
| Weeks below 50w EMA | ~16 | Since Nov 2025 |
Summary: BTC is deeply below all short- and intermediate-term EMAs but sitting directly on the 200-week EMA, which is the historically most important long-term support level. RSI is in oversold territory. MACD histogram shows early signs of improvement (less negative for 2 consecutive weeks), and there is a bullish MACD histogram divergence (lower price low on Feb 23, higher histogram low).
Percentile Context: Distance from 50-Week EMA
| Percentile | Value |
|---|---|
| 5th | -41.6% |
| 10th | -36.1% |
| 25th | -16.0% |
| Current | -25.3% |
| 50th (median) | +9.3% |
| 75th | +30.0% |
| 95th | +78.0% |
Being 25% below the 50-week EMA is between the 10th and 25th percentile historically -- a position seen roughly 15-20% of the time. This is notable but not extreme by BTC standards.
4. Historical Precedent Analysis
4.1 Similar Episodes
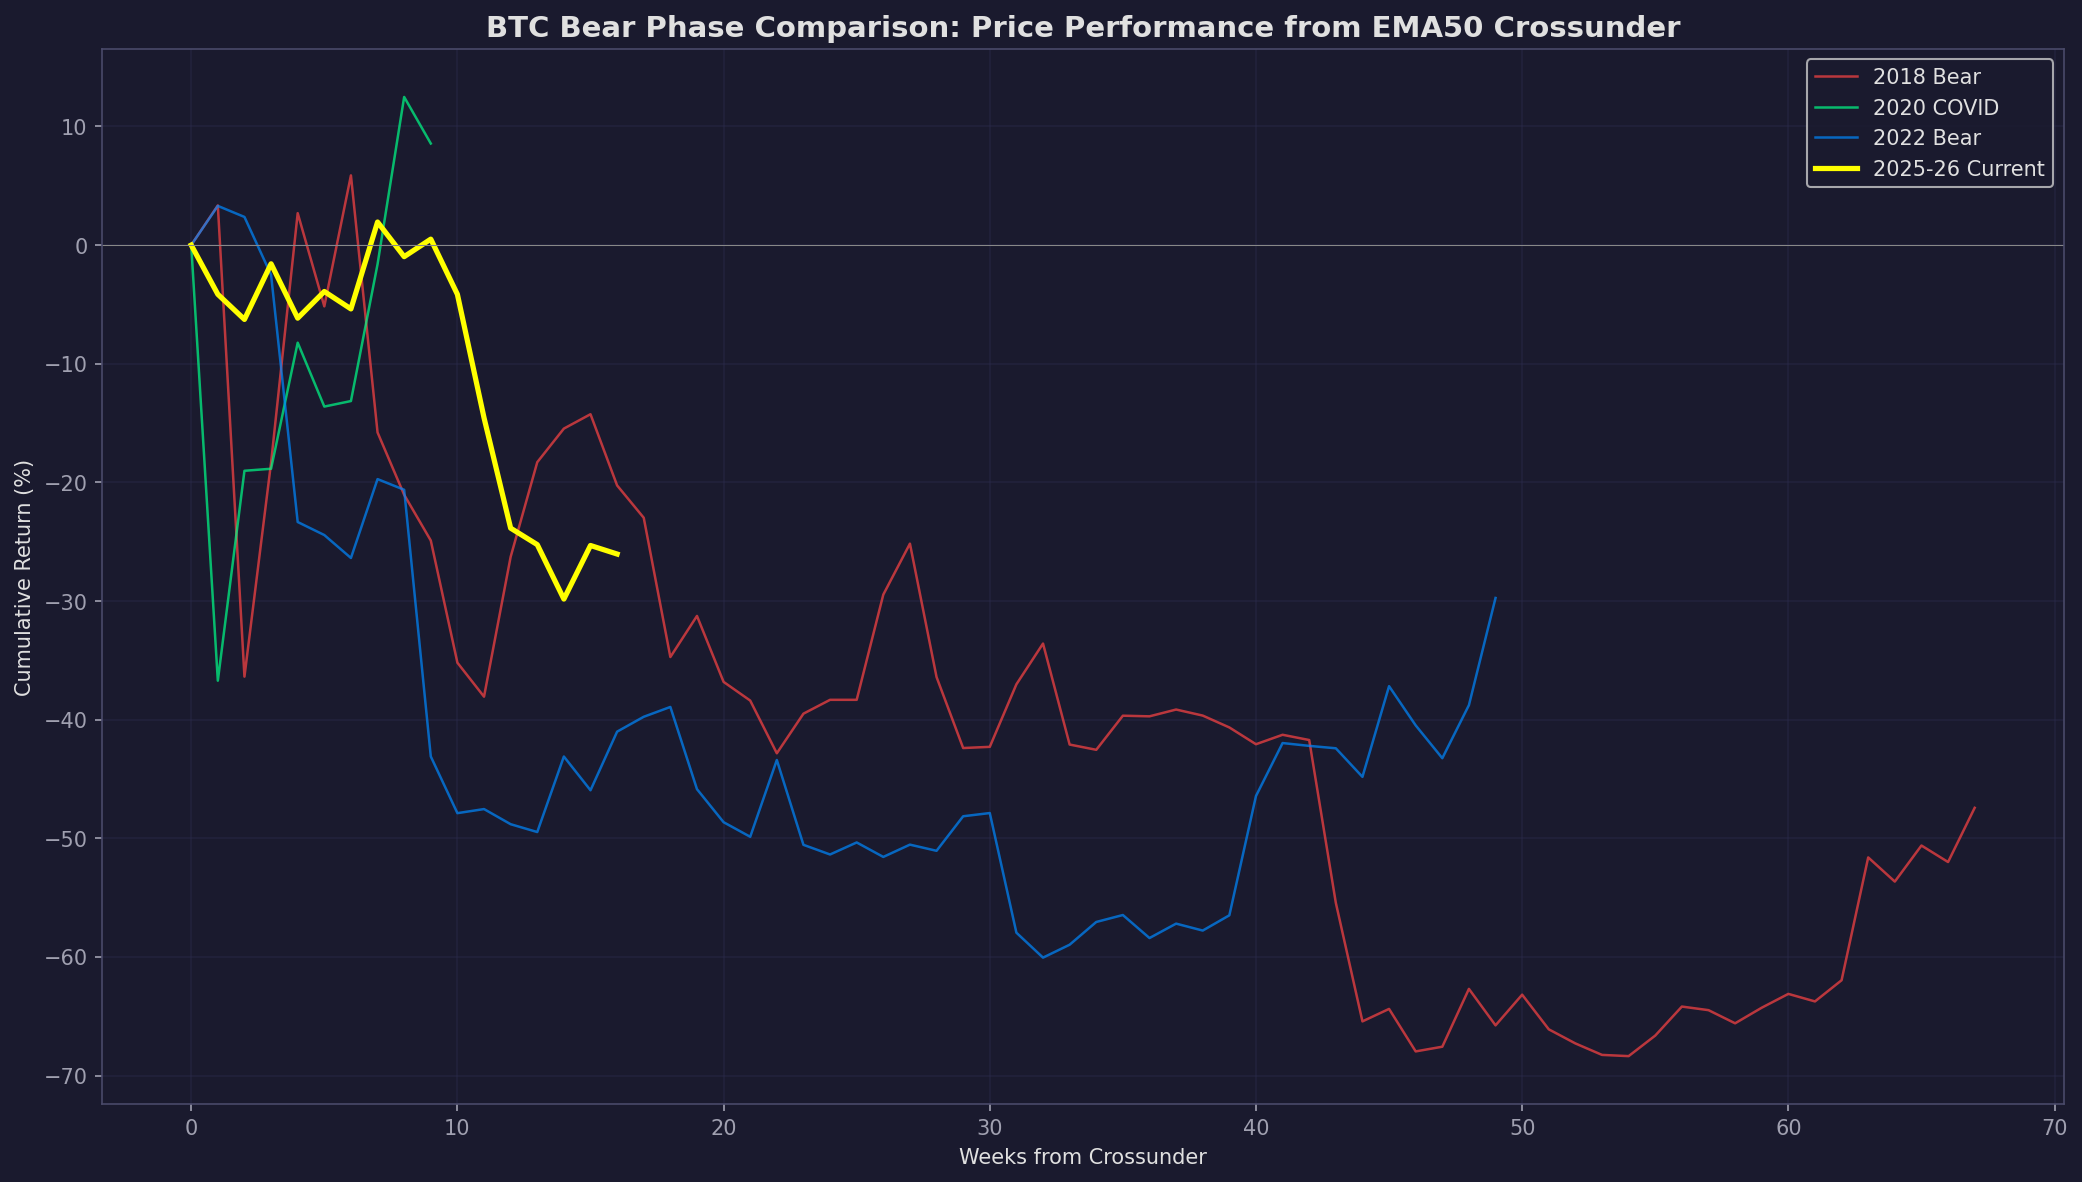
I identified all weeks where BTC was 15-40% below the 50-week EMA with RSI below 40 and drawdown exceeding 30%. These clustered into 6 distinct episodes:
| Episode | Date Range | Entry Close | Avg % from EMA50 | Avg RSI | Max DD |
|---|---|---|---|---|---|
| 1. 2018 Bear Phase | Apr-Aug 2018 | $8,059 | -34.4% | 37.6 | -64.4% |
| 2. 2019 Accumulation | Feb-Mar 2019 | $3,916 | -37.3% | 37.9 | -78.8% |
| 3. 2020 COVID Crash | Mar 2020 | $5,014 | -39.0% | 30.3 | -71.7% |
| 4. 2022 Jan Correction | Jan 2022 | $36,654 | -17.5% | 38.6 | -46.7% |
| 5. 2022 Bear Market | May 2022-Jan 2023 | $30,297 | -34.0% | 37.0 | -76.1% |
| 6. 2026 Current | Feb-Mar 2026 | $78,689 | -25.5% | 30.6 | -48.8% |
4.2 What Happened Next?
| Episode | Reached 50w EMA? | How Long? | How? | Outcome |
|---|---|---|---|---|
| 2018 Bear | Yes | 68 weeks | EMA fell 50% to price | Price went much lower first |
| 2019 Accumulation | Yes | 12 weeks | Price rallied 100% | True bottom + V-recovery |
| 2020 COVID | Yes | 7 weeks | Price rallied 78% | V-recovery (exogenous shock) |
| 2022 Jan | Yes | 11 weeks | Price rallied 29% | Reclaimed then FAILED -- led to 76% DD |
| 2022 Bear | Yes | 45 weeks | EMA fell 42% to price | Slow grind, no price rally |
4.3 The Critical Distinction: Rally-to-EMA vs EMA-Falls-to-Price
This is the most important finding. When BTC reclaimed the 50-week EMA from deep below, the mechanics fell into two distinct patterns:
| Case | Price Move | EMA50 Move | Who Closed the Gap? |
|---|---|---|---|
| 2019 (success) | +100% | -8% | Price (88%) |
| 2020 COVID (success) | +72% | -3% | Price (95%) |
| 2022 deep bear | -8% | -42% | EMA declined (88%) |
There is no historical case where BTC gradually rallied from 25% below the 50-week EMA to reach it in a measured, organic way over 8-16 weeks. The only two genuine price-driven reclaims (2019 and 2020) were explosive V-recoveries with specific catalysts. The 2022 deep bear "reclaim" took 45 weeks and happened because the EMA fell to meet the price.
The thesis of a "relief rally back to the 50-week EMA" implies a gradual, organic rally of approximately 34% -- something that has literally never happened in BTC's history from this depth. It either V-recovers (catalyst-driven) or the EMA slowly descends over 6-12 months.
5. Relief Rally Statistics
5.1 All Relief Rally Attempts from >20% Below 50w EMA
| Low Date | Low Close | Low %EMA50 | Peak %EMA50 | Rally % | Weeks | Hit EMA50? |
|---|---|---|---|---|---|---|
| 2018-02-05 | $6,955 | -47.6% | -10.0% | 66.4% | 4 | NO |
| 2018-04-09 | $6,771 | -43.4% | -18.6% | 38.4% | 4 | NO |
| 2018-06-25 | $6,249 | -40.4% | -17.4% | 30.9% | 5 | NO |
| 2018-08-13 | $6,298 | -34.7% | -22.2% | 15.3% | 3 | NO |
| 2018-09-10 | $6,330 | -31.3% | -24.0% | 0.7% | 9 | NO |
| 2018-10-29 | $6,333 | -25.9% | -24.0% | 0.6% | 2 | NO |
| 2018-12-10 | $3,503 | -54.7% | -38.5% | 10.9% | 11 | NO |
| 2019-01-28 | $3,470 | -48.6% | -7.1% | 55.6% | 12 | NO |
| 2019-03-04 | $3,762 | -39.4% | +45.2% | 134.1% | 12 | YES |
| 2020-03-16 | $5,014 | -39.0% | +24.1% | 102.8% | 11 | YES |
| 2022-05-23 | $29,099 | -30.0% | -22.9% | 9.0% | 1 | NO |
| 2022-06-20 | $20,600 | -47.6% | -30.2% | 17.2% | 8 | NO |
| 2022-09-05 | $19,812 | -40.0% | -29.1% | 4.0% | 9 | NO |
| 2022-09-26 | $19,223 | -39.1% | -29.1% | 7.2% | 6 | NO |
| 2022-11-21 | $15,787 | -43.8% | -8.5% | 45.3% | 9 | NO |
| 2022-12-19 | $16,440 | -37.7% | +0.2% | 51.0% | 9 | YES |
| 2026-02-23 | $64,617 | -30.6% | -25.3% | 5.4% | 2 | NO |
Success rate: 3 of 17 (18%). Of the 14 failed attempts, the median rally was 15.3%.
5.2 Relief Rally Magnitude Statistics
| Metric | All Rallies | Failed Only | Successful Only |
|---|---|---|---|
| Count | 17 | 14 | 3 |
| Mean | 35.0% | 21.5% | 96.0% |
| Median | 17.2% | 13.1% | 102.8% |
| Min | 0.6% | 0.6% | 51.0% |
| Max | 134.1% | 66.4% | 134.1% |
| Avg weeks to peak | 6.9 | 6.0 | 10.7 |
The distribution is extremely bimodal: either the rally is a 50-130% explosive move (successful EMA reclaim) or it is a 0-40% bounce that fails. There is no middle ground.
6. Mean Reversion Analysis: Forward Returns by EMA50 Distance
| Bucket | 4w Mean | 8w Mean | 12w Mean | 26w Mean | 4w Win% | N |
|---|---|---|---|---|---|---|
| -60% to -40% | +7.9% | +6.3% | +14.5% | +86.3% | 73% | 26 |
| -40% to -30% | +4.6% | +10.6% | +17.1% | +29.7% | 58% | 43 |
| -30% to -20% | -13.8% | -16.2% | -15.6% | -17.3% | 19% | 27 |
| -20% to -10% | +2.3% | +2.2% | +3.0% | -4.9% | 65% | 26 |
| -10% to 0% | +7.3% | +17.6% | +17.1% | +29.3% | 66% | 44 |
The current zone (-30% to -20%) has the worst forward returns of any bucket. This is not a coincidence -- it represents the "transit zone" of active bear markets. Price typically passes through this zone on the way to deeper lows. The 19% win rate at 4 weeks is the lowest of any bucket.
This is the single most damaging finding for the relief rally thesis.
7. EMA50 Reclaim Probabilities by Depth and Horizon
| Depth from EMA50 | 8 weeks | 12 weeks | 26 weeks | 52 weeks |
|---|---|---|---|---|
| -40% to -30% | 14% | 30% | 55% | 89% |
| -30% to -20% | 10% | 10% | 17% | 79% |
| -20% to -15% | 22% | 33% | 33% | 44% |
| -15% to -10% | 53% | 53% | 53% | 59% |
From the current depth (-25% = within the -30% to -20% bucket), the probability of reaching the 50-week EMA within 12 weeks is 10% (3 out of 29 instances). Even at 26 weeks (6 months), only 17% of instances saw a reclaim. The 79% at 52 weeks largely reflects EMA convergence (the EMA falling to meet price), not price rallying.
8. Bounce Probability Analysis
8.1 Upside Probabilities (from >15% below 50w EMA)
| Bounce Size | 4 weeks | 8 weeks | 12 weeks | 26 weeks |
|---|---|---|---|---|
| 10%+ | 45% | 59% | 63% | 72% |
| 20%+ | 25% | 38% | 42% | 57% |
| 30%+ | 11% | 22% | 29% | 44% |
| 50%+ | 1% | 8% | 19% | 36% |
There is a reasonable probability (45-63%) of a 10%+ bounce within 4-12 weeks. A 20%+ bounce (which would take BTC to ~$82K) has a 38-42% probability over 8-12 weeks. However, reaching the 50-week EMA requires approximately a 34% rally, which has only a 22-29% probability over 8-12 weeks.
8.2 Downside Risk (from current conditions)
From similar setups (20-30% below EMA50, RSI < 35), the historical probability of a 10%+ further decline within 12 weeks is 33%. This is a meaningful risk that offsets the bounce thesis.
9. Bullish Factors (Evidence Supporting a Bounce)
9.1 200-Week EMA Support
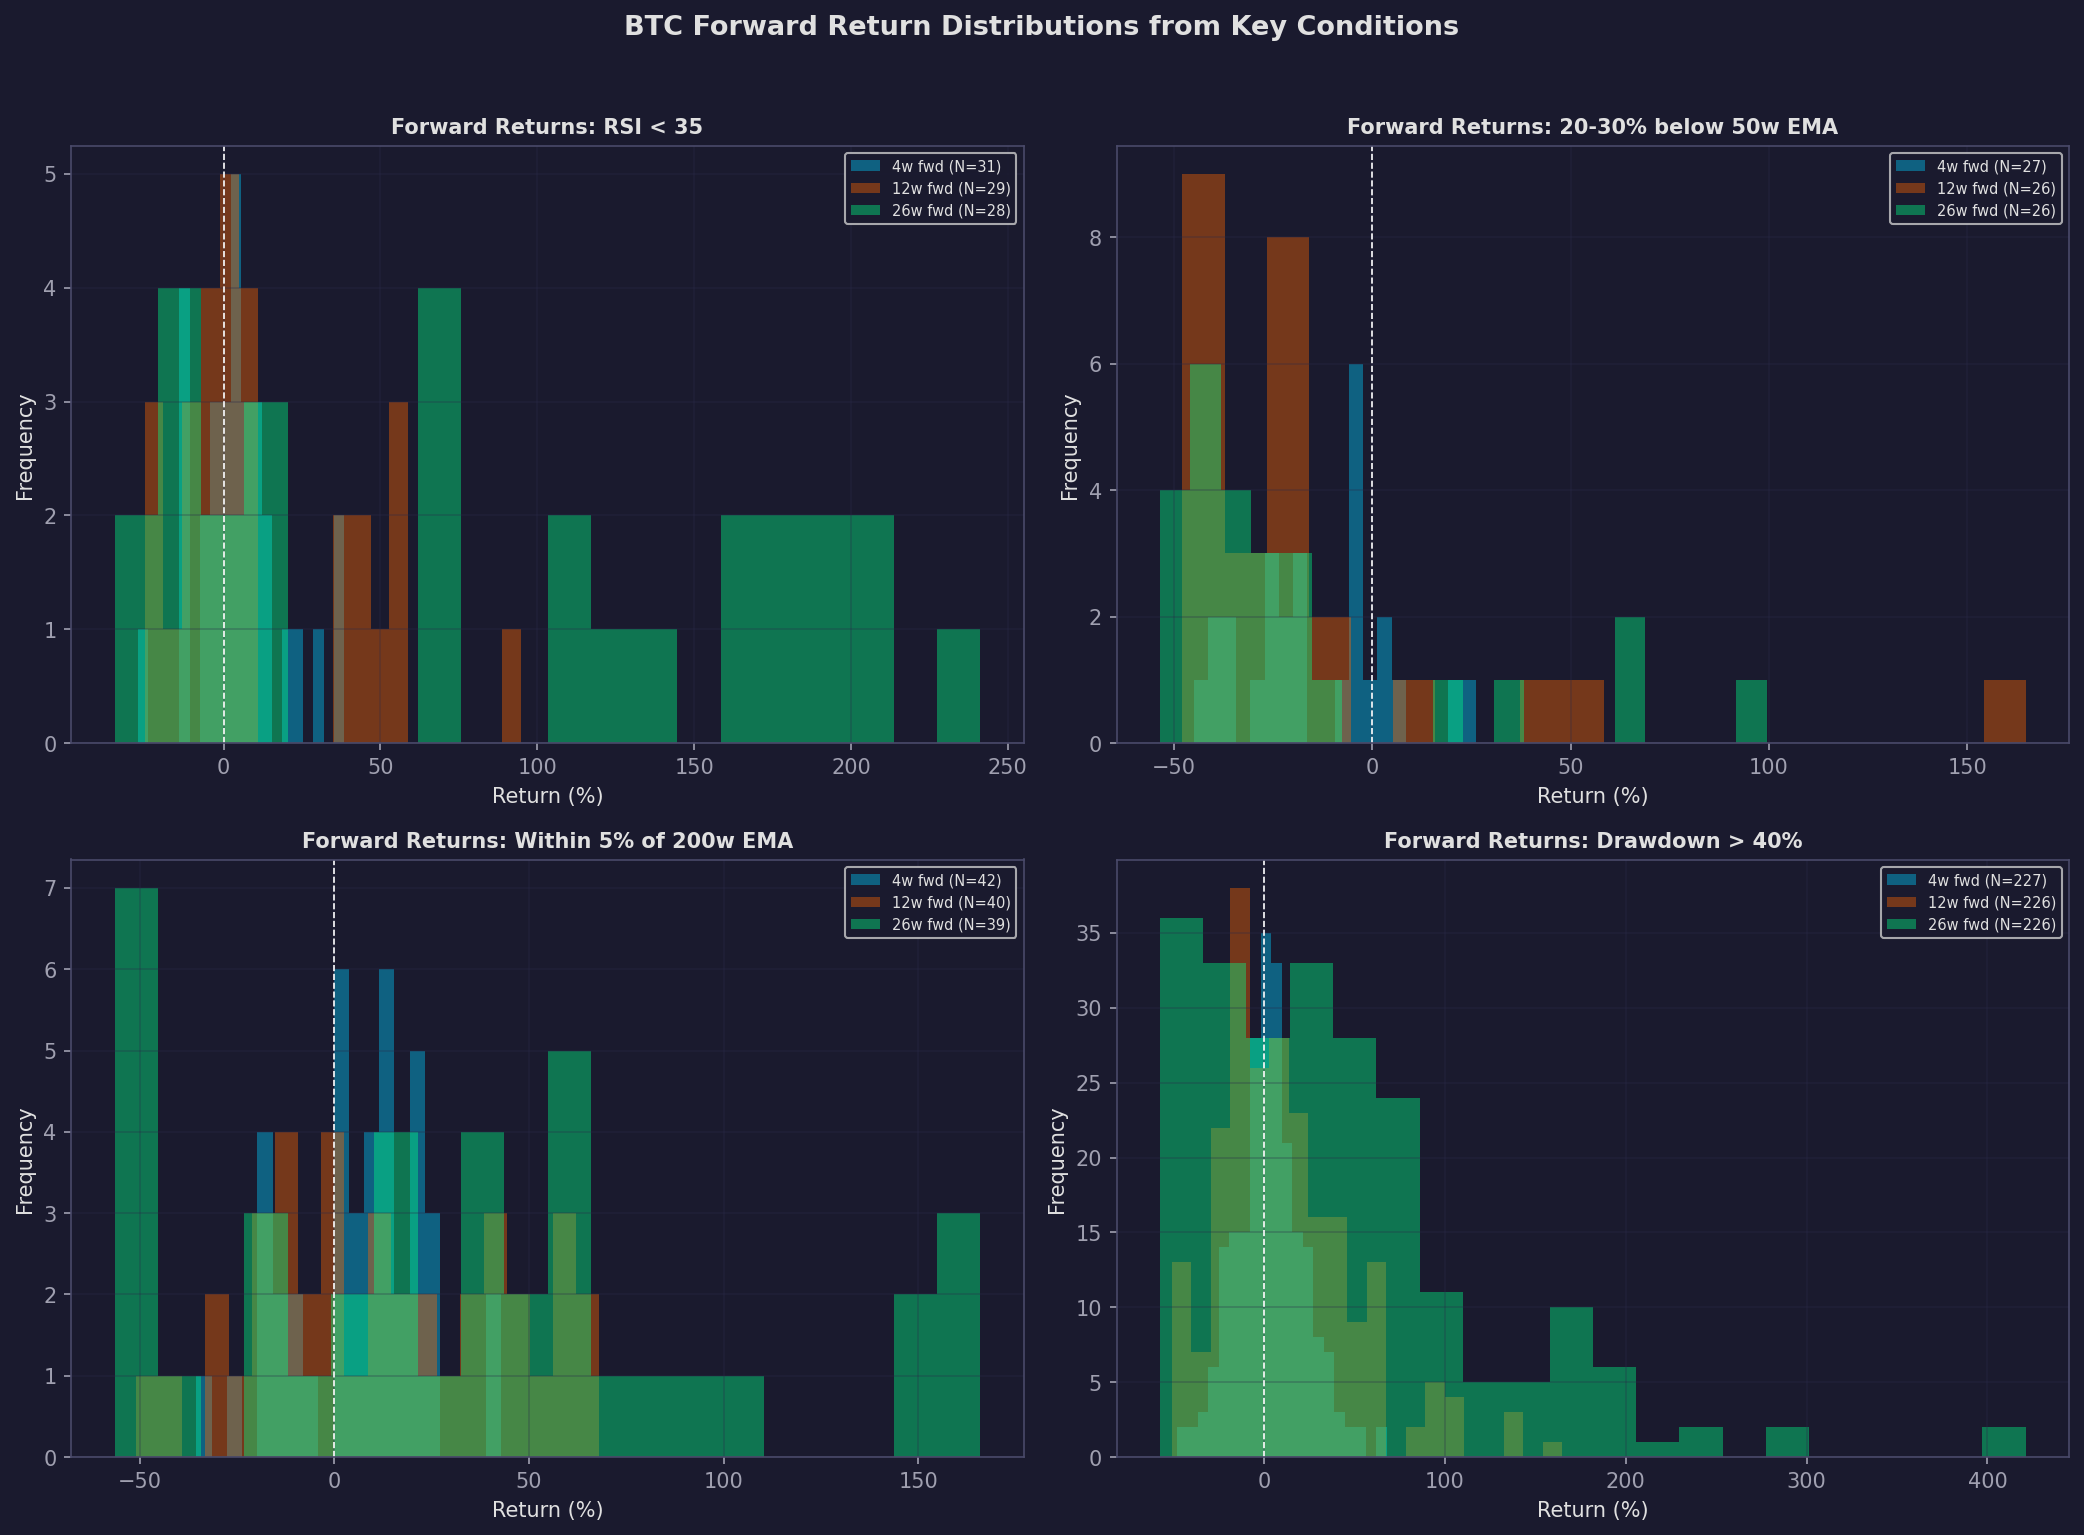
BTC is within 0.7% of the 200-week EMA ($68,586). Historically, the 200-week EMA has been the most important long-term support level. Forward returns from within 5% of the 200-week EMA:
| Horizon | Mean Return | Median | Win Rate | N |
|---|---|---|---|---|
| 4 weeks | -0.8% | -1.1% | 47% | 38 |
| 8 weeks | +5.7% | +11.8% | 59% | 37 |
| 12 weeks | +7.2% | +7.3% | 57% | 37 |
| 26 weeks | +71.9% | +58.7% | 70% | 37 |
The 200-week EMA is not a reliable short-term (4-week) support but becomes increasingly bullish at 8+ week horizons. The 26-week mean of +71.9% is heavily influenced by the 2020 and 2023 recoveries.
9.2 Weekly RSI Oversold
RSI at 31.8 is in oversold territory. Forward returns from weekly RSI < 35:
| Horizon | Mean Return | Win Rate | t-statistic | p-value |
|---|---|---|---|---|
| 4 weeks | +5.0% | 65% | - | - |
| 8 weeks | +8.1% | 69% | - | - |
| 12 weeks | +12.9% | 55% | 2.30 | 0.029 |
| 26 weeks | +85.2% | 71% | - | - |
The 12-week forward return from weekly RSI < 35 is statistically significantly positive (p = 0.029, 95% CI: +2.1% to +23.6%). However, the wide confidence interval and high variance (std = 29.5%) mean individual outcomes are unpredictable.
9.3 MACD Histogram Divergence
Price made a lower low on Feb 23 ($64,617 vs. prior low) while the MACD histogram made a higher low (-2,955 vs. -3,161). This is a textbook bullish divergence on the weekly timeframe. The histogram has been improving for 2 consecutive weeks.
9.4 Selling Volume Exhaustion
Down-week volume has been declining during the selloff (negative slope of -24.6B per week on down bars), suggesting selling pressure is diminishing. However, the up/down volume ratio over the last 4 weeks remains poor at 0.56 (more volume on down weeks than up weeks).
10. Bearish Factors and Failure Cases
10.1 The -30% to -20% "Transit Zone" Problem
The single most important finding against the thesis: the -30% to -20% below EMA50 bucket has historically been the worst zone for forward returns. The 4-week mean return is -13.8% with only a 19% win rate. This zone predominantly captures weeks in the middle of bear markets, not near bottoms.
10.2 No Accumulation Base
Successful EMA50 reclaims from deep below (2019, 2020) shared a key characteristic: either an extended accumulation base (2019: 3+ months of bottoming) or a V-recovery from an exogenous shock (2020 COVID). The current setup shows neither:
- Price made a new low on Feb 23, only 2 weeks ago
- No clear double-bottom or base formation
- The bounce from $64,617 to $68,113 (+5.4%) is within the range of typical failed bounces (0.6% to 66.4%, median 15.3%)
10.3 Duration Concern
At 16 weeks below the 50-week EMA, the current episode is longer than most quick recoveries (which took 1-11 weeks) but much shorter than the deep bears (45-68 weeks). This puts it in an ambiguous zone.
10.4 2022 Jan Analog (Most Dangerous)
The closest historical analog to the current setup is January 2022:
| Factor | 2022 Jan | 2026 Current |
|---|---|---|
| Distance from EMA50 | -17.5% | -25.3% |
| RSI | 38.6 | 31.8 |
| Drawdown from ATH | -46.7% | -46.0% |
| Weeks below EMA50 | 2 | 16 |
In 2022, BTC successfully reclaimed the 50-week EMA in 11 weeks -- then collapsed to a 76% total drawdown. The reclaim was a bull trap. This is the primary risk scenario: even if BTC does bounce toward the EMA50, the reclaim itself may be a selling opportunity, not confirmation of a new uptrend.
10.5 Gap Arithmetic
To reach the current 50-week EMA ($91,194), BTC needs to rally 34% from $68,113. Historical analysis shows:
| Scenario | EMA50 in N Weeks | Rally Needed |
|---|---|---|
| Price stays flat | $88K in 4 weeks | +29% |
| Price stays flat | $82K in 12 weeks | +21% |
| Price stays flat | $76K in 26 weeks | +12% |
| 3% weekly rally | Reclaim in 9 weeks | +30% cumulative |
Even with a sustained 3% per week rally (aggressive by any standard), it would take 9 weeks to reclaim the EMA50. A more realistic 1-2% weekly gain would take 15-25+ weeks, by which time the EMA50 will have declined substantially. In this scenario, the "reclaim" is largely the EMA falling to meet price -- not the rally-to-EMA thesis.
11. Specific Levels to Watch
| Level | Price | Significance |
|---|---|---|
| 200-week EMA | $68,586 | Critical long-term support. Currently being tested. A weekly close below this is extremely bearish. |
| Recent low | $64,617 | Feb 23 low. If broken, invalidates any near-term bounce thesis. |
| $60,000 | $60,000 | Psychological support and potential next target if 200w EMA fails. |
| 20-week EMA | $84,399 | First major resistance. A rally to here (+24%) would be a significant bounce. |
| 50-week EMA | $91,194 | The thesis target. Currently declining at ~$800/week. |
| 100-week EMA | $84,393 | Confluent with 20-week EMA -- this zone (~$84K) is more realistic rally target. |
12. Probabilistic Assessment
Base Case (45% probability): Sideways Grind / Failed Bounce
BTC bounces 10-20% from current levels (to $75-82K range), fails to reach the 50-week EMA, and either retests the lows or establishes a trading range. This is the most common historical outcome from this position. The 50-week EMA gradually declines to meet price over 6-12 months.
Bull Case (25% probability): Meaningful Rally Toward 50w EMA
A catalyst (macro shift, ETF flows, regulatory clarity) drives a V-shaped recovery. BTC rallies 25-35% over 8-12 weeks, reaching the 50-week EMA zone. Even in this case, the 2022 Jan analog warns that the first reclaim may fail.
Bear Case (30% probability): Continued Decline
The 200-week EMA fails to hold and BTC drops below $60K, entering a deeper bear phase. The -30% to -20% zone's historically negative forward returns support this scenario. Further downside of 20-30% would be consistent with the 2018 and 2022 bear patterns.
13. Conclusions
-
A bounce from current levels is probable -- weekly RSI below 35 has statistically significant positive 12-week forward returns (mean +12.9%, p = 0.029). The 200-week EMA provides structural support.
-
A bounce is not the same as a rally to the 50-week EMA. From 25% below the EMA50, the probability of reaching it within 12 weeks is only 10%. The median bounce from this depth is approximately 17% -- which would take BTC to ~$80K, still 12-14% below the 50-week EMA.
-
The -30% to -20% below EMA50 zone has historically the worst forward returns of any distance bucket, with a 19% 4-week win rate and mean returns of -13.8%. This zone is a transit area during bear markets.
-
The only genuine price-driven EMA50 reclaims from this depth were V-shaped explosions (2019: +100%, 2020: +78%) driven by specific catalysts. No historical case shows a gradual, organic rally closing a 25%+ gap.
-
The 200-week EMA ($68,586) is the critical level. If this holds, it supports the bounce case. If it breaks on a weekly close, the bear case probability increases significantly.
-
Even a successful EMA50 reclaim carries risk. The 2022 January analog shows a reclaim can be a bull trap preceding a much deeper decline.
-
The honest assessment: The data supports expecting a bounce of 10-20% from oversold conditions at the 200-week EMA, but does not support the specific thesis of a rally back to the 50-week EMA. That target requires either a V-recovery catalyst or 6+ months of price consolidation while the EMA declines.
14. Limitations
-
Small sample size. BTC has only experienced 5-6 distinct bear episodes in the data period. Any pattern recognition from N=3-5 episodes is inherently fragile and likely overfit.
-
Regime dependence. BTC's market structure has changed dramatically (ETF launch in 2024, institutional adoption, macro correlation shifts). Historical patterns from 2018-2019 may not apply to 2026.
-
Survivorship in 200-week EMA analysis. The 200-week EMA has "always" held for BTC because BTC has never had a true existential crisis in the data period. This does not guarantee future support.
-
Forward return distributions are fat-tailed. Mean returns are heavily influenced by outliers (the 2020-2021 bull run distorts 26-week averages). Medians are more reliable but still noisy.
-
No macro/fundamental overlay. This analysis is purely technical/statistical. Macro conditions (M2, rate policy, USD strength) could shift the distribution of outcomes.
-
Transit zone bias. The -30% to -20% bucket's negative returns may partly reflect the fact that most observations are concentrated in the 2018 bear -- a single prolonged event that dominates the statistics.
Charts
All charts saved to analysis/quant-research/charts/:
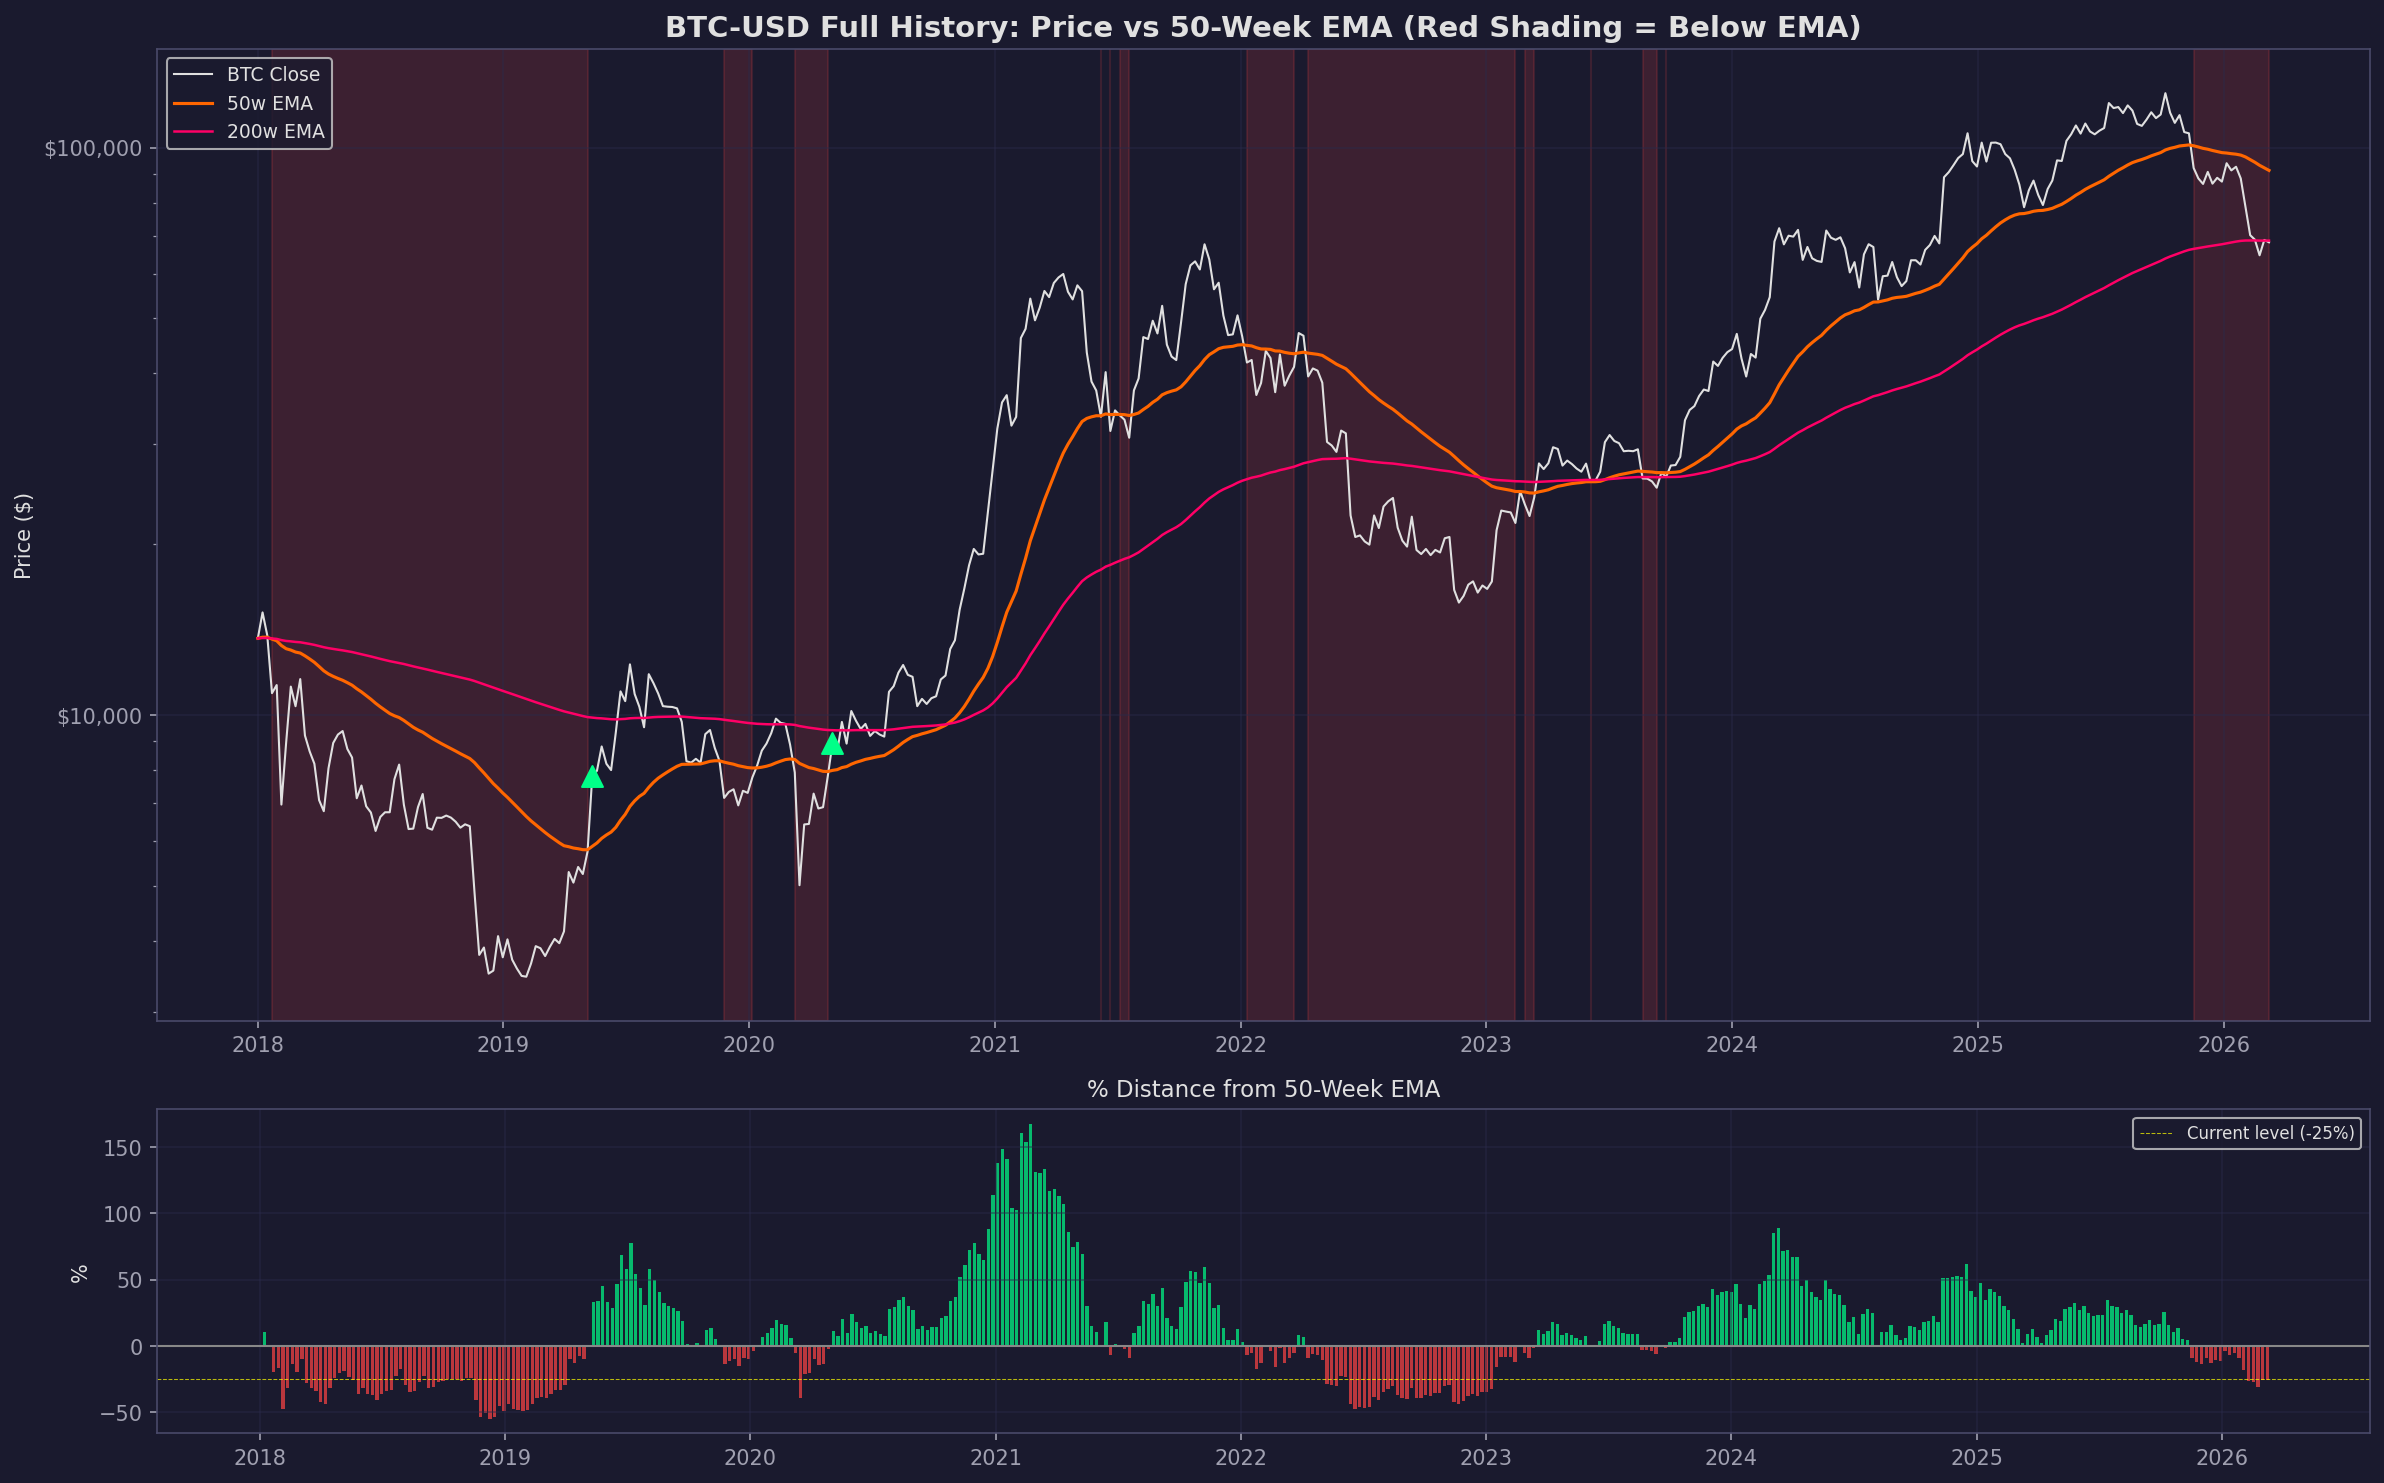
btc-relief-rally-ema-positioning.png-- Current BTC price vs weekly EMAs (20/50/100/200), RSI, and % distance from 50-week EMAbtc-relief-rally-historical-context.png-- Full history BTC vs 50-week EMA with below-EMA periods shadedbtc-relief-rally-forward-returns.png-- Forward return distributions from key conditions (RSI<35, near 200w EMA, deep below 50w EMA, >40% drawdown)btc-relief-rally-bear-comparison.png-- Current decline trajectory compared to 2018, 2020, and 2022 bear phases
Analysis script: analysis/quant-research/scripts/btc-relief-rally-thesis-2026-03-04.py
Prior related research: analysis/quant-research/bear-market-relief-rally-research-2026-02-25.md
Charts