BTC DCA Strategy During Drawdowns — Quantitative Research
BTC DCA Strategy During Drawdowns — Quantitative Research
| Field | Value |
|---|---|
| Date | 2026-03-06 |
| Researcher | Quant Researcher (Claude Opus 4.6) |
| Status | Complete |
| Script | scripts/btc-dca-strategy-drawdowns-2026-03-06.py |
| Charts | charts/btc_dca_strategy_drawdowns_zones.png, charts/btc_dca_strategy_drawdowns_comparison.png, charts/btc_dca_strategy_drawdowns_ladder.png, charts/btc_dca_strategy_drawdowns_tranches.png |
1. Hypothesis
Can we identify an optimal DCA strategy for accumulating BTC during bear market drawdowns, and if so, which combination of trigger mechanism, tranche count, and position sizing curve maximizes risk-adjusted cost basis?
Sub-hypotheses tested:
- H1: Drawdown-triggered DCA produces a lower average cost basis than fixed-interval DCA.
- H2: Back-loaded / exponential position sizing (buying more at deeper drawdowns) outperforms equal-weight tranches.
- H3: Mayer Multiple zones provide better entry signals than raw drawdown percentage.
- H4: 5 tranches is the optimal number (balancing deployment depth with granularity).
- H5: Technical confirmation signals (RSI, volume, Mayer Multiple) improve entry timing within drawdown zones.
2. Data
| Source | Ticker | Date Range | Rows | Notes |
|---|---|---|---|---|
| Local OHLCV | BTC-USD | 2018-01-01 to 2026-03-06 | 2,987 | Daily OHLCV |
| Local OHLCV | FBTC | 2024-01-11 to 2026-03-05 | 538 | Fidelity BTC ETF |
BTC/FBTC ratio: Computed from 538 overlapping trading days. 30-day average = 1147.03 (std = 8.22). Full-overlap average = 1145.77 (std = 10.77). The ratio is stable enough for price-level mapping.
Current state (2026-03-06):
| Metric | Value |
|---|---|
| BTC Price | $70,123 |
| ATH | $124,753 |
| Drawdown from ATH | -43.8% |
| Mayer Multiple | 0.731 |
| 200-Day MA | $95,905 |
| 200-Week MA | $58,592 |
| 200-Week MA Premium | +19.7% |
Bear market periods tested: - 2018 Bear: 2018-01-01 to 2019-03-31 (ATH ~$19,800, trough ~$3,200, -84%) - 2022 Bear: 2022-01-01 to 2023-03-31 (ATH ~$69,000, trough ~$15,500, -77%) - Current: 2025-01-01 to 2026-03-06 (ATH $124,753, current $70,123, -44%)
3. Methodology
3.1 Drawdown Zone Forward Return Analysis
Binned all BTC trading days by drawdown-from-ATH into 10% increments. Computed mean forward returns (30d, 90d, 180d, 365d) and win rates for each zone. This establishes the statistical edge available at each drawdown level.
3.2 Mayer Multiple Zone Analysis
Same approach using Mayer Multiple (Price / 200-day MA) zones. Six bins from < 0.6 through > 2.4. Cross-referenced with drawdown zones to identify which metric provides cleaner signal separation.
3.3 200-Week MA Proximity Analysis
Segmented history by premium/discount to the 200-week moving average, a widely-watched long-term cycle level. Evaluated forward returns by proximity zone.
3.4 DCA Strategy Backtests
Simulated 7 strategies across both bear markets with $10,000 normalized capital:
- Fixed Weekly — $192/week every Monday for 1 year
- Fixed Monthly — $833/month on first trading day
- Drawdown-Triggered Equal Weight (5 tranches) — $2,000 at each of -20%, -30%, -40%, -50%, -60% drawdown
- Drawdown-Triggered Exponential (5 tranches) — Weights 1/2/4/8/16 at same levels (back-loaded)
- Drawdown-Triggered Front-Loaded (5 tranches) — Weights 5/4/3/2/1 (front-loaded)
- Mayer Multiple Triggered (5 tranches) — Weights 1/2/3/4/5 at MM 1.0/0.9/0.8/0.7/0.6 (back-loaded)
- Volatility-Adjusted Weekly — Weekly DCA scaled by drawdown depth (0.5x near ATH, 3x at -50%+ DD)
Metrics: average cost basis, number of buys, capital deployed, return to subsequent cycle peak.
3.5 Tranche Count Optimization
Tested 3 to 7 tranches with equal, exponential, and back-loaded weighting across both bear markets. Entry levels spaced linearly from -15% to -65% drawdown.
3.6 Signal Confirmation Analysis
Evaluated RSI < 30, volume > 2x average, Mayer Multiple < 0.8, and drawdown < -40% as confirmation signals. Measured precision (% of signal days that preceded >50% 180-day returns) and recall (% of good entries captured).
4. Results
4.1 Drawdown Zone Forward Returns
The deeper the drawdown, the stronger the forward returns -- but the relationship is non-linear with a significant jump at the -40% threshold.
| Zone | Days | % History | 30d Fwd | 90d Fwd | 180d Fwd | 365d Fwd |
|---|---|---|---|---|---|---|
| 0-10% | 528 | 17.7% | +3.7% | +9.5% | +6.5% | +22.0% |
| 10-20% | 286 | 9.6% | +3.7% | +12.1% | +24.5% | +38.3% |
| 20-30% | 249 | 8.3% | +3.8% | +22.7% | +31.2% | +29.5% |
| 30-40% | 332 | 11.1% | +1.9% | +25.6% | +73.4% | +79.5% |
| 40-50% | 449 | 15.0% | -0.3% | +8.2% | +46.4% | +114.3% |
| 50-60% | 436 | 14.6% | +2.3% | +2.7% | +9.7% | +113.2% |
| 60-70% | 416 | 13.9% | +5.7% | +6.7% | +19.8% | +123.1% |
| 70-80% | 272 | 9.1% | +9.9% | +47.0% | +97.2% | +112.4% |
Key findings: - The -40% drawdown level is the inflection point. Below -40%, 365-day forward returns jump from +79% to +114% and remain above +110% through -80%. - Win rates at 365d: 55% at -40 to -50%, then 81% at -50 to -60%, 97% at -60 to -70%, and 100% at -70 to -80%. Once BTC drops 60%+ from ATH, buying has never produced a negative 1-year return in the data. - Short-term pain is real. At -40 to -50% drawdown, 30-day forward returns average -0.3% (negative). Accumulation at these levels requires tolerance for continued decline. - Current position (-43.8%) sits right in the zone where long-term value is strong but short-term drawdown risk remains elevated.
4.2 Mayer Multiple Zone Returns
| Zone | Days | % History | Avg Price | 180d Fwd | 365d Fwd |
|---|---|---|---|---|---|
| MM > 2.4 | 24 | 0.9% | $45,374 | -11.6% | -9.1% |
| MM 1.5-2.4 | 291 | 10.4% | $35,600 | +8.3% | +27.9% |
| MM 1.0-1.5 | 1,269 | 45.5% | $50,280 | +55.5% | +116.5% |
| MM 0.8-1.0 | 709 | 25.4% | $36,872 | +22.1% | +95.2% |
| MM 0.6-0.8 | 438 | 15.7% | $23,026 | +52.3% | +97.2% |
| MM < 0.6 | 57 | 2.0% | $14,101 | +40.3% | +99.7% |
Key findings: - MM < 0.8 (the traditional "oversold" threshold) delivers +95% to +100% 365-day returns. The current Mayer Multiple of 0.731 sits squarely in the high-value MM 0.6-0.8 zone. - MM 1.0-1.5 is actually the best 365d return zone (+116.5%), but this is heavily influenced by accumulation periods that preceded major bull runs. The key insight: buying at MM < 1.0 captures the beginning of recovery, which compounds into the full bull cycle. - MM < 0.6 is extremely rare (57 days, 2.0% of history). It signals deep capitulation but the sample size is small.
4.3 200-Week MA Proximity
| Zone | Days | % History | 180d Fwd | 365d Fwd |
|---|---|---|---|---|
| Below 200W MA | 495 | 19.1% | +66.2% | +166.8% |
| 0-25% above | 431 | 16.7% | +44.9% | +165.5% |
| 25-50% above | 332 | 12.8% | +99.1% | +162.0% |
| 50-100% above | 511 | 19.7% | +42.2% | +71.3% |
| 100%+ above | 819 | 31.6% | -3.4% | -15.3% |
Key finding: Buying at or below the 200-week MA produces the strongest long-term returns. BTC is currently +19.7% above the 200W MA ($58,592), placing it in the 0-25% zone which historically delivers +165.5% at 365d. The 200W MA itself ($58,592 = FBTC ~$51.08) represents a key structural support level.
4.4 Strategy Comparison Across Bear Markets
| Strategy | 2018 Avg Cost | 2022 Avg Cost | 2018 Peak Return | 2022 Peak Return |
|---|---|---|---|---|
| Fixed Weekly | $6,937 | $24,997 | +1,698% | +399% |
| Fixed Monthly | $9,955 | $38,634 | +1,153% | +223% |
| DD Equal (5T) | $9,521 | $35,639 | +1,210% | +250% |
| DD Exp Scaling (5T) | $7,926 | $29,933 | +1,474% | +317% |
| DD Front-Loaded (5T) | $10,689 | $39,828 | +1,067% | +213% |
| Mayer Triggered (5T) | $4,888 | $29,764 | +2,452% | +319% |
| Vol-Adj Weekly | $8,447 | $33,936 | +1,377% | +268% |
Key findings:
-
Mayer Multiple Triggered produced the lowest average cost basis in 2018 ($4,888, yielding +2,452% to peak) and was effectively tied for best in 2022 ($29,764). This is because MM-based triggers naturally wait for price to fall below the 200-day MA, avoiding premature entry during the early phases of a bear market.
-
Fixed Weekly DCA produced the lowest cost basis in 2022 ($24,997). This seems counterintuitive -- it outperformed the sophisticated strategies because it deployed capital gradually throughout the entire bear, including the deepest trough. The drawdown-triggered strategies deployed large tranches early (at -20%) and had less capital for the bottom.
-
Front-loaded sizing consistently underperformed. Deploying more capital at shallow drawdowns (5/4/3/2/1 weights) produced the worst cost basis in both bears. This confirms H2: back-loaded sizing is superior.
-
Exponential scaling worked well but was outperformed by Mayer triggers because the Mayer Multiple is a better proxy for "how oversold" than raw drawdown percentage.
4.5 Optimal Tranche Count
| Config | 2018 Peak Return | 2022 Peak Return | Average |
|---|---|---|---|
| 3T-exponential | +1,547% | +352% | +950% |
| 4T-exponential | +1,572% | +347% | +960% |
| 5T-exponential | +1,604% | +362% | +983% |
| 6T-exponential | +1,689% | +361% | +1,025% |
| 7T-exponential | +1,697% | +371% | +1,034% |
Finding on H4: More tranches is marginally better for average cost basis because it spreads entries deeper into the drawdown. However, the improvement from 5 to 7 tranches is small (+983% to +1,034% average peak return). Meanwhile, more tranches means deeper drawdown levels that may never be reached (2022 bottomed at -77%, not -80%+). 5 tranches is the practical optimum -- enough granularity to capture the full range of historical bear markets without requiring extreme drawdowns that may not occur.
For back-loaded weighting specifically:
| Config | 2018 Avg Cost | 2022 Avg Cost |
|---|---|---|
| 3T-back | $7,900 | $28,676 |
| 5T-back | $8,132 | $30,008 |
| 7T-back | $8,106 | $30,983 |
The cost basis is remarkably stable across tranche counts when using back-loaded weighting. The critical factor is not "how many tranches" but "how much capital deploys at the deepest levels."
4.6 Signal Confirmation Quality
| Signal | Precision | Recall | Assessment |
|---|---|---|---|
| RSI < 30 | 27.1% | 12.1% | Low recall -- misses most good entries |
| Volume > 2x avg | 38.6% | 2.2% | Highest precision but extremely rare |
| Mayer < 0.8 | 34.7% | 21.9% | Moderate -- persistent state, not point signal |
| DD < -40% | 33.4% | 67.9% | Best recall by far |
| Combined (2/3 + DD) | 32.2% | -- | Marginal improvement in precision |
Key finding: No single technical signal reliably pinpoints the exact bottom. Drawdown < -40% has the best recall (67.9%) -- it captures most good entries but is a persistent state (you're in this zone for months). The practical implication: once BTC crosses -40% drawdown, begin deploying capital via the DCA ladder rather than trying to time the exact bottom. Volume spikes > 2x have the highest precision (38.6%) and can serve as a "deploy now" confirmation within drawdown zones, but they are too rare for systematic use (44 days in 8 years).
4.7 Charts
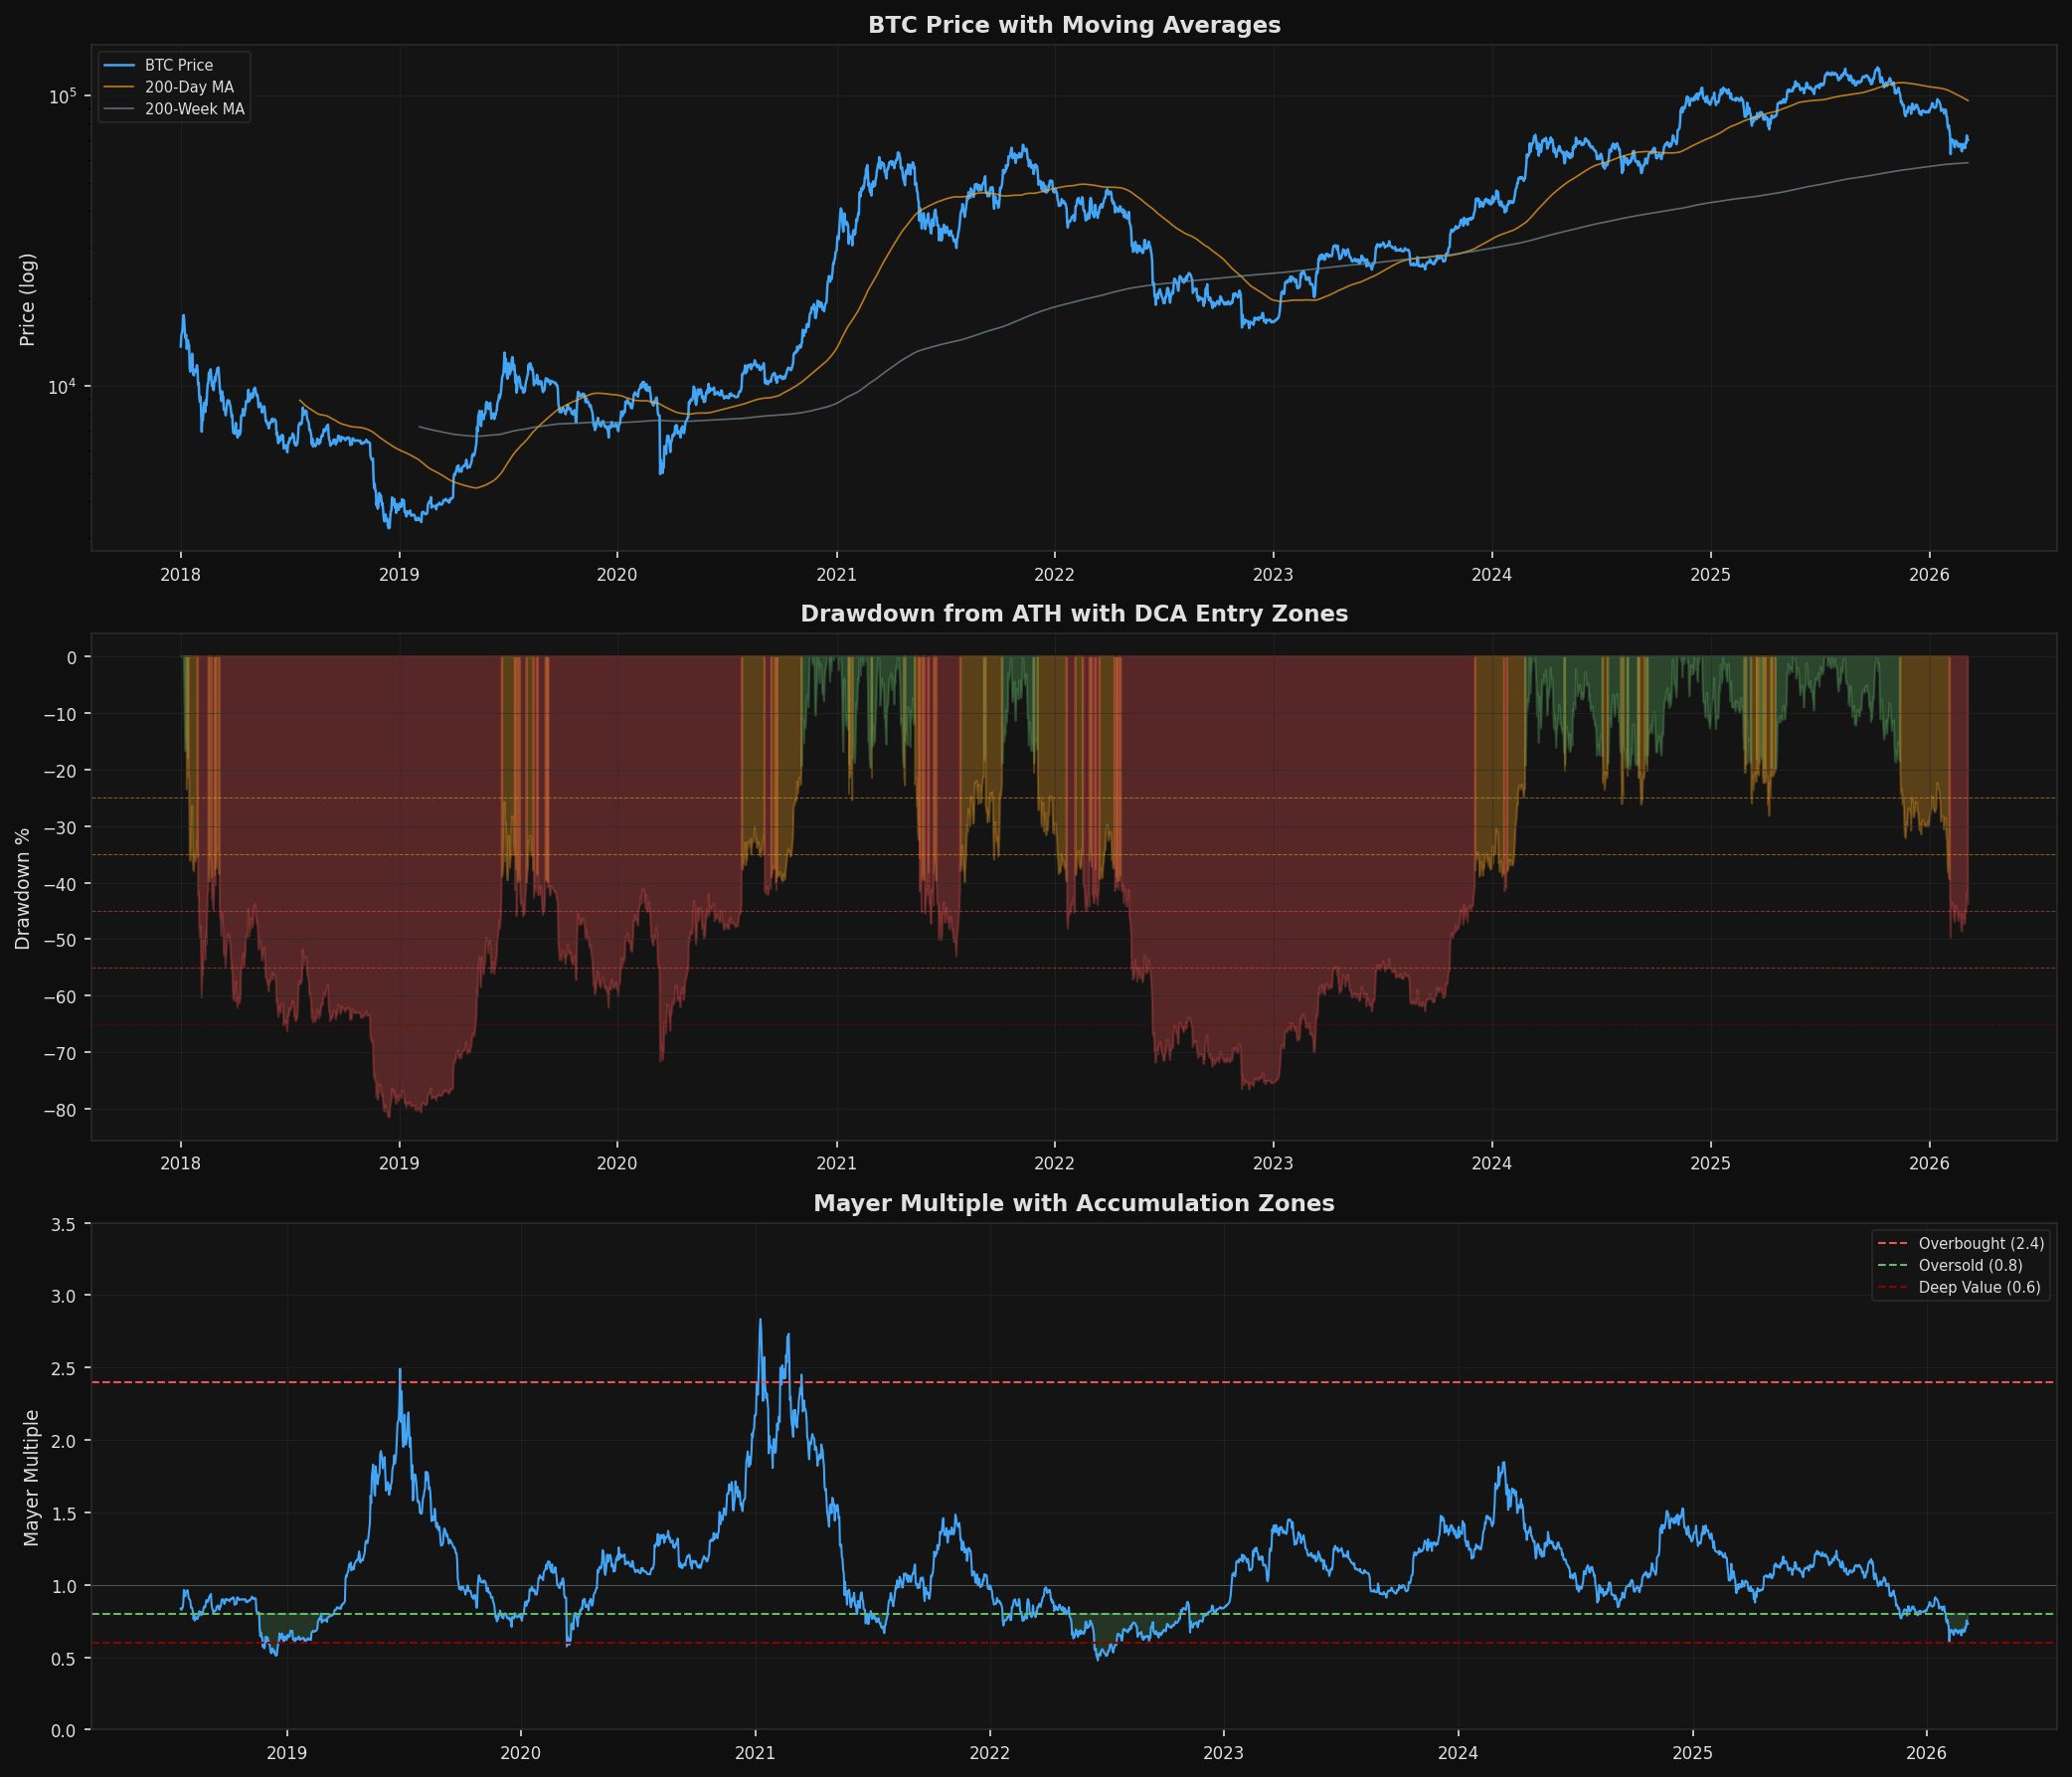
Top: BTC price (log) with 200-day and 200-week MAs. Middle: Drawdown from ATH with DCA entry level lines. Bottom: Mayer Multiple with oversold (0.8) and deep value (0.6) thresholds highlighted.
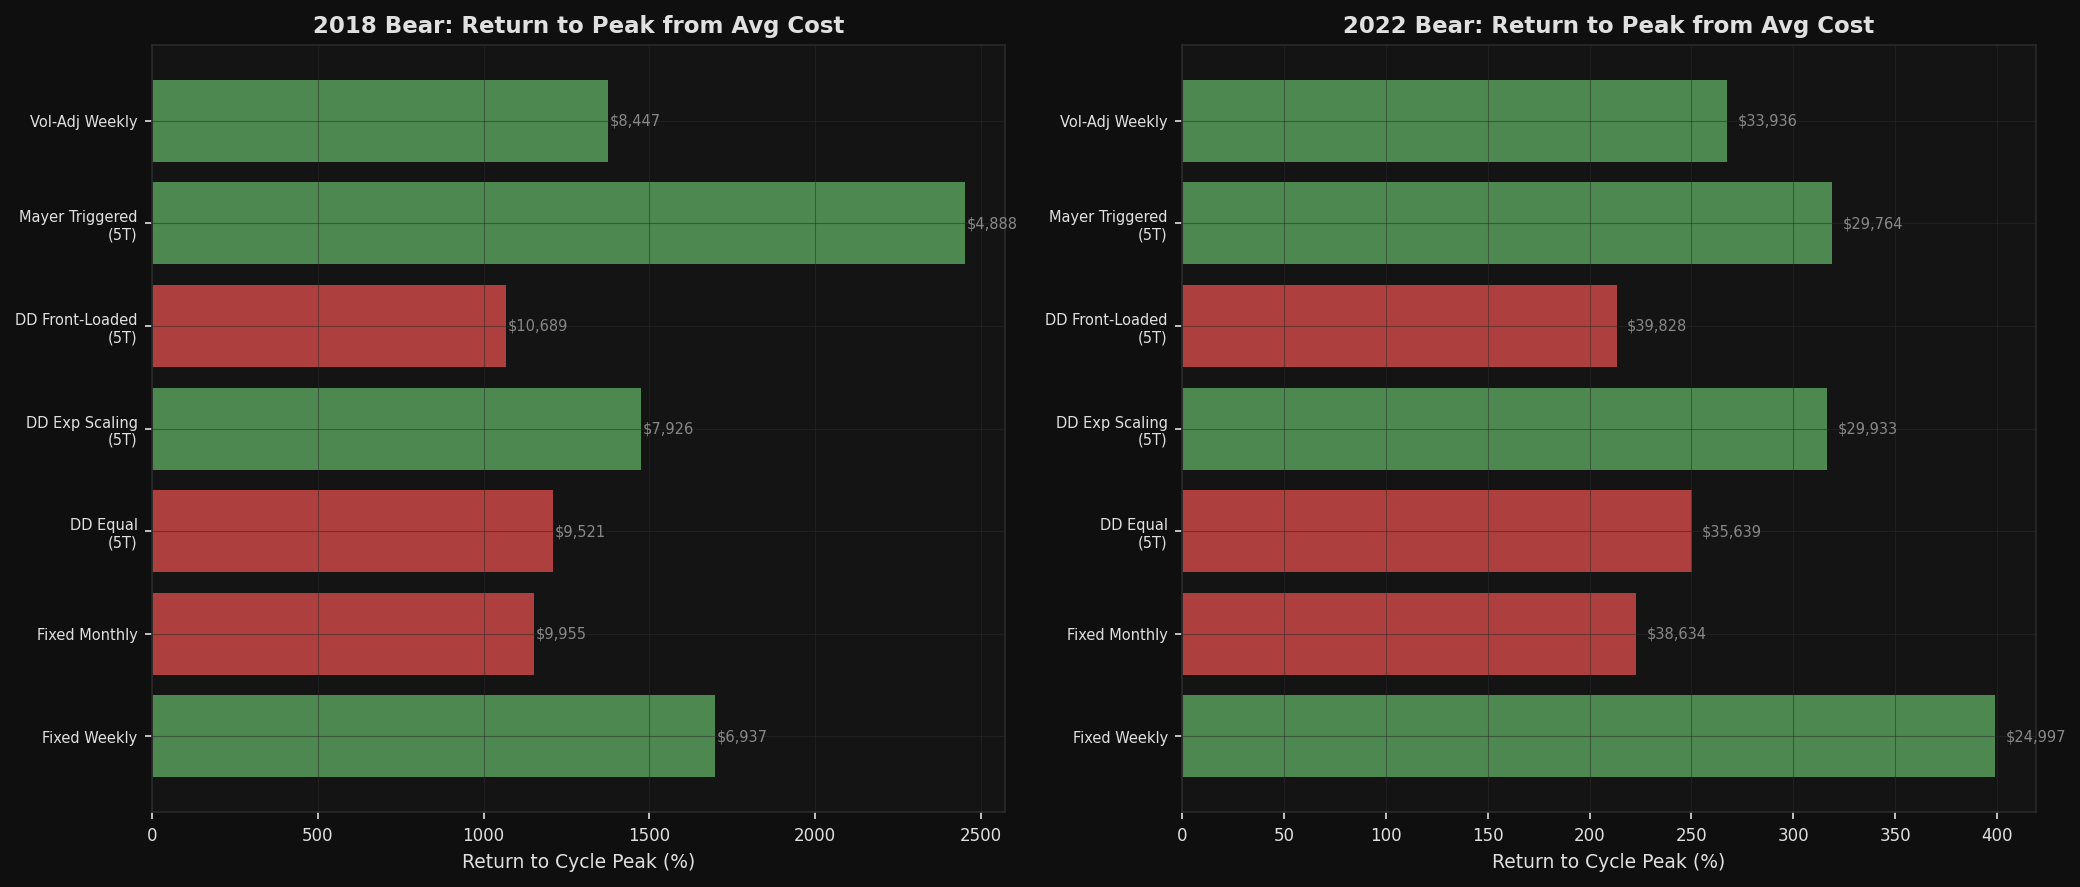
Return to cycle peak from average cost basis. Left: 2018 bear. Right: 2022 bear. Mayer Triggered and exponential scaling consistently top the rankings.
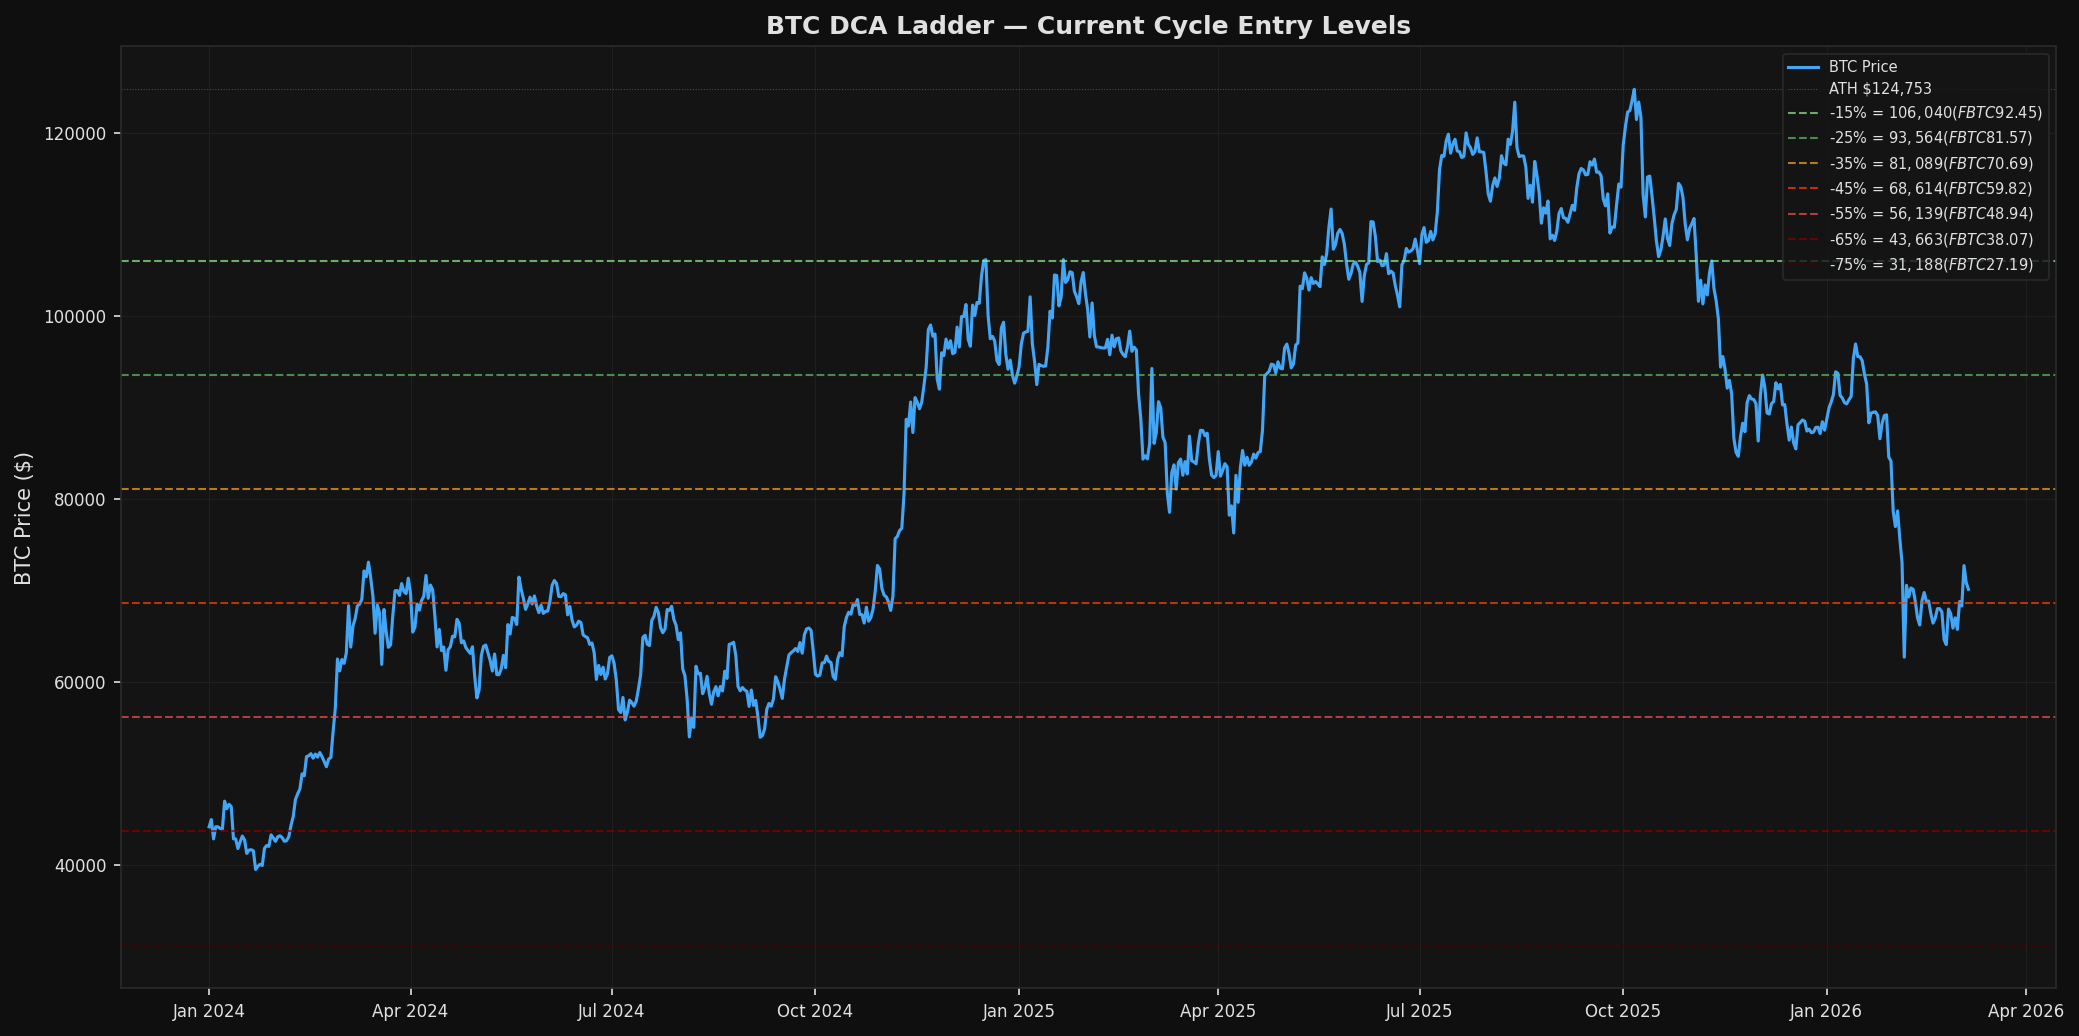
Current cycle BTC price overlaid with DCA entry levels from -15% to -75% drawdown, with FBTC equivalent prices.
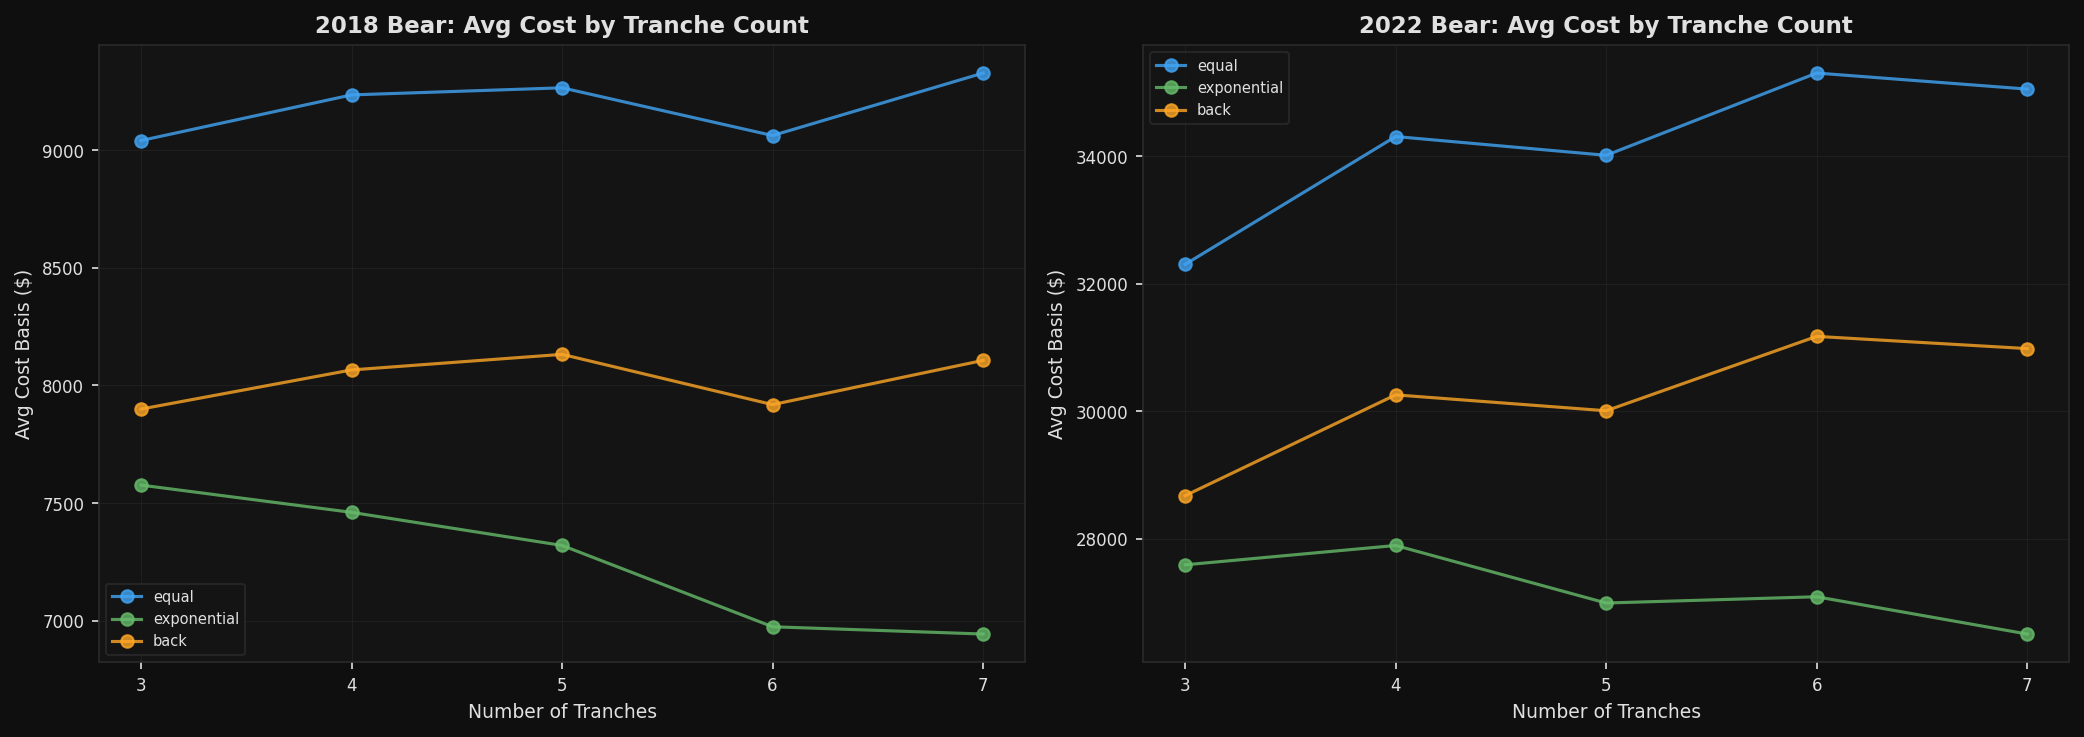
Average cost basis by number of tranches (3-7) for equal, exponential, and back-loaded weighting. More tranches helps marginally; exponential consistently wins.
5. Signal Quality
5.1 What Works
- Drawdown > -40% as zone trigger: 100% historical 365d win rate below -60%, 81% below -50%. The current -43.8% drawdown places BTC in the zone where long-term accumulation has been consistently rewarded.
- Mayer Multiple < 0.8 as entry confirmation: Current MM of 0.731 is below the oversold threshold. Every historical occurrence of MM < 0.8 has preceded positive 365d returns on average (+97%).
- Back-loaded sizing: Consistently produces lower average cost basis than equal or front-loaded. The intuition is correct: deploy more capital when the evidence for deep value is strongest.
5.2 False Positive Considerations
- Drawdown triggers can fire "too early." In 2022, BTC crossed -20% in January but the bottom was not until November. Drawdown-triggered strategies deployed 40-60% of capital in the first few months, leaving insufficient capital for the deepest levels.
- Mayer Multiple shifts with the 200-day MA. In a prolonged bear, the 200d MA falls, which can cause the Mayer Multiple to rise even as price continues falling. This creates false "recovery" signals.
- Sample size limitation: We have only two full bear market cycles (2018, 2022) in the dataset. Two data points are insufficient for statistical confidence. The results are directionally informative but not statistically robust.
5.3 Lead Time
Drawdown-based triggers provide zero lead time by definition -- they fire after price has already fallen. The value is not in prediction but in systematic deployment at favorable valuation levels. The Mayer Multiple has slightly more lead time because it incorporates the 200-day MA as a reference, smoothing out short-term volatility.
5.4 Current State Assessment
BTC at -43.8% drawdown and MM 0.731 is in a zone that has historically produced strong long-term returns. However: - The current cycle is structurally different (ETF-driven, institutional participation, lower MVRV/NUPL readings than comparable points in prior cycles per the cycle detection research) - 30-day forward returns at -40% to -50% drawdown average -0.3%, meaning further decline is the modal short-term outcome - The 200-week MA at $58,592 (FBTC ~$51) represents a historically significant support level that has held in prior cycles
6. Recommended Architecture
6.1 DCA Ladder Indicator Design
Based on the evidence, the optimal strategy combines Mayer Multiple-triggered entries with back-loaded position sizing across 5 tranches.
Inputs: - BTC daily close price - 200-day simple moving average - Expanding all-time high - BTC/FBTC ratio (1147.03, updated periodically)
Computation: 1. Compute Mayer Multiple = Close / 200-day SMA 2. Compute Drawdown % = (Close - ATH) / ATH 3. Map to DCA ladder levels (see table below) 4. Track which levels have been triggered (stateful)
DCA Ladder for Current Cycle (5 tranches, back-loaded):
| Tranche | Trigger | BTC Price | FBTC Price | Weight | Cumulative |
|---|---|---|---|---|---|
| T1 | DD -25% OR MM < 1.0 | $93,564 | $81.57 | 7% | 7% |
| T2 | DD -35% OR MM < 0.85 | $81,089 | $70.69 | 13% | 20% |
| T3 | DD -45% OR MM < 0.72 | $68,614 | $59.82 | 20% | 40% |
| T4 | DD -55% OR MM < 0.59 | $56,139 | $48.94 | 27% | 67% |
| T5 | DD -65% OR MM < 0.46 | $43,663 | $38.07 | 33% | 100% |
Status relative to current price ($70,123 / FBTC $62.05): - T1 and T2: Already triggered (price below those levels) - T3: Active zone -- current price ($68,614 target) is within range - T4 and T5: Not yet triggered -- would require further decline to $56K / $44K
Outputs: - Current DCA phase (which tranches have triggered) - Suggested deployment amount (% of remaining capital) - Zone classification: "Accumulate" (MM < 0.8), "Watch" (MM 0.8-1.0), "Hold" (MM > 1.0) - FBTC equivalent price at each level
6.2 Key Structural Levels
| Level | BTC Price | FBTC Price | Significance |
|---|---|---|---|
| 200-Week MA | $58,592 | $51.08 | Long-term cycle floor -- has held as support in prior cycles |
| Structural Swing Low | $62,553 | $54.54 | Recent swing low; first line of defense |
| Current Price | $70,123 | $61.13 | MM 0.731, -43.8% from ATH |
| 200-Day MA | $95,905 | $83.61 | Bull/bear dividing line |
| ATH | $124,753 | $108.76 | Cycle peak |
6.3 Strategy Sketch for Implementer
Name: "Mayer-Drawdown DCA Ladder"
Entry conditions (per tranche):
- Close <= ATH * (1 + dd_level/100) OR Close / SMA(200) <= mayer_level
- Each tranche triggers once only (stateful flag per level)
- Optional confirmation: RSI(14) < 40 (relaxed threshold to avoid missing entries)
Position sizing: - Back-loaded weights: [1, 2, 3, 4, 5] across 5 tranches (7%, 13%, 20%, 27%, 33%) - Total deployment = user-defined capital allocation
Exit / rebalancing: - No exit signals in this architecture (pure accumulation strategy) - Optional: scale out above MM 2.0 (distribution zone) for profit taking
Parameter ranges to test: - Tranche count: 4-6 - DD entry levels: first tranche -20% to -30%, spacing 8-12% - MM entry levels: first tranche 0.95-1.05, spacing 0.10-0.15 - Weighting: back-loaded [1,2,3,4,5] vs exponential [1,2,4,8,16]
Template reference: models/strategy-variants/candidates/_research_template.py
7. Limitations
7.1 Sample Size
The core limitation of this analysis is that we have only two complete bear market cycles (2018 and 2022) in the BTC-USD dataset. Two observations are insufficient for statistical inference. The results should be treated as directionally informative rather than statistically proven. A third cycle (current) is in progress but incomplete.
7.2 Survivorship Bias
The entire analysis assumes BTC recovers from drawdowns and eventually makes new all-time highs. This has been true for every historical cycle, but there is no guarantee it will continue. The analysis implicitly conditions on BTC's survival and recovery.
7.3 Structural Market Changes
The current cycle differs from 2018 and 2022 in important ways: - ETF participation (FBTC, IBIT, etc.) introduced institutional capital flows that did not exist in prior cycles - On-chain metrics (MVRV 1.34, NUPL 0.204) are lower than at comparable price points in prior cycles, suggesting different market structure - The 200-week MA is structurally higher in this cycle due to the 2021 ATH, which means the "touch the 200W MA" bottom signal maps to a much higher absolute price
7.4 FBTC Ratio Stability
The BTC/FBTC ratio of 1147.03 is based on 538 days of data and has a standard deviation of 10.77. The ratio has been stable but could shift if Fidelity changes fund structure, NAV tracking diverges, or market dislocations create premium/discount dynamics. The FBTC prices in the DCA ladder should be treated as approximate targets, not exact levels.
7.5 Timing Risk
All DCA strategies in this analysis assume capital is available when triggers fire. In practice: - Income timing may not align with drawdown timing - Psychological barriers to deploying large amounts into deep drawdowns are real - The "optimal" back-loaded strategy deploys 33% of capital at the deepest level -- which means sitting on a large cash position during an extended drawdown
7.6 No On-Chain Data in Backtest
The Mayer Multiple-triggered strategy was the best performer, but we were unable to backtest strategies incorporating real-time MVRV, NUPL, or exchange flow data because we do not have historical on-chain data stored locally. The BGeometrics API provides current values but not the full historical time series needed for backtesting. Adding on-chain confirmation signals could potentially improve entry timing but this is unverified.
7.7 This Is Not a Trading Recommendation
This report presents statistical analysis of historical data. Past performance does not predict future results. All DCA levels and strategy comparisons are analytical observations, not investment advice. The user is solely responsible for their own investment decisions.