IREN Technical & Base-Building Analysis
IREN Technical & Base-Building Analysis
Date: 2026-03-04
Asset: IREN (Iren Limited) — NASDAQ
Sector: Bitcoin Mining / AI Data Centers
Current Price: $43.84 (+12.84% on the day)
Charts: iren_*.png
1. Executive Summary
IREN ran 402% from $15.23 to $76.41 in 127 days (Jul-Nov 2025) on the crypto/AI momentum wave, then corrected 56.4% into a December low of $33.34. The stock has spent the last ~17 weeks in a wide, volatile consolidation between roughly $33 and $64. Today's +12.84% candle is the latest in a series of violent two-way swings within this base.
The base is not yet mature. While there are constructive elements (higher lows from Dec to Feb/Mar, price holding above the 200 SMA, volatility contracting in the second half), the pattern is too wide and too young to qualify as a low-risk entry. The stock is still below both the 21 and 50 EMAs, OBV is declining (distribution outweighs accumulation), and the up/down volume ratio is 0.80 (bearish). This is a stock in repair, not yet ready for a breakout entry.
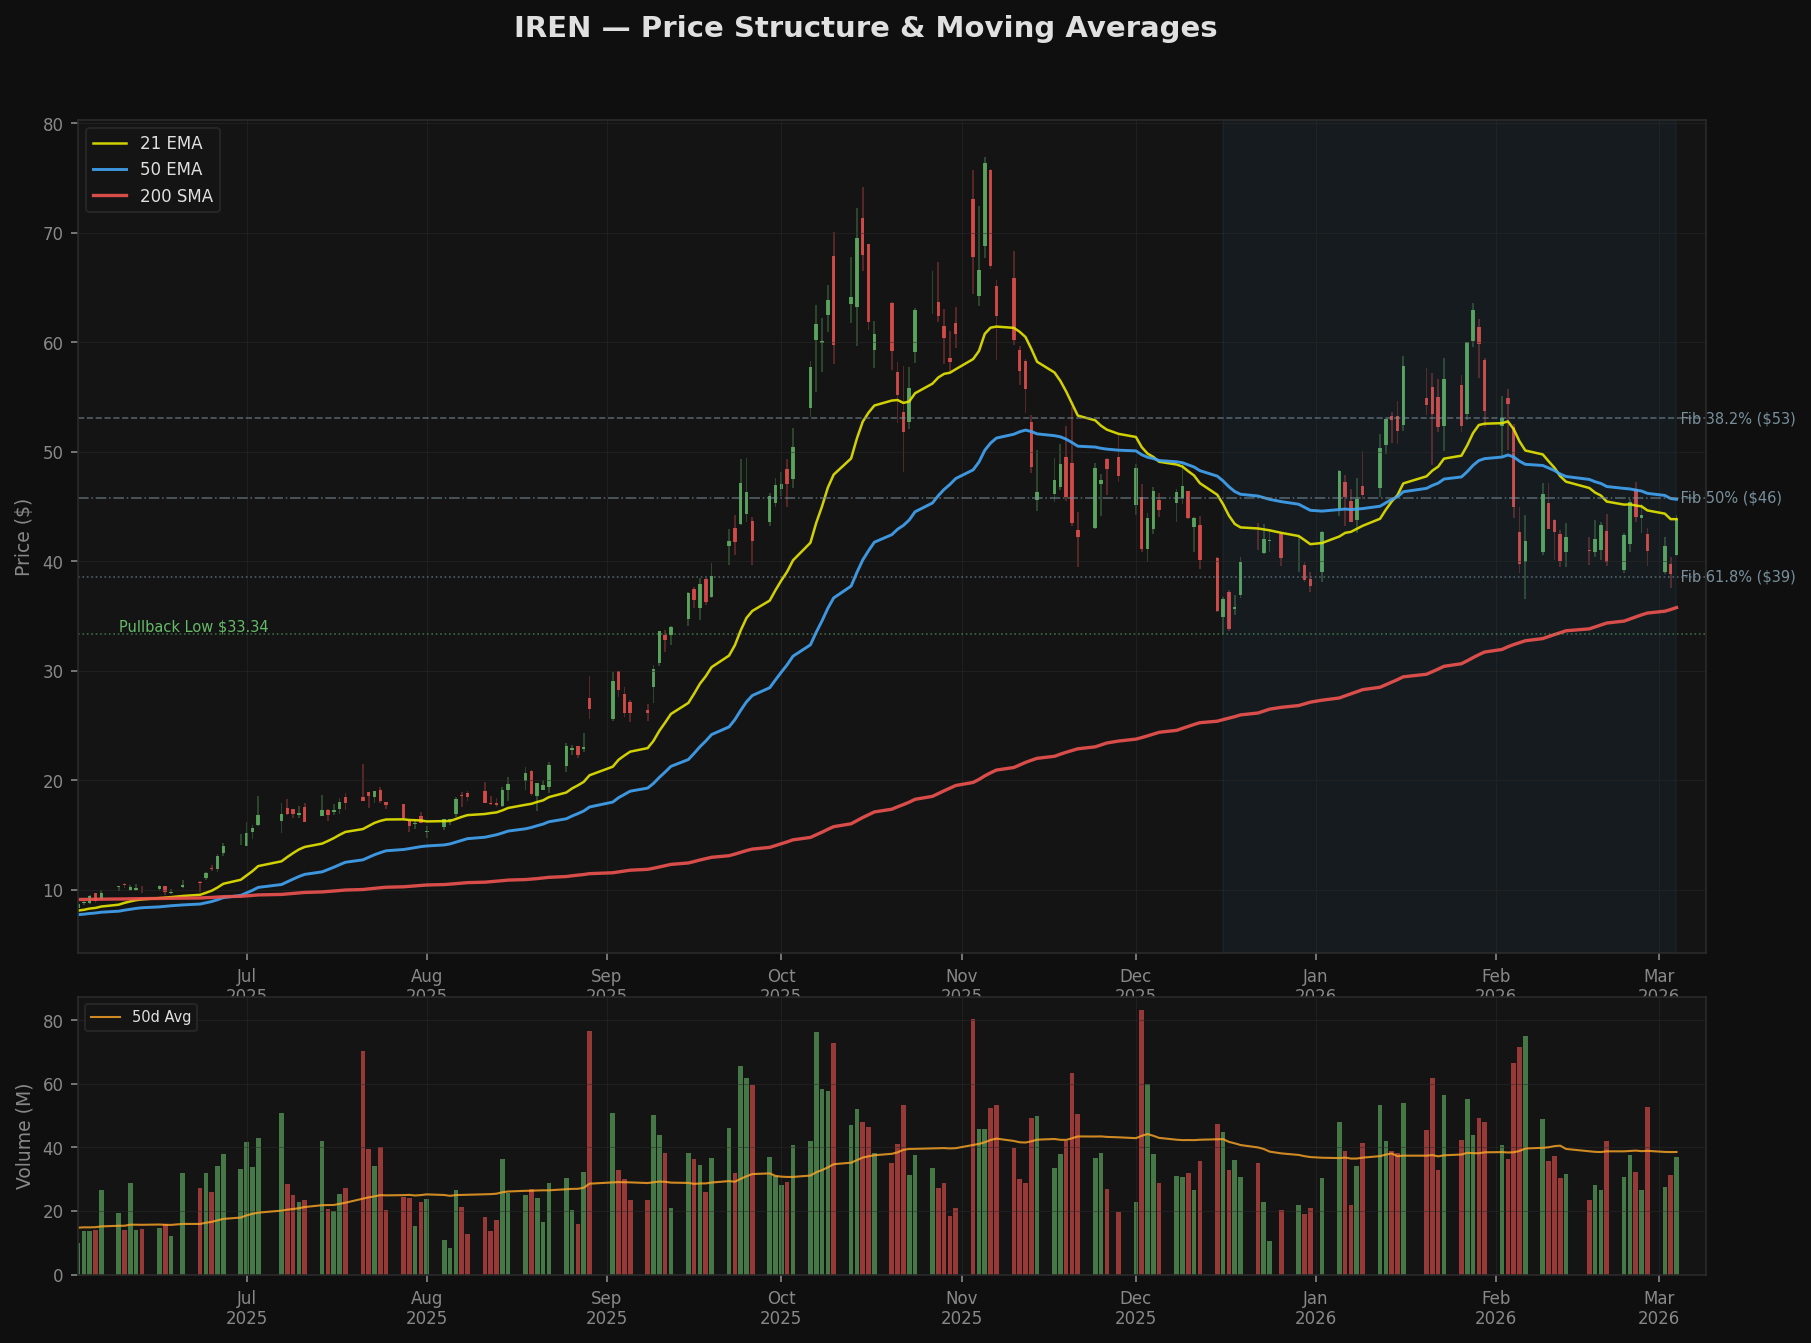
2. Trend Structure & Moving Averages
Current MA Positioning
| Moving Average | Value | Price vs. MA | Slope (10d) |
|---|---|---|---|
| 10 EMA | $42.42 | +3.36% above | -- |
| 21 EMA | $43.85 | -0.02% (at MA) | -4.68% |
| 50 EMA | $45.66 | -3.98% below | -3.08% |
| 200 EMA | $37.62 | +16.53% above | +1.19% |
| 21 SMA | $42.97 | +2.02% above | -12.02% |
| 50 SMA | $46.42 | -5.55% below | +0.79% |
| 200 SMA | $35.78 | +22.53% above | +4.63% |
Interpretation
The MA structure is bearish in the short term, constructive in the long term:
- Price is below the 50 EMA and 50 SMA. This is the most important near-term signal. Until price reclaims and holds above the 50-day averages (~$45.66-$46.42), the intermediate trend is down.
- 21 EMA crossed below 50 EMA on Feb 12. This bearish crossover is still active, with a -3.96% spread between the two. The 21 EMA slope is steeply negative (-4.68% over 10 days).
- 50/200 SMA Golden Cross is intact. The 50 SMA crossed above the 200 SMA back on Jul 8, 2025, and the spread remains wide (+29.73%). This means the long-term trend (secular uptrend) has not been violated.
- 200 SMA is rising. Slope of +4.63% over 10 days (annualized +117%). This is the structural backbone of the uptrend and is holding well below the base at $35.78.
- Today's candle brought price back to the 21 EMA. The $43.84 close is essentially at the 21 EMA ($43.85). This is a key test level.
What the MAs Say About the Base
The EMA compression is notable. The 21 and 50 EMAs were $2-3 apart during the advance; now they are converging. If price can climb above both and they start to flatten and turn up, that would signal the beginning of a stage 2 re-entry. Currently, the MAs are still sloping down.
3. Price Structure
The Primary Advance
| Metric | Value |
|---|---|
| Start | $15.23 on Jul 1, 2025 |
| Peak | $76.41 on Nov 5, 2025 |
| Gain | +401.7% |
| Duration | 127 days |
Fibonacci Retracements (from $15.23 to $76.41)
| Level | Price |
|---|---|
| 0% (peak) | $76.41 |
| 23.6% | $61.97 |
| 38.2% | $53.04 |
| 50.0% | $45.82 |
| 61.8% | $38.60 |
| 78.6% | $28.32 |
| 100% (origin) | $15.23 |
Current retracement depth: 53.2%. Price is sitting between the 50% ($45.82) and 61.8% ($38.60) Fibonacci retracements. The 61.8% level has been tested twice (Feb 6 low of $36.52, Mar 3 low of $37.55) and held both times. This is constructive.
52-Week Range
| Metric | Value | Date |
|---|---|---|
| 52-week high | $76.87 | Nov 5, 2025 |
| 52-week low | $5.12 | Apr 9, 2025 |
| Current position | 54.0% of range | -- |
Pullback Severity
The -56.4% drawdown from peak is severe but not unusual for a stock that ran 402%. The retracement-to-advance ratio is 0.13 (50.9% pullback / 401.7% advance), which falls in the "normal correction" category. After a 5x move in 4 months, giving back half the gains is mechanical mean reversion, not trend destruction.
4. Base Pattern Classification
What Type of Base Is This?
This is not a classic base pattern from any standard taxonomy. It fails the criteria for the clean patterns:
| Pattern | Criteria | IREN Status | Verdict |
|---|---|---|---|
| Flat base | Depth <15-20% | 56.4% deep | NO |
| Cup-with-handle | Recovery >60% of depth, right side forming | 24.4% recovery | NO (too early) |
| VCP (Volatility Contraction) | 3+ tightening contractions | 2 contractions visible | PARTIAL |
| Double bottom | Two lows within 3% | Lows 4.2% apart ($33.34 vs $36.52) | BORDERLINE |
| Ascending base | Series of pullbacks 10-20% within uptrend | Too wide, too volatile | NO |
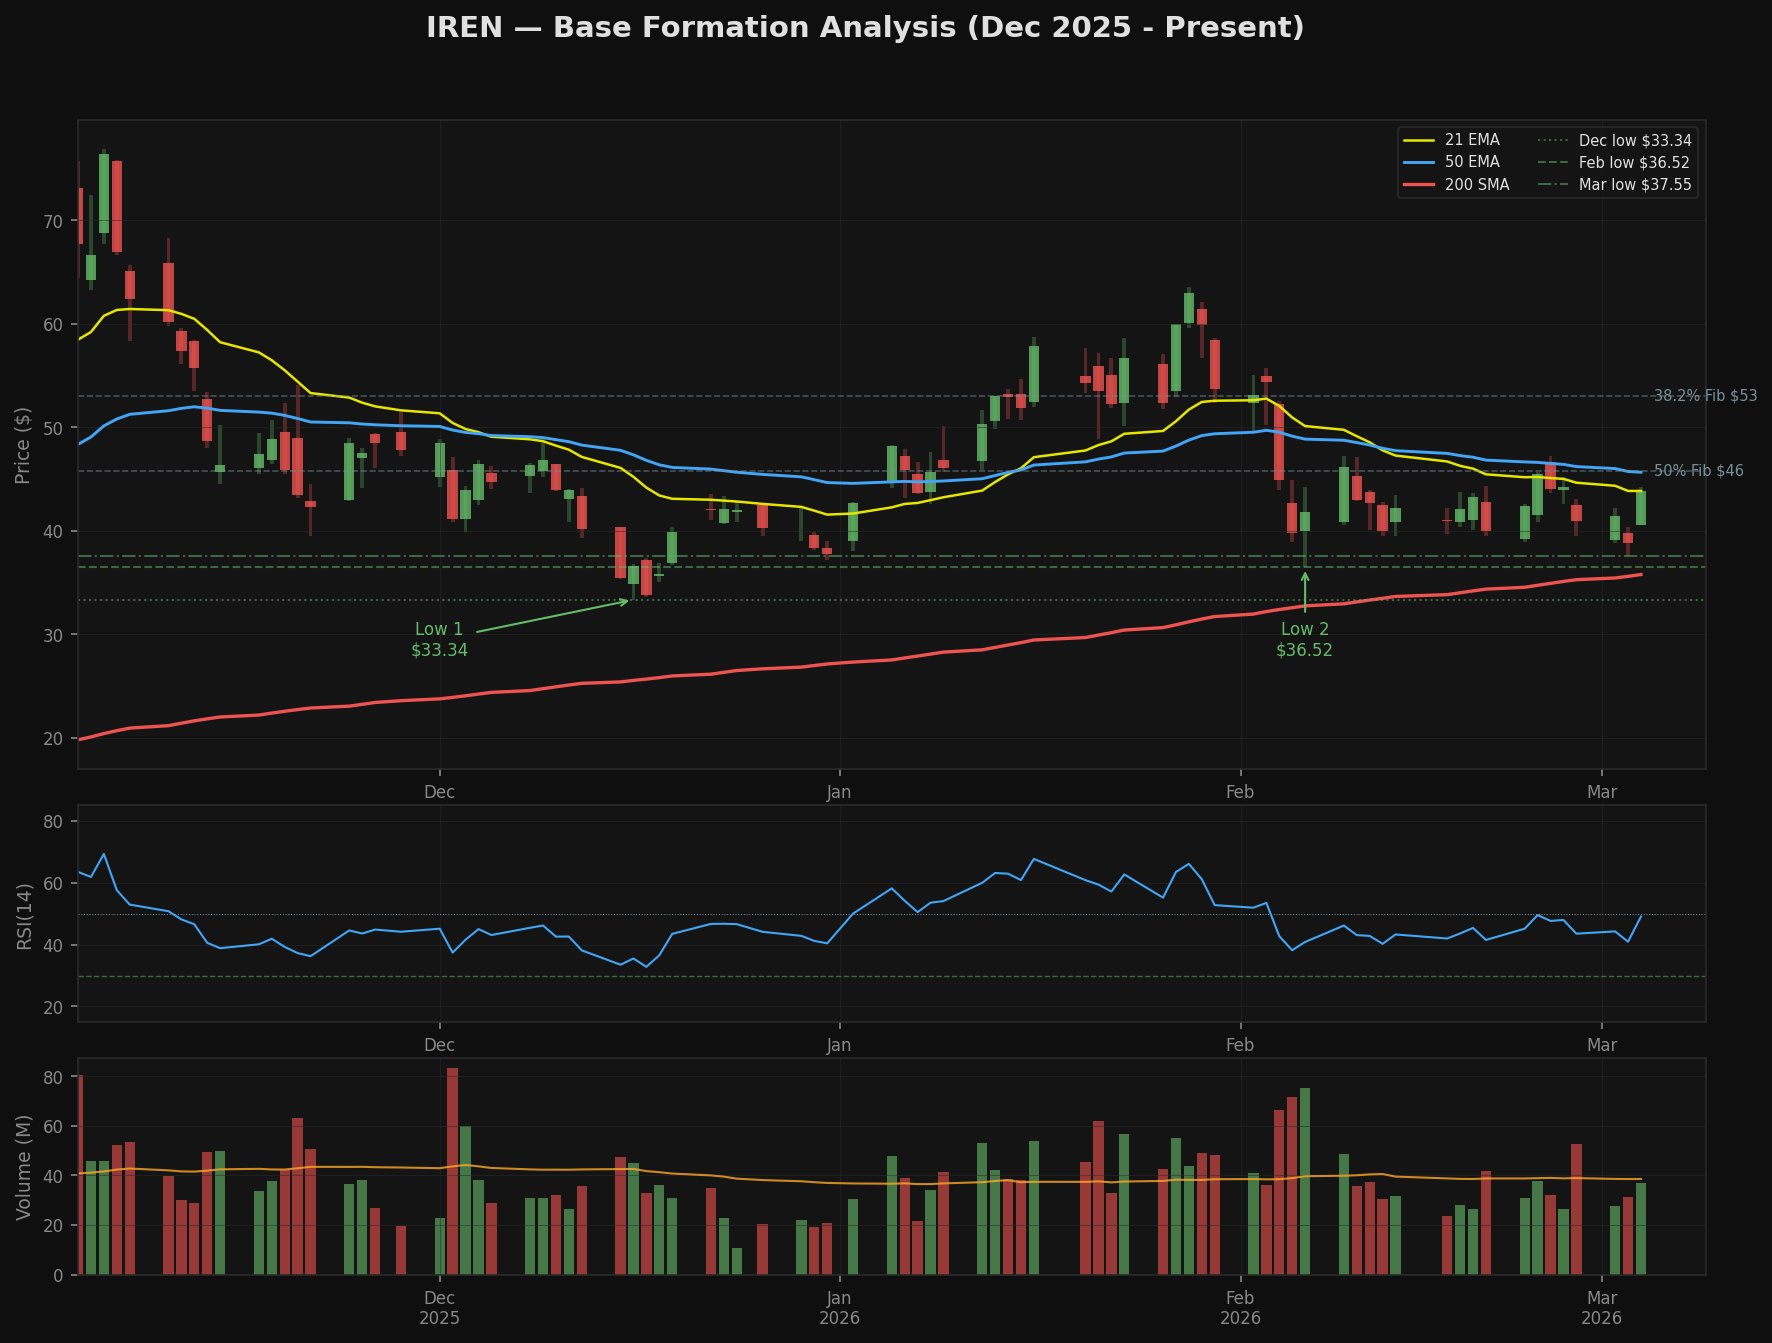
Best classification: Wide-and-loose consolidation with potential W-bottom characteristics. The Dec low ($33.34) and Feb low ($36.52) form a potential double bottom with the second low being higher -- which is more bullish than a true double bottom. However, the 4.2% spread is just outside the <3% rule, and the wild swings within the base (17.4% single-day drop on Feb 4) make this a volatile, institutional-level base rather than a retail-friendly setup.
Wyckoff Framework
The Wyckoff model provides the most useful lens here:
| Phase | Evidence | Assessment |
|---|---|---|
| Selling Climax | Dec 16 low of $33.34 on high volume | Plausible |
| Automatic Rally | Bounce to $63.59 by Jan 28 | Yes -- strong rally off climax |
| Secondary Test | Feb 6 low of $36.52, held above climax low | Yes -- higher low is constructive |
| Spring/Test | Mar 3 low of $37.55 (higher again) | Possible spring test |
| Sign of Strength | Today's +12.84% rally | Too early to confirm |
The Wyckoff read is the most encouraging: we may be in the Sign of Strength (SOS) phase following a successful spring test. However, true SOS requires price to break above the resistance at the trading range's upper boundary (roughly $47-50 area) on expanding volume. Today's volume (37M shares) was actually at 1.0x the 50-day average -- not yet the volume expansion that confirms SOS.
Base Maturity Metrics
| Metric | Value | Interpretation |
|---|---|---|
| Duration | 119 days / 17 weeks | Adequate for the advance size |
| Days above 200 SMA (in base) | 33/33 (100%) | Long-term support intact |
| Days above 50 EMA | 13/33 (39%) | Still a bear-leaning base |
| Days above 21 EMA | 14/33 (42%) | Price oscillating around short MAs |
| Range contraction (1st half vs 2nd half) | -55.2% | Strong contraction (bullish) |
| Closing range improvement | +13.2% (0.494 to 0.559) | Slight improvement, closing higher in range |
| Shakeout candles (long lower wick recovery) | 9 of 33 days | Active shakeout activity |
The range contraction from the first half (51.0%) to the second half (22.9%) of the base is the single most bullish structural metric. This is classic VCP behavior -- even though the overall base is too wide for a textbook VCP, the internal volatility is contracting meaningfully.
5. Volume Analysis
Aggregate Volume Statistics
| Period | Avg Daily Volume |
|---|---|
| During advance (Oct-Dec 2025) | 39.4M |
| During base (Jan 15+) | 42.4M |
| Change | +7.5% |
Volume has not dried up in the base, which is unusual. Normally, healthy bases show volume contraction as supply is absorbed. Here, volume is actually slightly higher than during the advance.
Up/Down Volume
| Metric | Value |
|---|---|
| Up-day volume | 620.8M (44.4%) |
| Down-day volume | 777.9M (55.6%) |
| Up/Down ratio | 0.80 |
This is the most concerning metric in the entire analysis. An up/down volume ratio below 1.0 means more volume is occurring on down days than up days. This indicates net distribution -- institutions are selling into strength, not accumulating on weakness.
Institutional Activity
| Type | Count |
|---|---|
| Institutional buying days (>3% up, above-avg vol) | 6 |
| Strong distribution days (>3% down, above-avg vol) | 8 |
Distribution is outpacing accumulation. This does not mean the base will fail, but it suggests the base is still in the absorption/redistribution phase, not yet in the markup phase.
OBV (On-Balance Volume)
- OBV at base start: 813.6M
- OBV now: 685.5M
- OBV change during base: -128.1M (declining)
OBV is falling during the base, confirming the distribution narrative. For a base to complete and produce a valid breakout, OBV needs to flatten and ideally turn up.
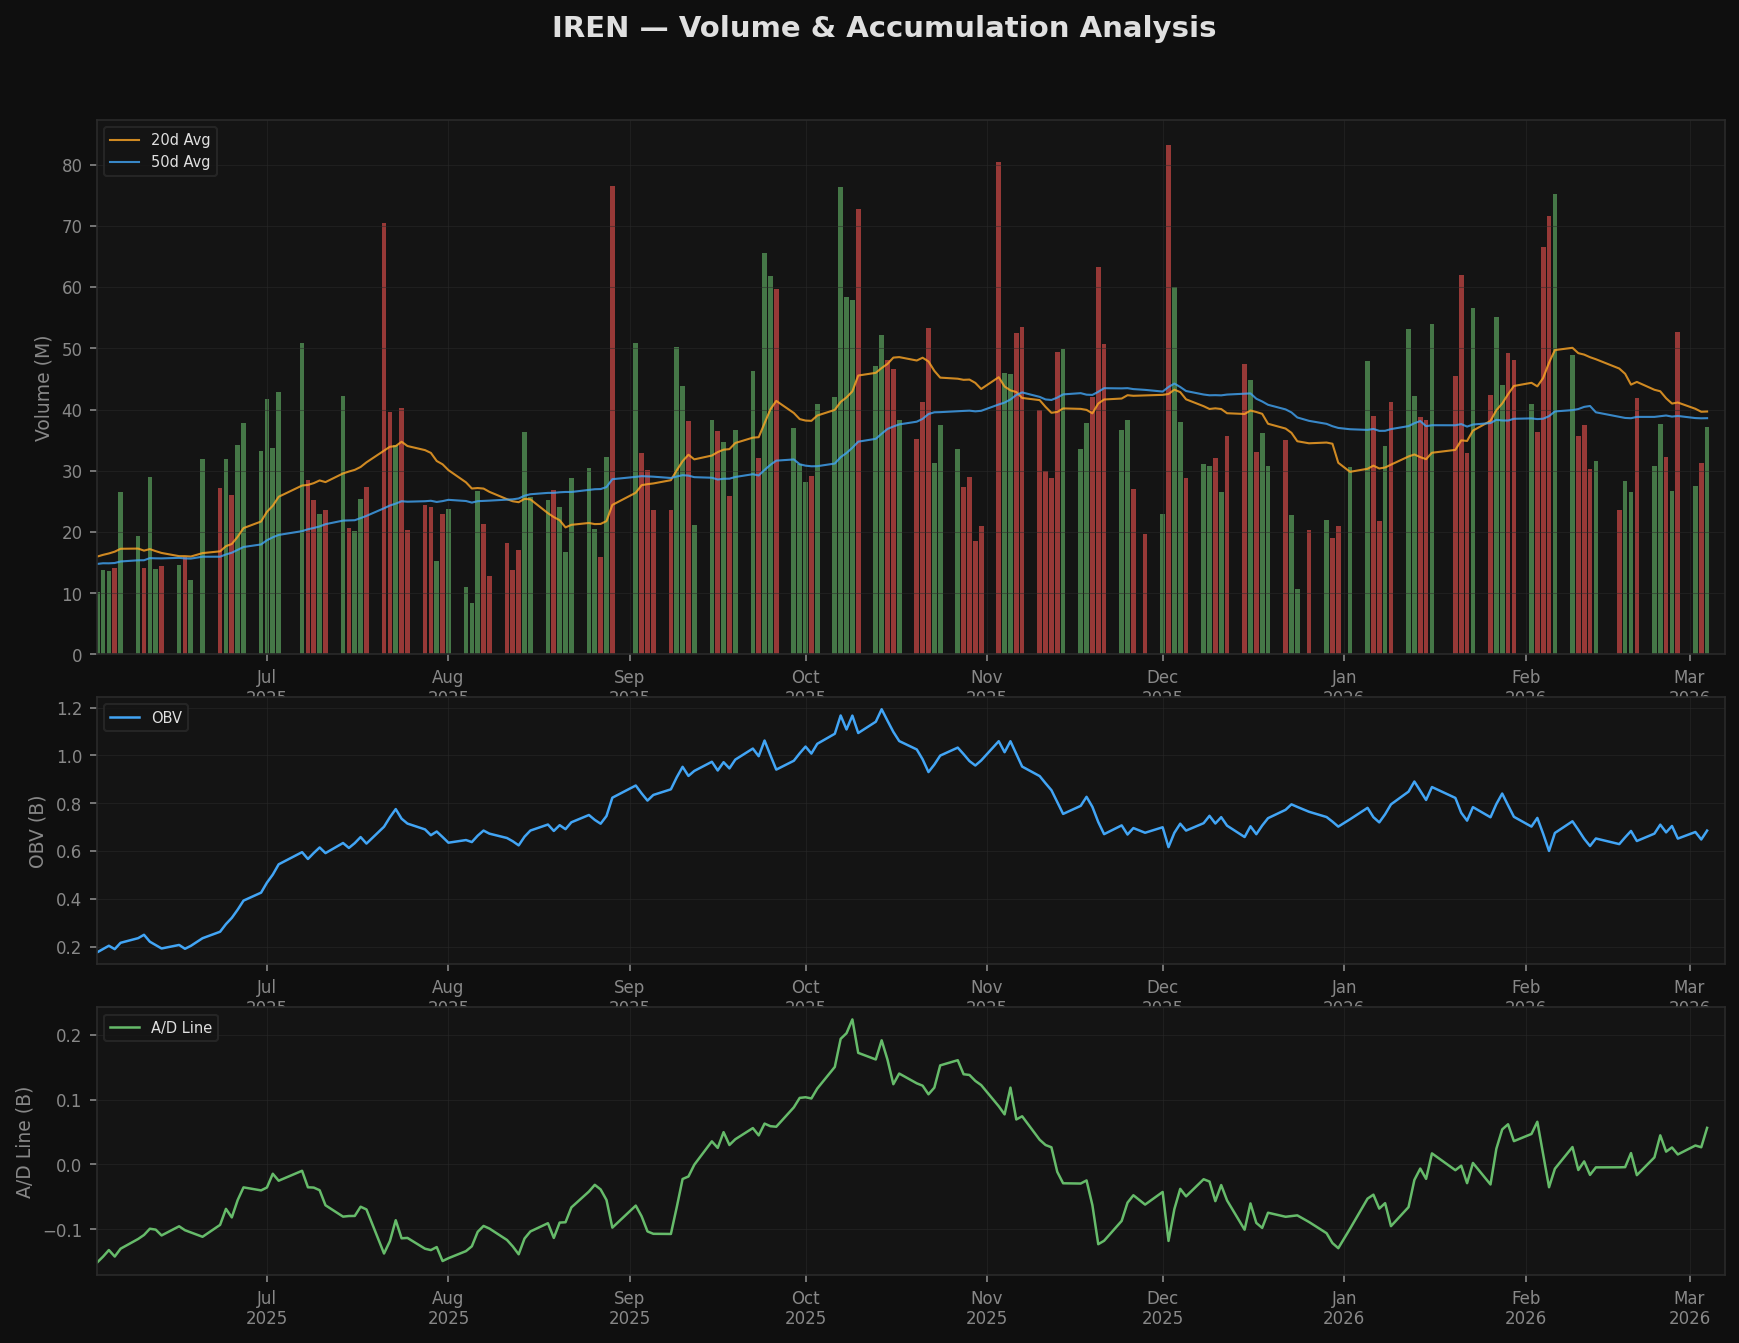
A/D Line
The Accumulation/Distribution line provides a nuanced view by weighting volume by where price closes within the daily range. The A/D line has been relatively flat during the base (neither strong accumulation nor strong distribution), which is slightly better than the OBV signal.
Today's Volume Context
| Metric | Value |
|---|---|
| Today's volume | 37.1M |
| vs. 20-day avg | 0.9x |
| vs. 50-day avg | 1.0x |
Today's +12.84% move came on average volume. This is a cautionary note: a true breakout or sign of strength should come on volume that is at least 1.5-2x the 50-day average. Average volume on a large move suggests a short-covering rally or low-liquidity gap, not institutional buying.
6. Momentum Analysis
RSI(14)
| Metric | Value |
|---|---|
| Current RSI | 49.07 |
| RSI 5 days ago | 47.97 |
| RSI 10 days ago | 45.40 |
| RSI at peak (Nov 5) | 69.31 |
| RSI at pullback low (Dec 16) | 35.52 |
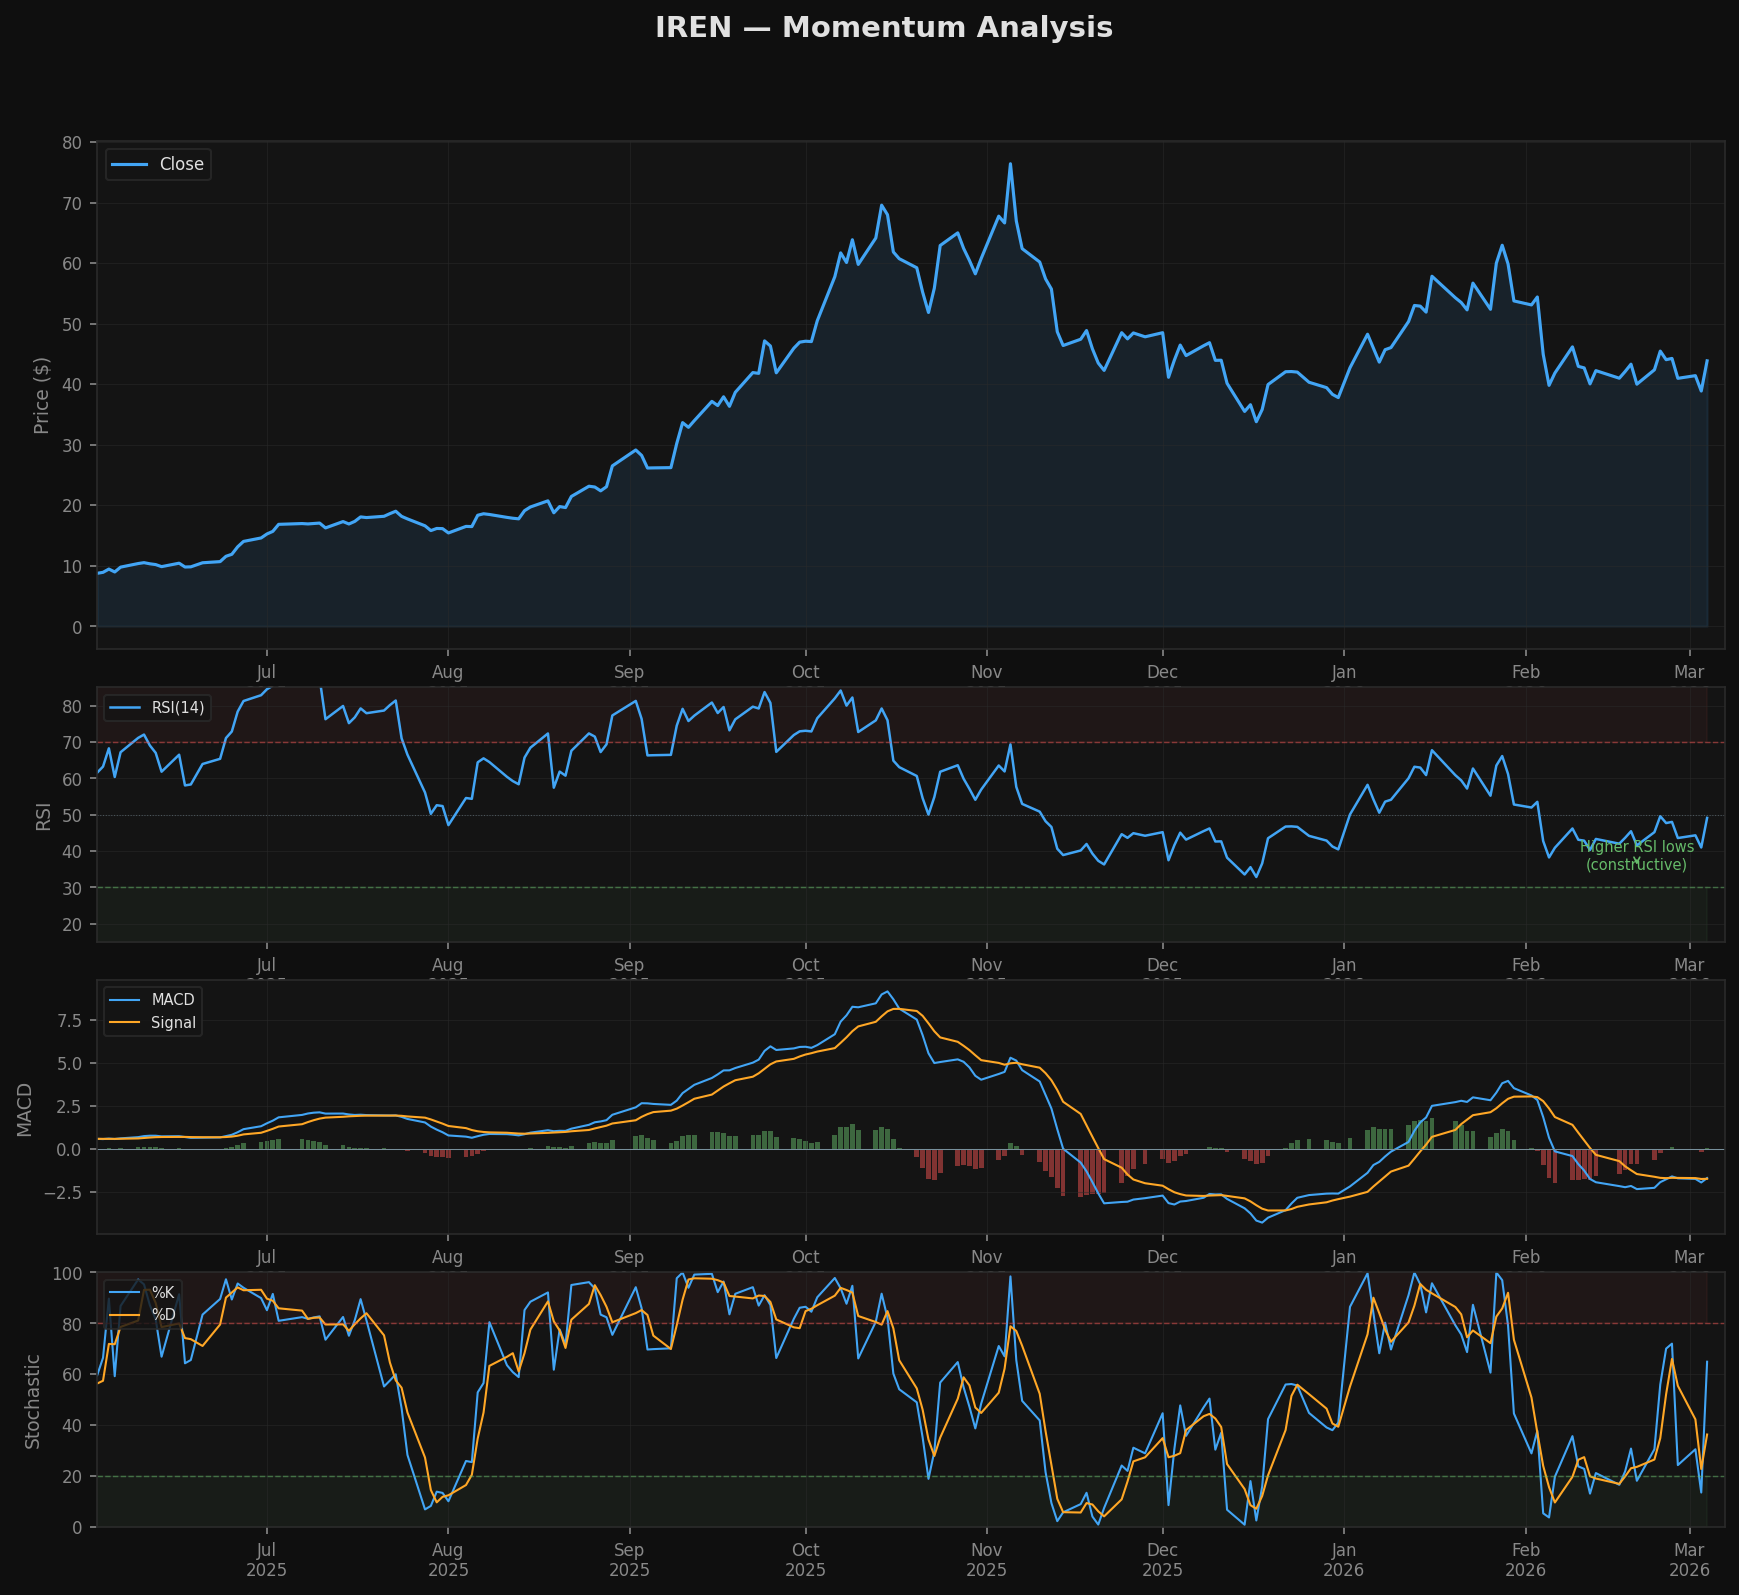
RSI is neutral at 49.07. The RSI trajectory is constructive: the Feb low (RSI 40.86 at price $36.52) and Mar low (RSI 40.93 at price $37.55) show higher lows in both price and RSI. This is not a classical bullish divergence (which requires price making a lower low with RSI making a higher low), but it is a constructive pattern showing that selling pressure is exhausting.
MACD
| Metric | Value |
|---|---|
| MACD | -1.7133 |
| Signal | -1.7563 |
| Histogram | +0.0431 |
| Histogram trend (5d) | Falling (0.0814 to 0.0431) |
MACD remains deeply negative (both MACD and signal below zero), reflecting the intermediate downtrend. However, the histogram has been positive for several days (MACD above signal), indicating the rate of decline is slowing. The declining histogram bars are a minor concern -- momentum of the recovery is fading.
Stochastic (14,3)
| Metric | Value |
|---|---|
| %K | 64.85 |
| %D | 36.22 |
The large spread between %K (64.85) and %D (36.22) reflects today's sharp rally. %K has crossed above %D from oversold territory, which is a short-term buy signal. However, stochastic signals in volatile, rangebound stocks generate frequent whipsaws.
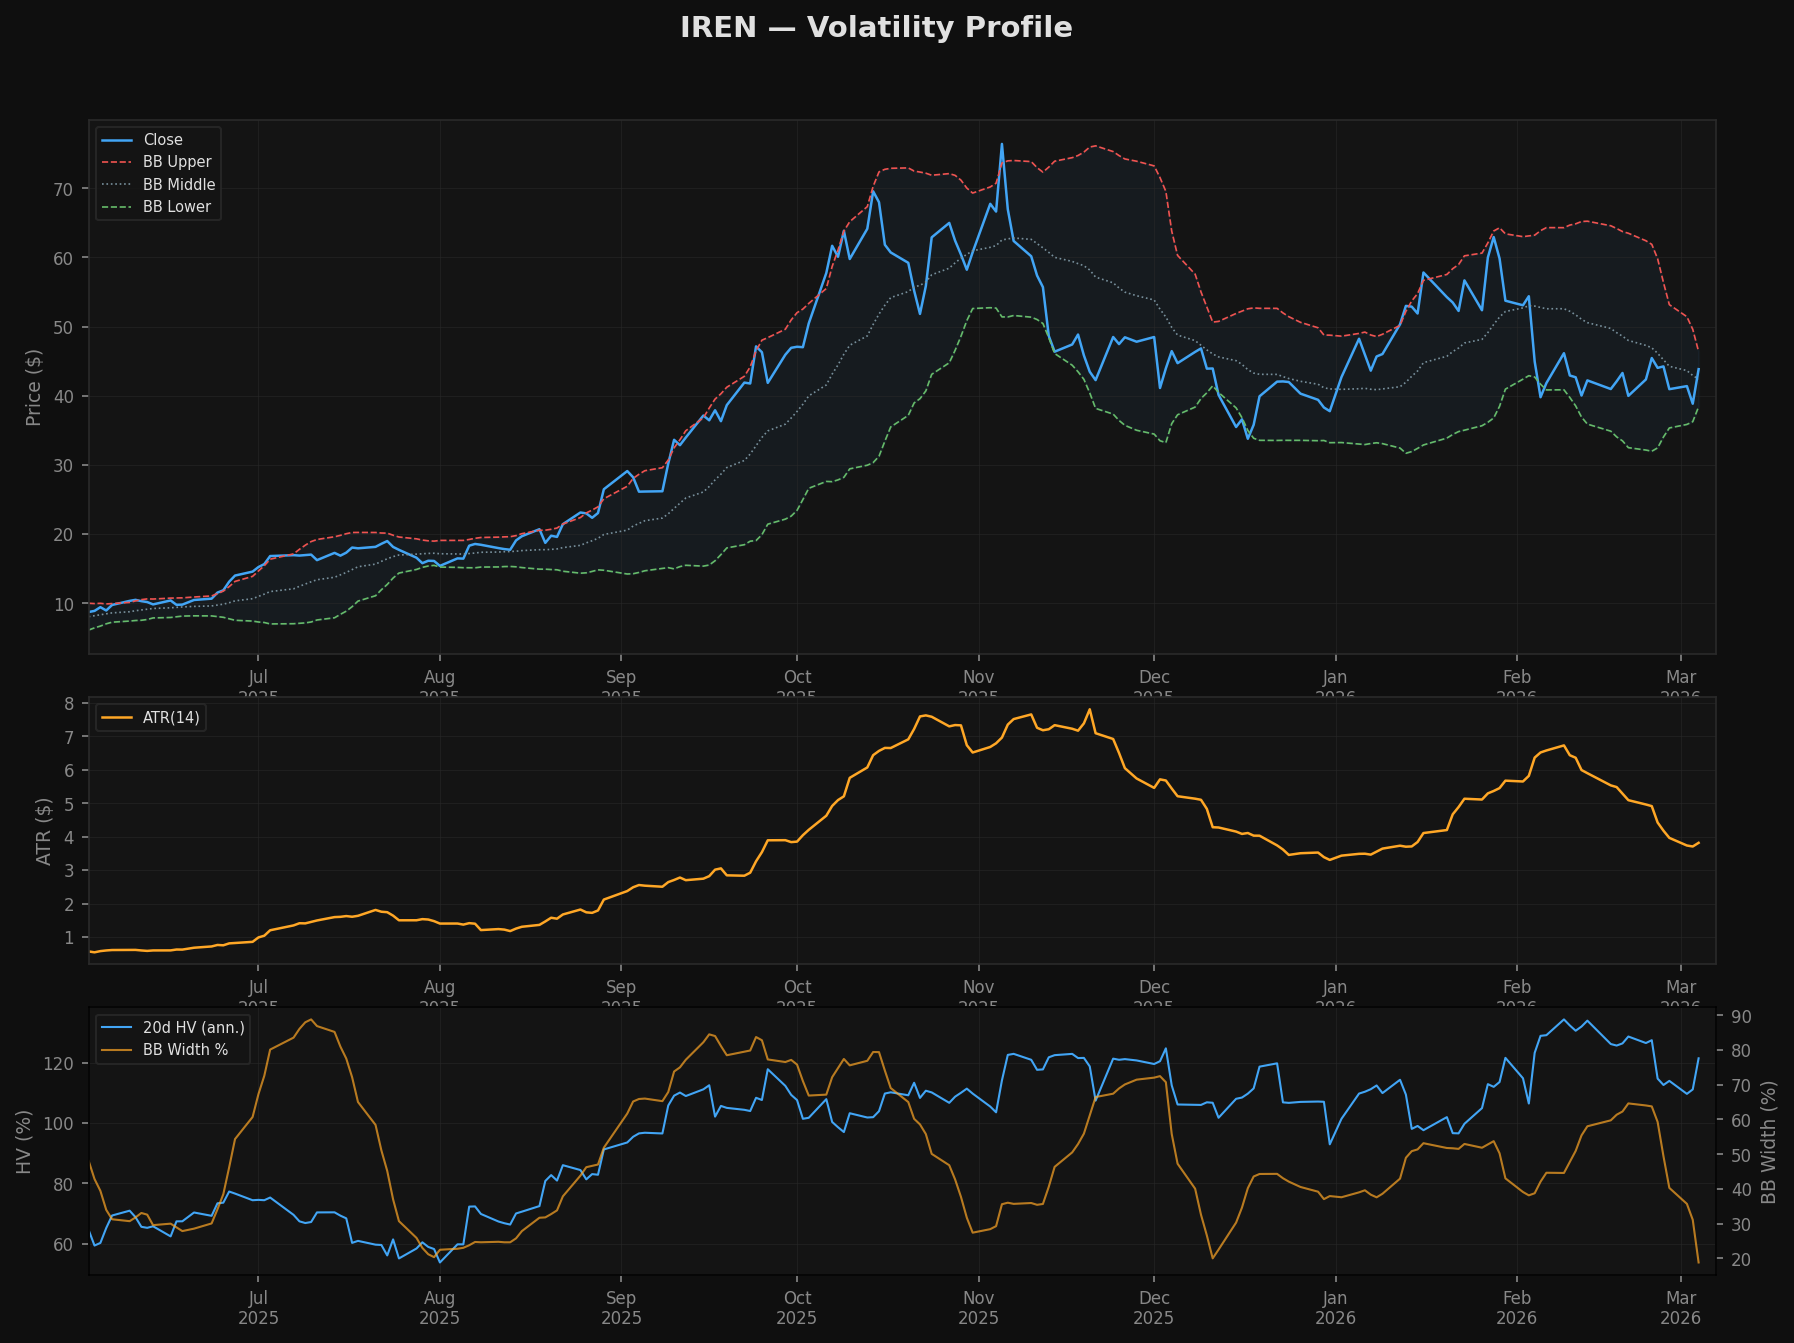
7. Volatility Profile
ATR Analysis
| Metric | Value |
|---|---|
| ATR(14) | $3.81 |
| ATR as % of price | 8.70% |
| ATR at peak | $6.96 |
| ATR min in base | $3.71 (Mar 3) |
| ATR contraction | -46.8% |
The ATR has contracted by nearly 47% from peak levels. As a percentage of price, ATR is 8.70% -- still extremely high in absolute terms (for reference, SPY's ATR is typically 1-2% of price). This stock moves $3-4 per day on average, which means daily swings of 7-10% are routine.
The ATR reaching its base minimum on Mar 3 (the day before today's rally) and then expanding on today's move is consistent with a volatility compression breakout pattern. However, one day does not confirm the pattern.
Bollinger Bands
| Metric | Value |
|---|---|
| Upper Band | $46.39 |
| Middle (20 SMA) | $42.40 |
| Lower Band | $38.41 |
| BB Width | 18.82% |
| BB Width Percentile (90d) | 1st |
The Bollinger Bandwidth is at its 1st percentile over 90 days. This is the tightest the bands have been in over 3 months. Bollinger squeezes predict large moves -- they do not predict direction, but the compression is extreme.
Historical Volatility
| Period | 20d HV (annualized) |
|---|---|
| During advance | 111.0% |
| During base | 117.2% |
| Current | 121.4% |
Historical volatility has actually increased slightly during the base compared to the advance. This is unusual and reflects the violent two-way swings. The base is not "quiet" -- it is a high-energy consolidation.
Return Distribution in Base
| Metric | Value |
|---|---|
| Mean daily return | -0.242% |
| Std dev | 7.620% |
| Skew | +0.035 (neutral) |
| Kurtosis | -0.426 (light-tailed) |
| Min | -17.37% |
| Max | +14.57% |
The near-zero skew and slightly negative kurtosis suggest a roughly symmetric distribution of returns -- not a trending distribution. The mean daily return is slightly negative, consistent with a stock in a corrective phase.
8. Relative Performance
vs. Bitcoin (60-day)
| Metric | Value |
|---|---|
| Correlation | 0.459 |
| Beta | 0.88 |
IREN has moderate correlation with BTC (0.459) and a beta of 0.88. This is lower than expected for a Bitcoin mining stock, likely because the AI data center pivot has partially decoupled IREN from pure crypto exposure.
Performance Comparison
| Period | IREN | BTC | Spread |
|---|---|---|---|
| 1 week | -0.9% | +8.5% | -9.4% |
| 1 month | -19.4% | +9.7% | -29.1% |
| 3 months | +6.6% | -18.1% | +24.7% |
IREN is lagging BTC over 1W and 1M, meaning BTC has rallied while IREN has corrected. This relative weakness in a rising BTC environment is notable. However, on a 3M basis, IREN is outperforming both BTC and SPY, reflecting the massive rally that preceded the pullback.
9. Key Levels to Watch
Resistance (ascending)
| Level | Source | Significance |
|---|---|---|
| $43.85 | 21 EMA | Immediate resistance; today closed right here |
| $45.66-$46.42 | 50 EMA / 50 SMA | Critical zone; must reclaim for intermediate uptrend |
| $47.25 | Recent swing high (Feb 25) | Short-term resistance from prior rejection |
| $50.00 | Psychological round number | Major resistance zone |
| $53.04 | 38.2% Fibonacci retracement | First major Fibonacci resistance |
| $55.72 | Feb 13 high | Prior swing high within base |
| $63.59 | Jan 28 base high | Upper boundary of consolidation range |
| $76.41 | All-time high (Nov 5) | Long-term target |
Support (descending)
| Level | Source | Significance |
|---|---|---|
| $42.40 | 20 SMA (BB midline) | First support |
| $40.52 | Today's low | Intraday support |
| $38.60 | 61.8% Fibonacci | Critical support zone |
| $37.55 | Mar 3 low | Most recent swing low |
| $36.52 | Feb 6 low | Secondary test low |
| $35.78 | 200 SMA | Major structural support |
| $33.34 | Dec 16 selling climax low | Last line of defense |
10. Setup Assessment & What to Watch
Is This a Buyable Base?
Not yet. The base has constructive elements but several missing ingredients for a high-probability entry:
Constructive (bullish): 1. Higher lows: $33.34 (Dec) -> $36.52 (Feb) -> $37.55 (Mar) 2. Holding above 200 SMA (100% of base days above 200 SMA) 3. Range contraction: second half range 55% tighter than first half 4. Bollinger squeeze at 1st percentile (predicts a large directional move) 5. Golden Cross (50/200 SMA) intact 6. Wyckoff structure plausible (selling climax, automatic rally, secondary test, potential spring)
Concerning (bearish/neutral): 1. OBV declining -- net distribution during base 2. Up/Down volume ratio 0.80 -- more volume on down days 3. Price still below 50 EMA and 50 SMA (intermediate downtrend intact) 4. 21/50 EMA bearish cross still active 5. Today's rally came on average volume (1.0x), not the 1.5-2x expansion that confirms institutional buying 6. HV still elevated (121% annualized) -- base is not "quiet" 7. More strong distribution days (8) than institutional buying days (6)
What Would Change the Assessment
Bullish trigger (base completion): 1. Price closes above 50 EMA ($45.66) and holds for 3+ days 2. Volume on the breakout is 1.5x+ the 50-day average 3. OBV starts making higher highs 4. 21 EMA crosses back above 50 EMA (reverses the Feb 12 bearish cross) 5. Follow-through after today: another up day tomorrow on equal or greater volume would be meaningful
Bearish trigger (base failure): 1. Close below the 200 SMA ($35.78) 2. Close below the Feb low ($36.52) on heavy volume 3. New low below $33.34 (Dec selling climax) -- this would negate the entire base and likely start a stage 4 decline
Near-Term Price Action to Monitor
This week (post-rally): - The quality of the follow-through matters more than today's move. A +12.84% day that gives back 50%+ within 2 days is a failed rally attempt (distribution into strength). Look for price to hold above $42.00-$42.40 (20 SMA / today's gap area). - If price can work toward $45.66-$46.42 (50 EMA/SMA zone) on decent volume over the next 5-7 sessions, that would be the first real test.
Next 2-4 weeks: - Watch for a "handle" to form. If price pulls back 5-10% from here (to $39-$42) on declining volume, then rallies again toward $46+, that would create a cup-and-handle structure. - The 21/50 EMA crossover is key. If the 21 EMA turns up and crosses above the 50 EMA (reversing the Feb 12 death cross), that would be a meaningful intermediate signal.
Catalyst windows: - Earnings reports (company-specific) - Bitcoin price action: with 0.46 correlation, a sustained BTC rally above $100K would likely lift IREN - Broader market: IREN's 3M outperformance vs SPY suggests it can lead in a risk-on environment
11. Limitations
-
High-beta, low-float dynamics. IREN is a volatile stock ($3.81 ATR) where technical levels are regularly blown through by 5-10% intraday moves. Traditional support/resistance concepts have wider margins of error here.
-
Short trading history. IREN has been listed since Nov 2021 but was a sub-$10 stock until mid-2025. The current price regime ($30-$75) has only ~6 months of data. All technical analysis should be treated with appropriate skepticism for thin history.
-
Binary event risk. As a Bitcoin mining company pivoting to AI data centers, IREN is subject to macro/crypto regime shifts that can override any technical pattern. A BTC crash or AI hype reversal would invalidate the base regardless of its structure.
-
Volume interpretation caveat. The "average volume" on today's rally may be misleading if the session is not complete or if after-hours trading added to the count. The volume figure (37.1M) should be verified against the full-session close.
-
No fundamental analysis. This report does not assess IREN's hash rate, energy costs, AI data center revenue, balance sheet, or competitive position. Technical analysis alone is insufficient for a company in the middle of a business model pivot.
Charts
| Chart | File |
|---|---|
| Price Structure & MAs | charts/iren_price_structure.png |
| Momentum (RSI, MACD, Stochastic) | charts/iren_momentum.png |
| Volume & Accumulation | charts/iren_volume_accumulation.png |
| Volatility Profile | charts/iren_volatility.png |
| Base Formation Analysis | charts/iren_base_analysis.png |
Analysis Script
scripts/iren-technical-base-2026-03-04.py
Analysis produced by Quant Researcher. All statistics computed via Python; no values were estimated or computed by the LLM. This is research, not a trading recommendation.
Charts