Volatility Regime
Volatility Regime Classification
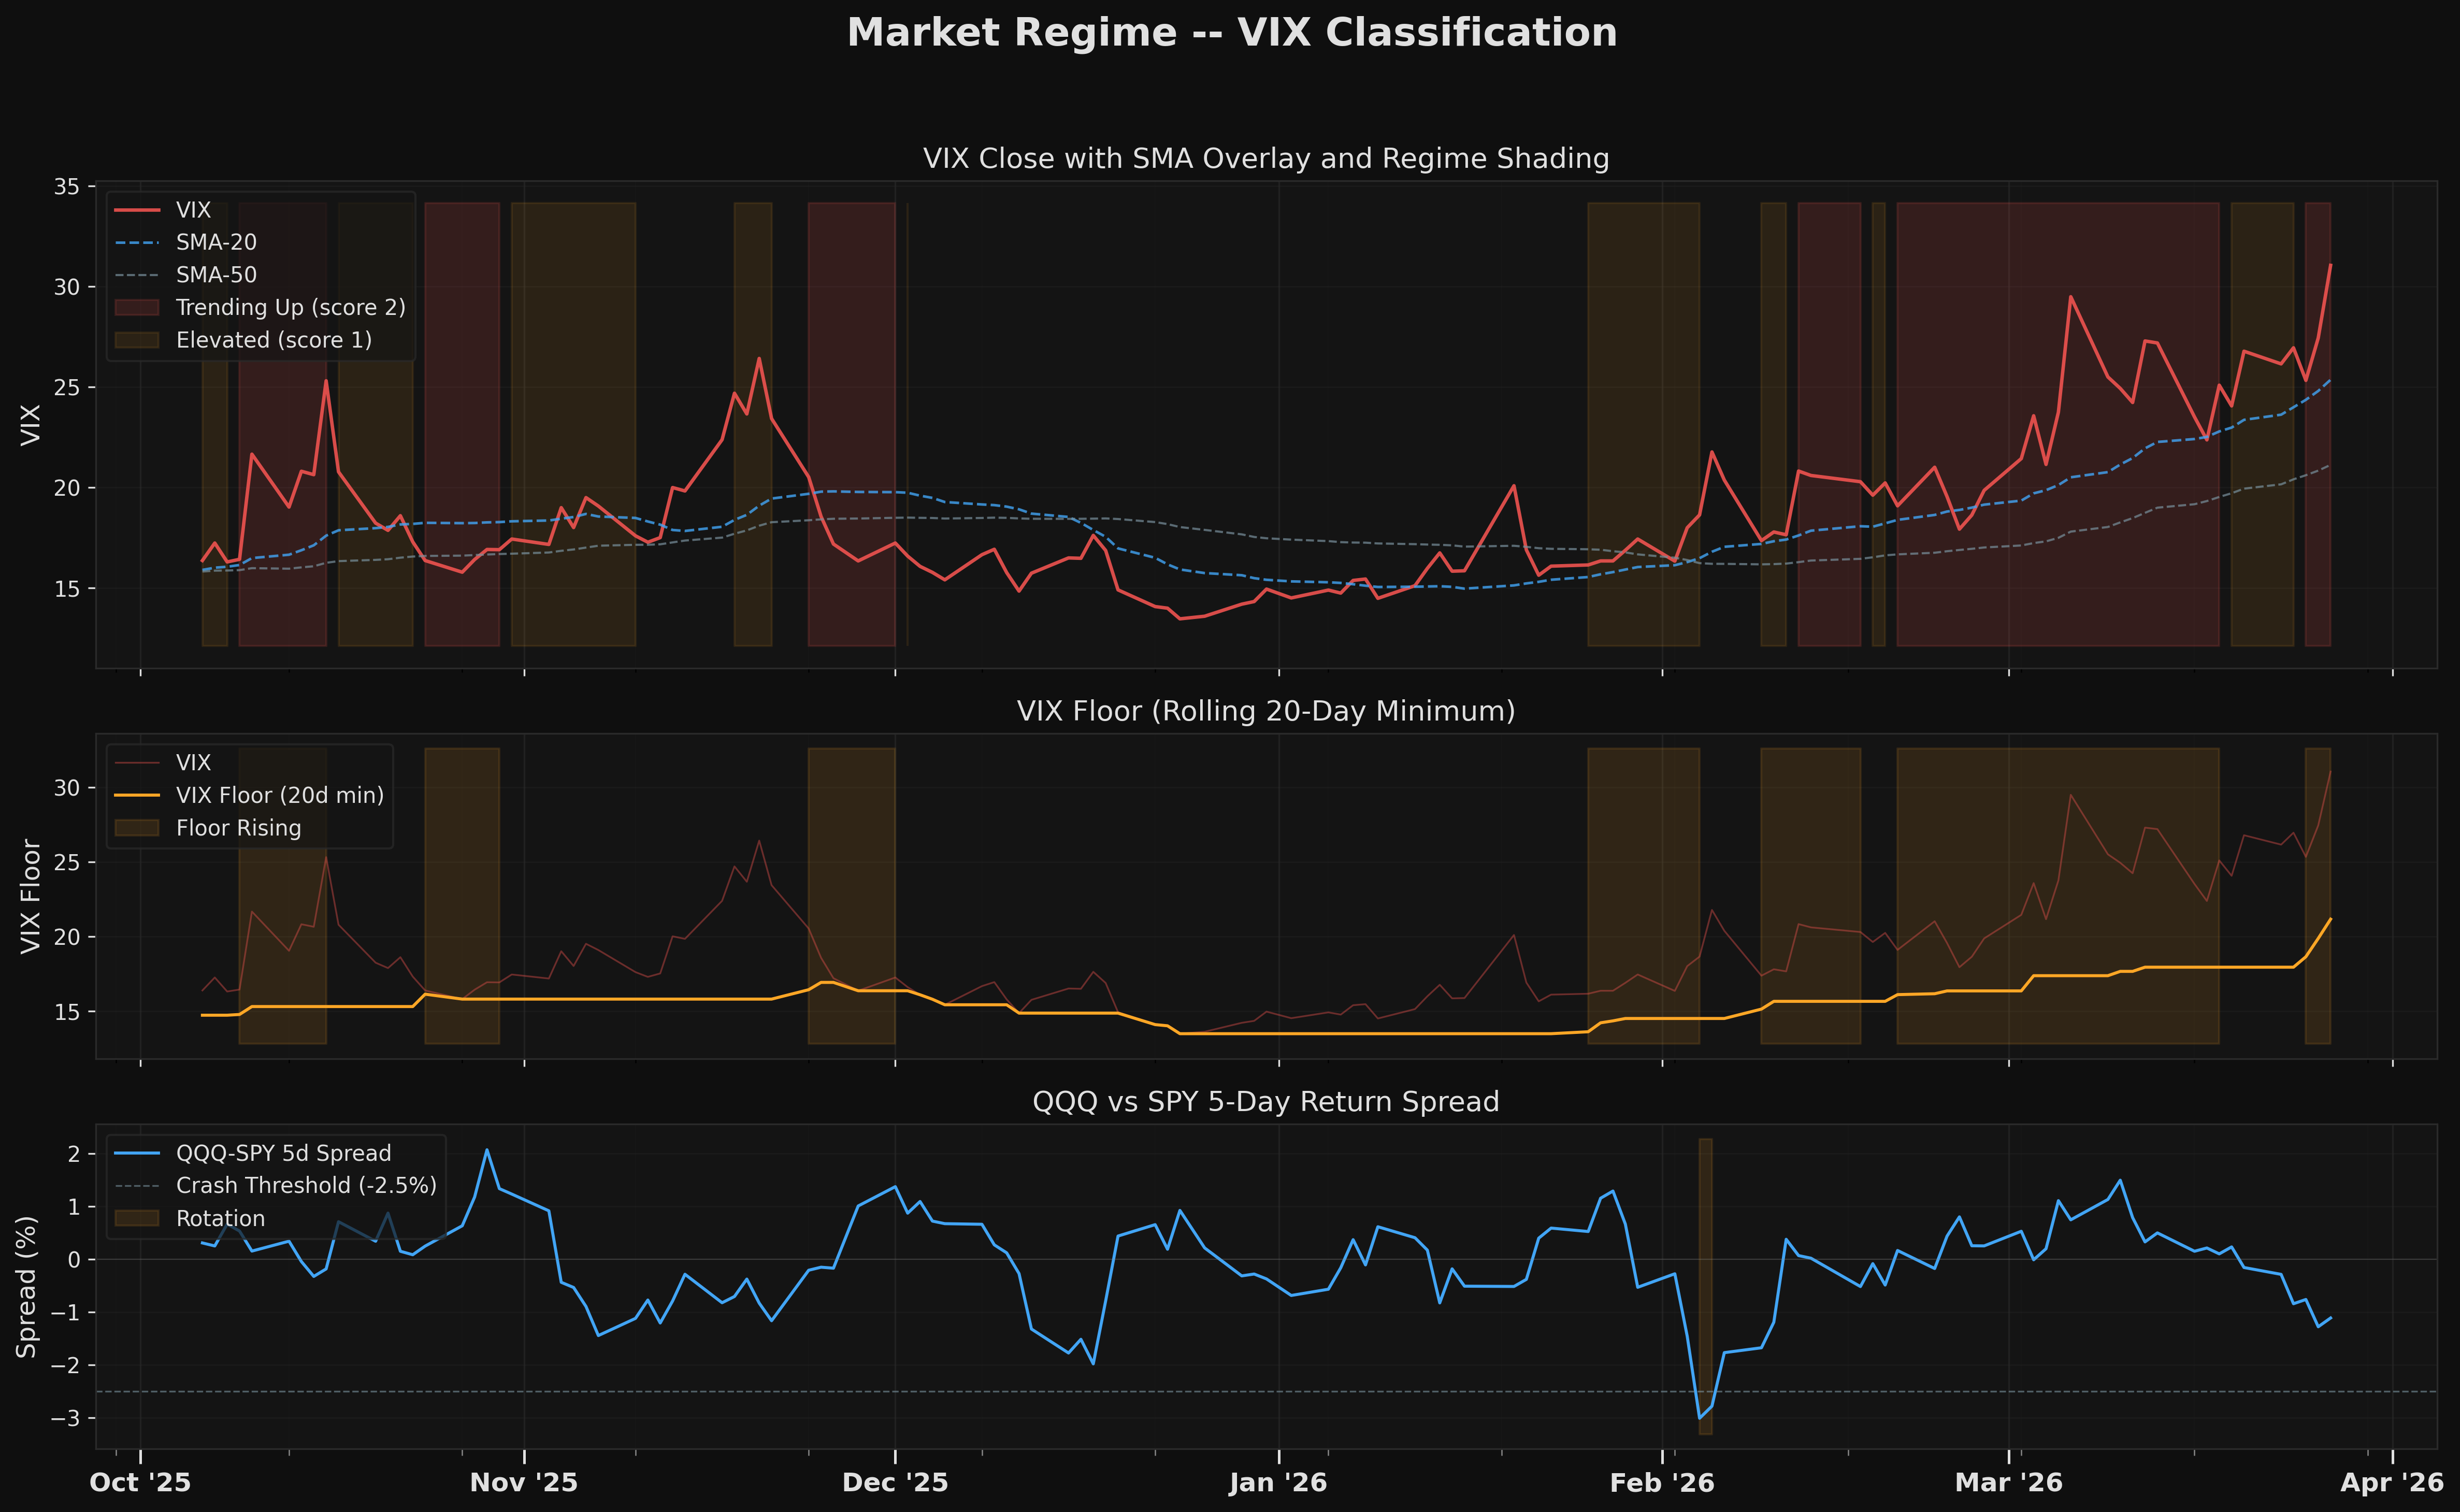
trend: rising / level: elevated
31 days trending
| Metric | Value |
|---|---|
| VIX Close | 31.0 |
| SMA-20 | 25.4 |
| SMA-50 | 21.1 |
| SMA-20 > SMA-50 | Yes |
| Floor Rising | Yes |
| Trending Duration | 31 days |
Both conditions met: VIX SMA-20 (25.4) is above SMA-50 (21.1), confirming a sustained uptrend, AND the volatility floor is rising. This combination has persisted for 31 days. Historically, this regime is associated with the worst drawdowns (see COVID -33.9%, Rate Shock -10.7% below). Capital preservation is the priority.
Momentum Crash Status
No momentum crash active
| Metric | Value |
|---|---|
| QQQ-SPY 5d Spread | -1.11% |
| HYG Drawdown (20d) | -2.09% |
| Crash Threshold | -2.5% |
| Crash Active | No |
Historical Context
The table below shows what happened during prior volatility regime episodes. The current regime (rising + elevated) matches the worst historical outcomes. COVID and Rate Shock both started with the same signal pattern and produced double-digit drawdowns. The highlighted rows show matching regimes.
| Episode | Period | Vol Regime | Crash Type | SPY Outcome |
|---|---|---|---|---|
| COVID Crash | Feb-Apr 2020 | rising / elevated (30+ days) | liquidation | -33.9% peak drawdown |
| Growth Rotation | Mar 2021 | falling / calm | rotation | +3.6% 30d forward |
| Rate Shock | Apr 2022 | rising / elevated | liquidation | -10.7% 30d forward |
| Oct 2022 Stress | Sep-Oct 2022 | rising / elevated | none | -8.3% then reversal |
| 2019 Calm | H1 2019 | falling / calm (90%+) | none | +17.7% H1 |
Charts