Immune System
## Market Immune System — Deep Analysis
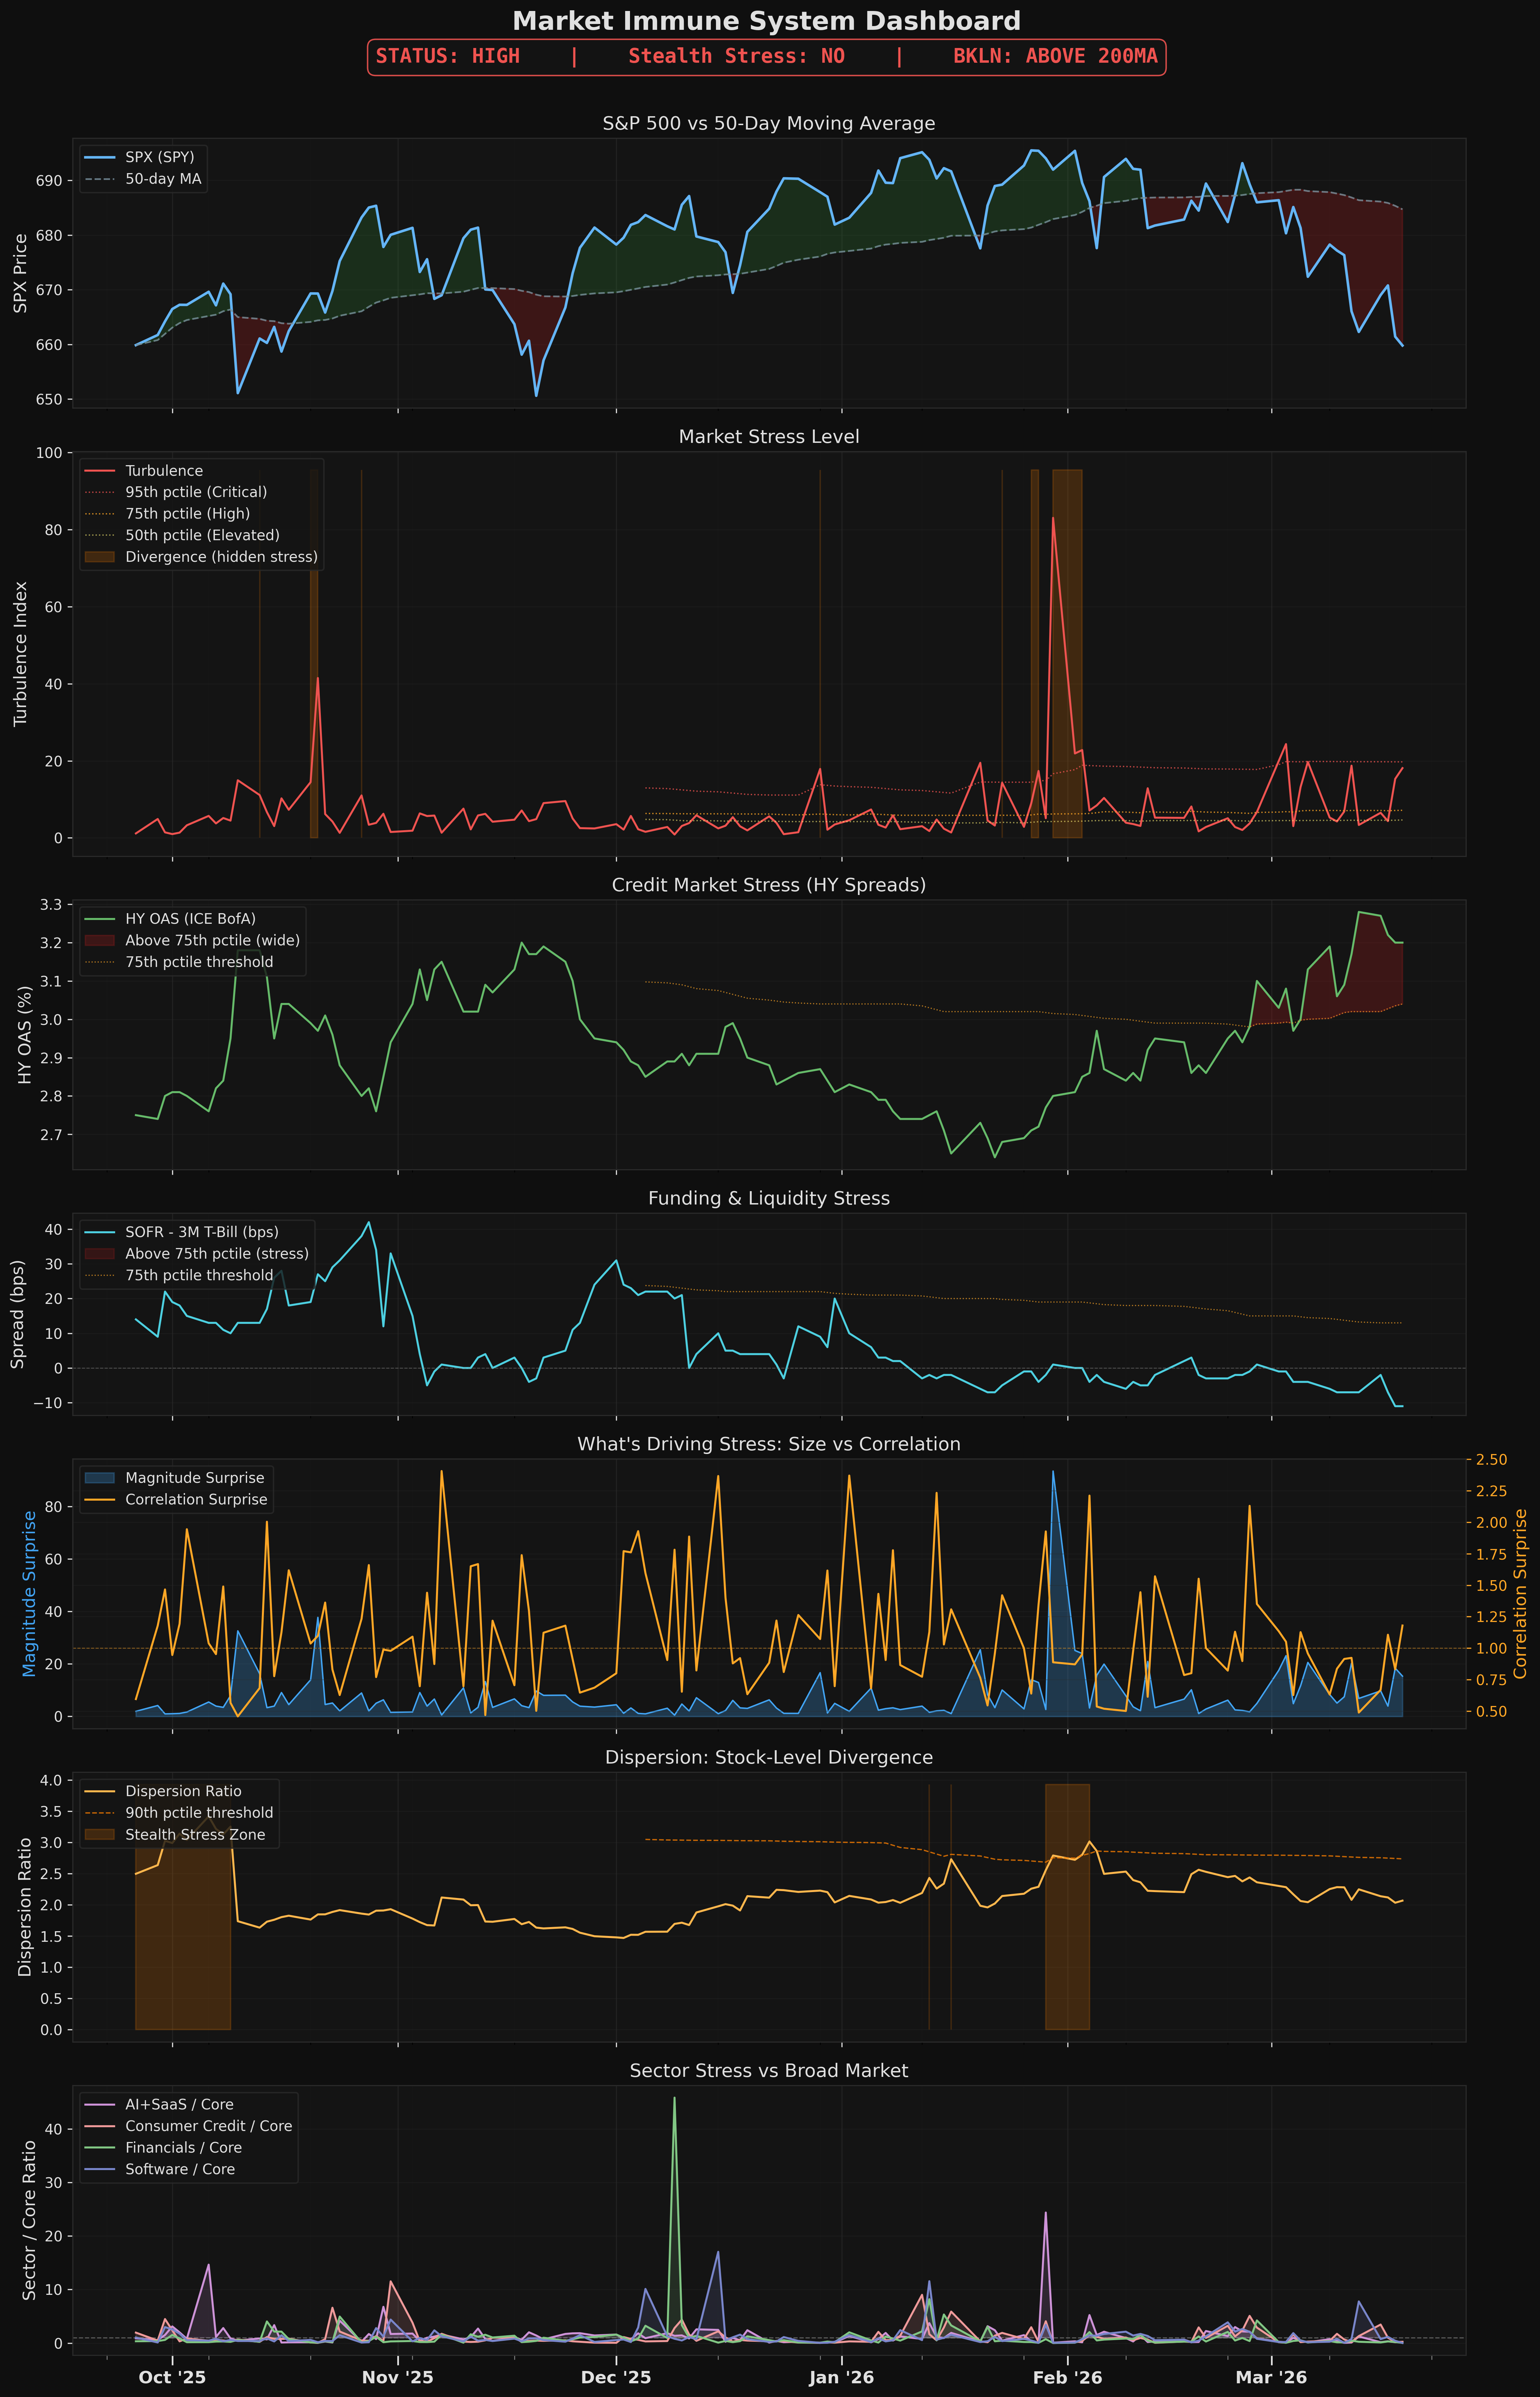
**Warning: HIGH | Turbulence Percentile: 91.0 | VIX: 26.8**
---
The turbulence score of 17.7 at the 91st percentile has now held at or above the 91st percentile for 3 consecutive days (March 19–22), following a sharp spike from the 48th percentile on March 17 — a compression of roughly 43 percentile points in a single session that marks this as a genuine regime break, not noise. The last comparable sustained cluster at the 91st+ percentile would need to be pulled from prior model history, but the trajectory data shows the market spent most of March 10–17 between the 25th and 69th percentiles, meaning this elevation is a discrete structural shift, not a continuation of pre-existing stress. The VIX at 26.8 sits in the elevated regime that has now persisted for 26 days, and critically, momentum_crash remains False — meaning the 26.8 VIX reflects systemic anxiety rather than a unidirectional collapse, which typically makes hedging more expensive and less directionally clean.
The Dispersion Ratio of 2.04 at the 62nd percentile is the most important nuance in this report: turbulence is high but dispersion is only moderate, which means the stress is being driven by **correlated cross-asset moves**, not sector-specific blow-ups. This is confirmed by the Correlation Surprise reading of 0.51 — assets that historically move independently are now moving together at above-average synchrony, which is the fingerprint of a macro-driven, liquidity-sensitive stress event rather than idiosyncratic earnings or sector rotation. Stealth Stress reads False, so the elevated turbulence is reflected in surface-level volatility and is not hidden beneath calm headline numbers.
Sector internals show the Financials Ratio at 0.05 — essentially the floor of observed readings — which is alarming given that Credit Stress composite sits at 78.1 with corporate credit stress at 92.4. A Financials Ratio this low while corporate credit registers at the 92nd percentile suggests financial sector equities are **not yet pricing** the credit deterioration that fixed income markets are already expressing; that gap is a cross-model amplification risk. The Software Ratio at 0.24 and AI Sector Ratio at 0.15 with an AI Sector Warning of NORMAL indicate neither tech subsector is leading the stress, but at a Breadth Ratio of 0.99 — near parity between advancing and declining issues — the market is not producing a clean defensive rotation, it is simply going sideways under pressure across nearly all names simultaneously.
BKLN trading above its 200-day MA is the one structural positive in this dataset: leveraged loan prices holding above trend suggests the 92.4 corporate credit stress reading is concentrated in spread widening rather than outright defaults or loan market seizure, which slightly limits systemic contagion risk at this moment but does not negate it given the consumer credit reading of 58.6 adding a secondary stress layer. The open position book reflects the regime directly: FETH at -21.9% and ETHT (second position) at -15.9% are taking the full force of correlated crypto drawdown that a 0.51 Correlation Surprise and 91st percentile turbulence would predict, while GDDY at -9.7% and VVV-USD at -15.5% indicate the broad risk-off is not sparing non-crypto names. The FBTC position at +6.0% and UFO at +0.4% are the only names with positive attribution, and given that BTC has historically decorrelated from ETH under liquidity stress, the FBTC resilience may be more about BTC-specific flows than a market stabilization signal.
A **downgrade to CRITICAL** would be triggered by the turbulence percentile breaking above 95, the Dispersion Ratio expanding above 2.5 (signaling sector-specific stress layering onto systemic stress), or a BKLN break below the 200-day MA which would confirm loan market deterioration matching the 92.4 corporate credit reading. An **upgrade toward MODERATE** requires the turbulence percentile to drop below 75 for at least 2 consecutive sessions — the trajectory from March 10–14 (25th–35th percentile) shows the model can recover quickly, but the 3-day lock at 91 with no mean reversion yet suggests the catalyst driving correlation surprise at 0.51 has not resolved.
STATUS: HIGH
Cross-asset turbulence is well above normal, indicating the market is in a stressed regime. Historically, high turbulence marks drawdown troughs more often than onsets (mean-reversion effect). Check the credit stress signal for forward risk assessment.
What does this mean?
The market is under significant stress. Multiple types of investments are moving in unusual, correlated ways — like when everything sells off together. Historically, this level of stress actually marks the worst of the selloff more often than the start of one. But if credit markets are also stressed (check the Credit Stress report), the combination is much more dangerous.
What's Driving It
- [CURRENT STATE] ⬆ Turbulence HIGH -- cross-asset stress well above normal Measures how many different investments are moving in unusual ways at the same time — like a fever thermometer for the whole market
- [CURRENT STATE] ○ Dispersion NORMAL -- names moving in line with the index Tracks whether individual stocks are moving together or going in wildly different directions. High dispersion under a calm surface is a hidden warning sign
- [CURRENT STATE] ○ Software NORMAL -- software stress in line with market Compares how much software/tech stocks are swinging versus the overall market. When this sector is stressed beyond normal, it often spreads
- [CURRENT STATE] ○ Credit Spreads NORMAL -- no contagion in HY yet Measures how nervous lenders are about getting paid back. When the gap between risky and safe bonds widens, it means investors are worried about companies defaulting on their debt
- [CURRENT STATE] ○ Funding NORMAL -- repo/dollar markets stable Tracks the plumbing of the financial system — the short-term lending markets where banks borrow from each other. When this is stressed, the basic machinery of finance is under pressure
- [FORWARD-LOOK] ○ BKLN ABOVE 200-day MA -- leveraged loans stable Tracks risky corporate loans (the kind private equity firms use for buyouts). When this drops below its long-term average, it signals that stress is spreading from stocks into corporate debt — a serious escalation
- [CURRENT STATE] ○ Breadth NEUTRAL -- balanced participation Measures whether the whole market is moving together, or if gains are concentrated in just a few big stocks. Narrow breadth (only a few stocks going up) is a warning that the rally is fragile
INTERPRETATION
The market is in a highly stressed regime. Turbulence is high but this signal describes current conditions, not forward risk. Historically, high-turbulence periods show the strongest mean-reversion (best 21-day forward returns). However, if credit stress is also elevated, the combination has materially worse outcomes. Check credit stress.
In plain English
In plain English: the market is very stressed right now. The key question is whether this stress is contained to stocks or spreading to bonds and lending markets. Check the Credit Stress report — if it's also elevated, this becomes a much more serious warning. If credit is calm, history says this is often a good buying opportunity.
RECOMMENDED ACTIONS (HIGH)
- Dual-stress regime: turbulence High + credit stress HIGH -- historically MDD -4.42% vs -2.18% when neither stressed (Historical data shows this combination of signals leads to 2x worse drawdowns than normal)
- Reduce exposure in weakest positions: FETH (health: RED, PnL: -21.2%), GDDY (health: ORANGE, PnL: -10.2%), ETHT (health: ORANGE, PnL: -14.2%) (Start with positions already losing money or in poor health — they have the least cushion to absorb further losses)
- Positions near stops in dual-stress regime: DFISX (0.3% from stop), UAMY (1.2% from stop)
Detailed Metrics
Charts