Credit Stress
## Credit Stress Report — 2026-03-22
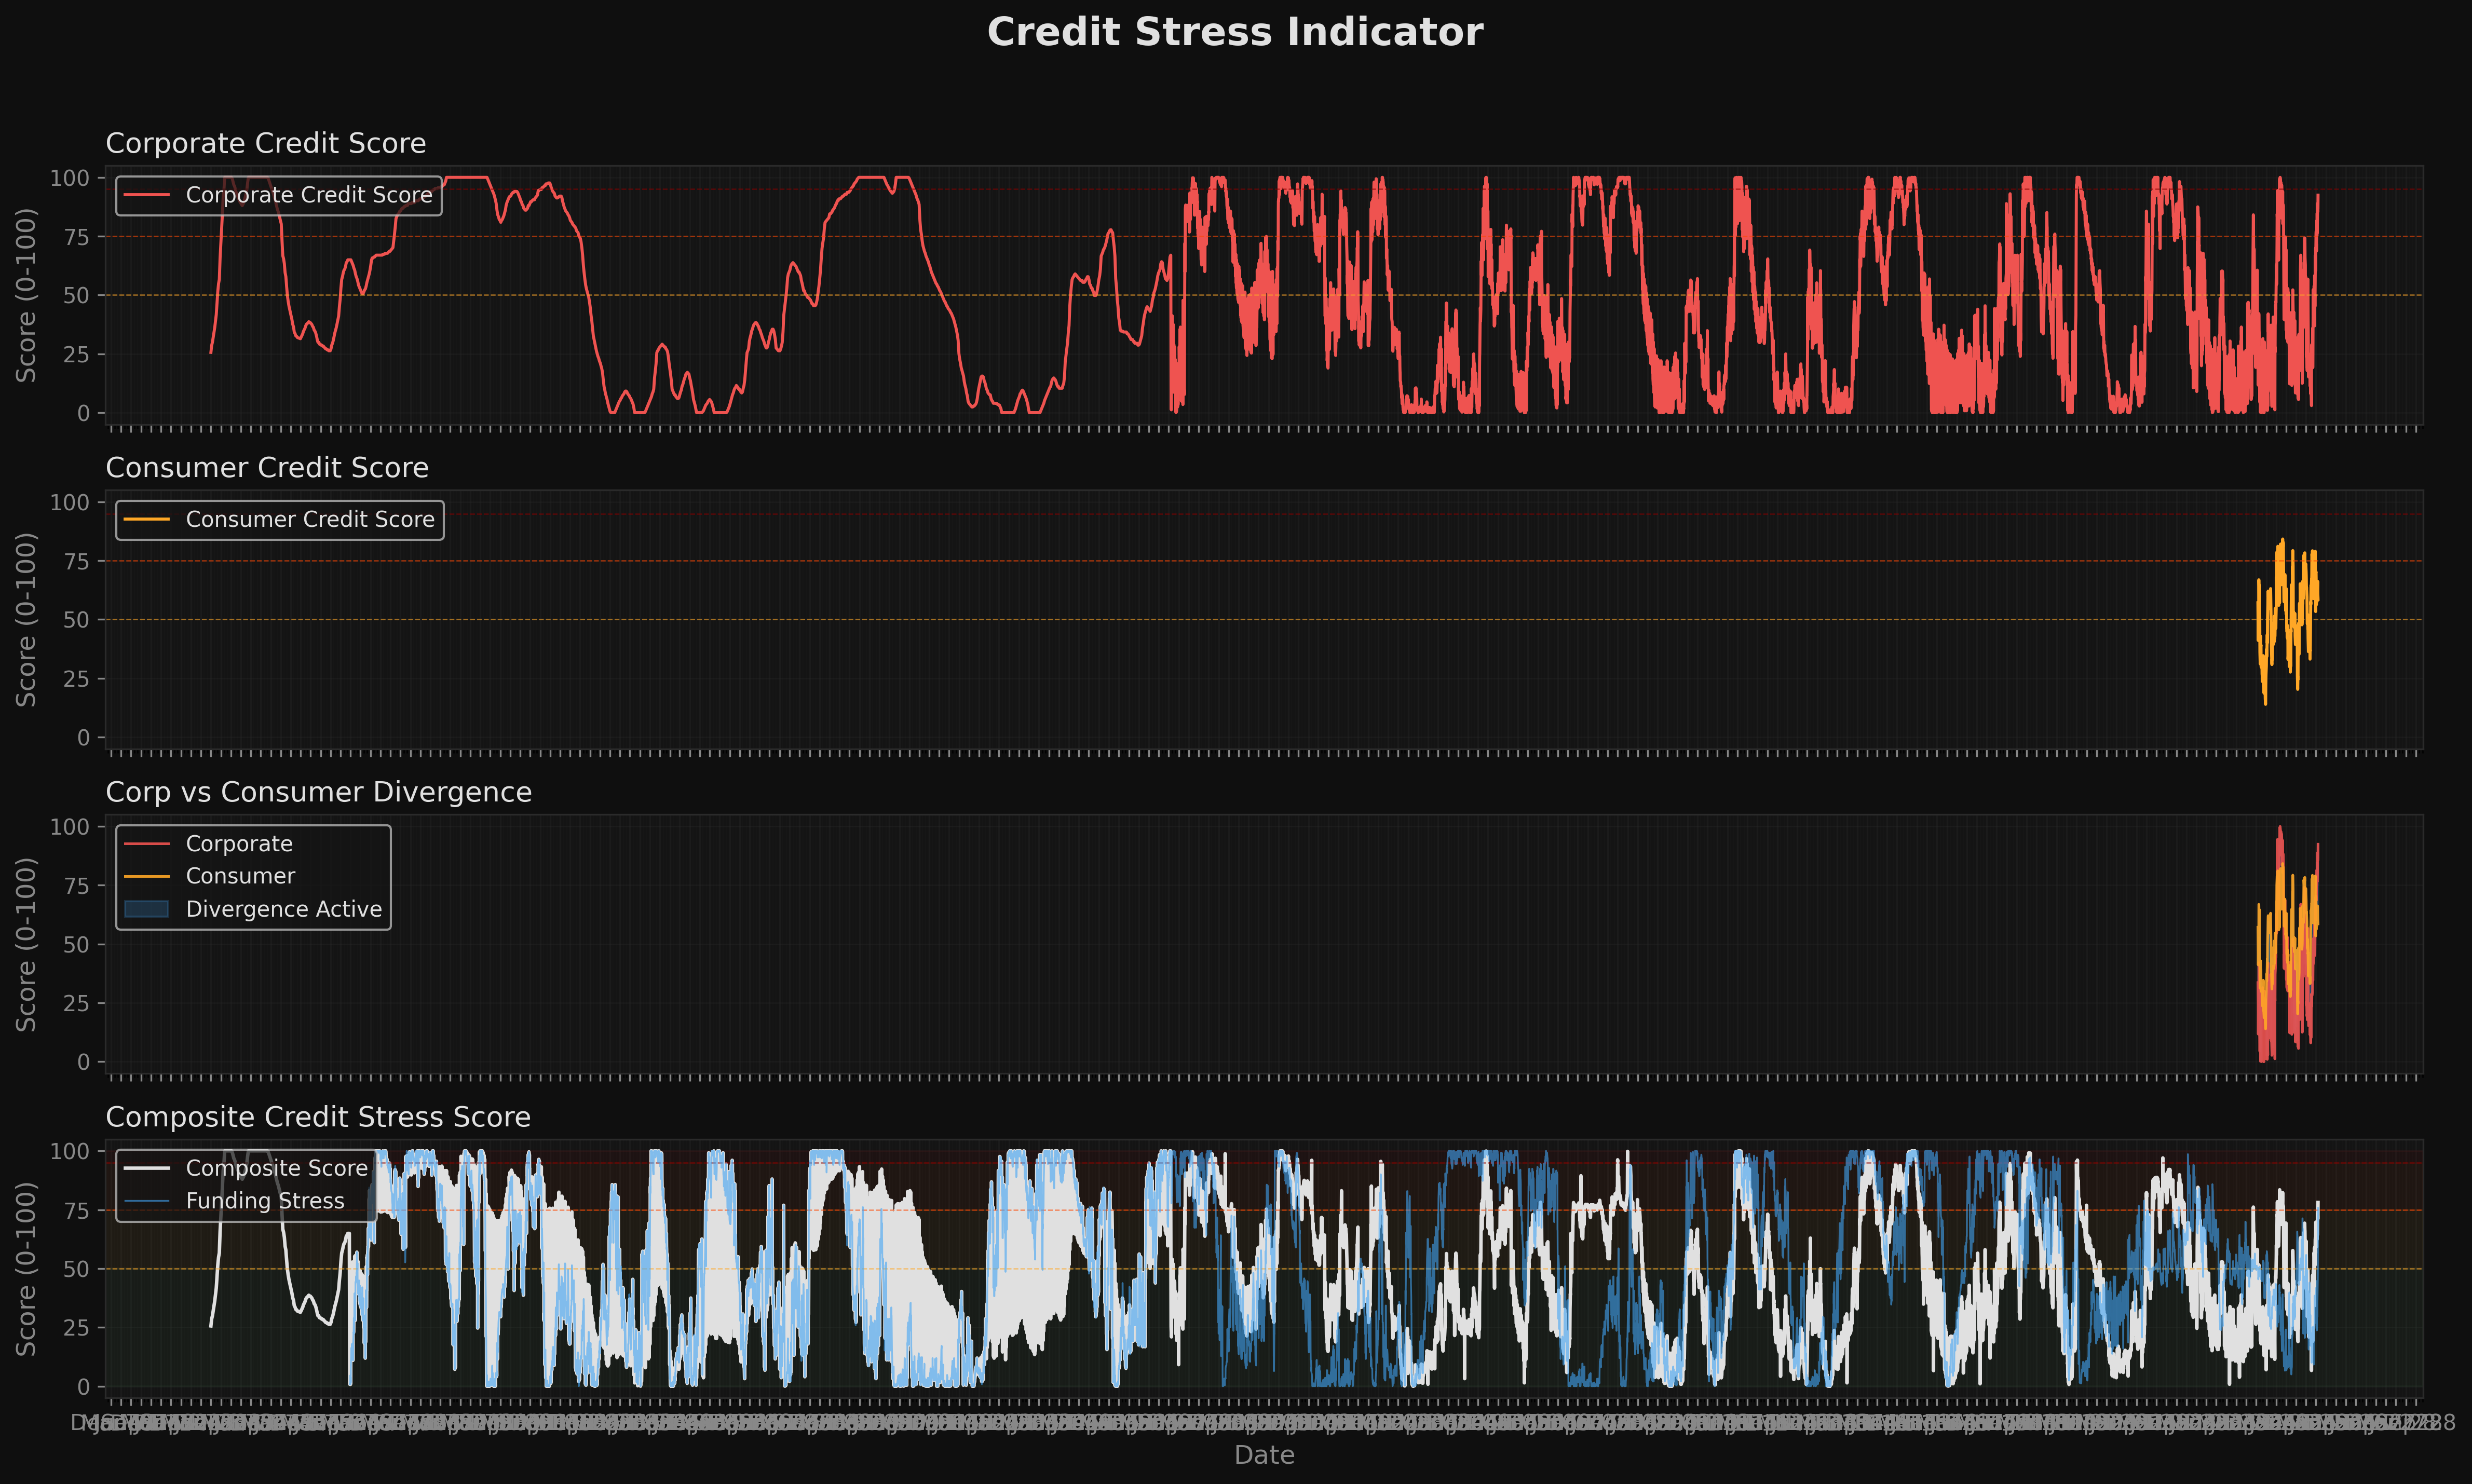
The composite credit stress score has surged from 51.3 on March 10 to 78.1 today, a 26.8-point escalation in 12 days, with the transition from ELEVATED to HIGH warning occurring sharply on March 19 when the composite crossed 80.2. The current 78.1 reading represents a slight pullback from that peak but the two consecutive identical readings (March 21–22) suggest the composite is consolidating at HIGH rather than reverting, making a near-term decline below 70 unlikely without a fundamental shift in corporate credit conditions.
The component breakdown reveals extreme internal dispersion: Corporate Score at 92.4 is nearly at maximum stress, Consumer Score sits at 58.6, and Funding Score registers 75.7 — creating a 33.8-point gap between Corporate and Consumer. This divergence is flagged explicitly (Divergence Detected: True), which is analytically significant because it indicates the stress is not yet economy-wide but is concentrated in corporate balance sheets and credit markets, with consumer credit lagging by 33.8 points. Historically, when Corporate leads Consumer by this magnitude at a HIGH composite, consumer deterioration tends to follow within 4–8 weeks as corporate stress transmits through employment and credit availability channels.
The CCS Score of 2 at SIGNIFICANT level is a forward-loading signal: it indicates that stress is sufficiently embedded across multiple sub-components to expect composite persistence above 75 for the next 1–3 months rather than a mean-reverting spike. A CCS of 2/SIGNIFICANT at this composite level historically precedes either stabilization near current levels or a further escalation toward 85+ if corporate conditions worsen — it does not historically precede rapid reversal.
Cross-model amplification is material: the Immune System is independently at HIGH warning with turbulence at the 91st percentile, confirming that current market microstructure stress is real and not a credit model artifact. The VIX at 26.8 in an elevated regime, without a momentum crash signal (False), suggests disorderly but not yet capitulatory conditions — meaning the 26.8 VIX could expand further before a flush, which would push funding stress above 75.7 and likely drag the composite above 80 again.
**Position-level implications are severe for the most stressed holdings.** FETH at -21.9% and ETHT (second position) at -15.9% are crypto-correlated exposures sitting at deep drawdowns during a period when corporate credit stress at 92.4 typically suppresses risk appetite across high-beta assets. VVV-USD at -15.5% and GDDY at -9.7% add further negative P&L concentration, meaning 4 of 8 positions are down more than 9.7% simultaneously with the composite at 78.1. The only positions with positive or negligible P&L — FBTC at +6.0%, UFO at +0.4%, ETHT at +0.1% — provide insufficient offset to the -15.9%, -21.9%, and -15.5% drawdowns.
A **composite upgrade** (move back toward ELEVATED, sub-65) would require the Corporate Score to retreat from 92.4 toward the 70s, most plausibly triggered by credit spread compression, a Fed pivot signal, or a strong investment-grade issuance window that relieves funding pressure from the current 75.7. A **composite downgrade** toward 85+ would be triggered by Consumer Score closing the current 33.8-point gap upward — if consumer credit deteriorates to the 75+ range, the divergence resolves to the downside and all three sub-scores align at HIGH simultaneously, a configuration this model has not registered in the current trajectory. At that point, CCS would likely escalate from 2 to 3, crossing into SEVERE territory, and the crypto and speculative equity positions currently at -15% to -22% would face structurally higher redemption and liquidity pressure.
[FORWARD-LOOKING RISK SIGNAL] Credit stress is the primary forward-looking indicator in the Signals system. Elevated readings (>50) correlate with deeper drawdowns over the next 1-3 weeks (Spearman rho = -0.23 with 21-day forward MDD).
Credit stress is high. Historically this correlates with materially worse forward outcomes. Reduce position sizes, tighten stops, raise cash.
Sub-Scores
Composite Capitulation Score (CCS)
The CCS measures market-wide capitulation by combining four independent stress indicators. Each fires independently; 3-4 firing simultaneously marks historical bottoming zones.
Regime Context (SLOOS Quarterly)
SLOOS data is quarterly. Values reflect bank lending standards, not incorporated into the daily composite score.
Private Credit Monitor
Private credit metrics are monitoring context only. They are NOT incorporated into the composite stress score.
Charts