Immune System
STATUS: HIGH
Cross-asset turbulence is well above normal, indicating the market is in a stressed regime. Historically, high turbulence marks drawdown troughs more often than onsets (mean-reversion effect). Check the credit stress signal for forward risk assessment.
What does this mean?
The market is under significant stress. Multiple types of investments are moving in unusual, correlated ways — like when everything sells off together. Historically, this level of stress actually marks the worst of the selloff more often than the start of one. But if credit markets are also stressed (check the Credit Stress report), the combination is much more dangerous.
What's Driving It
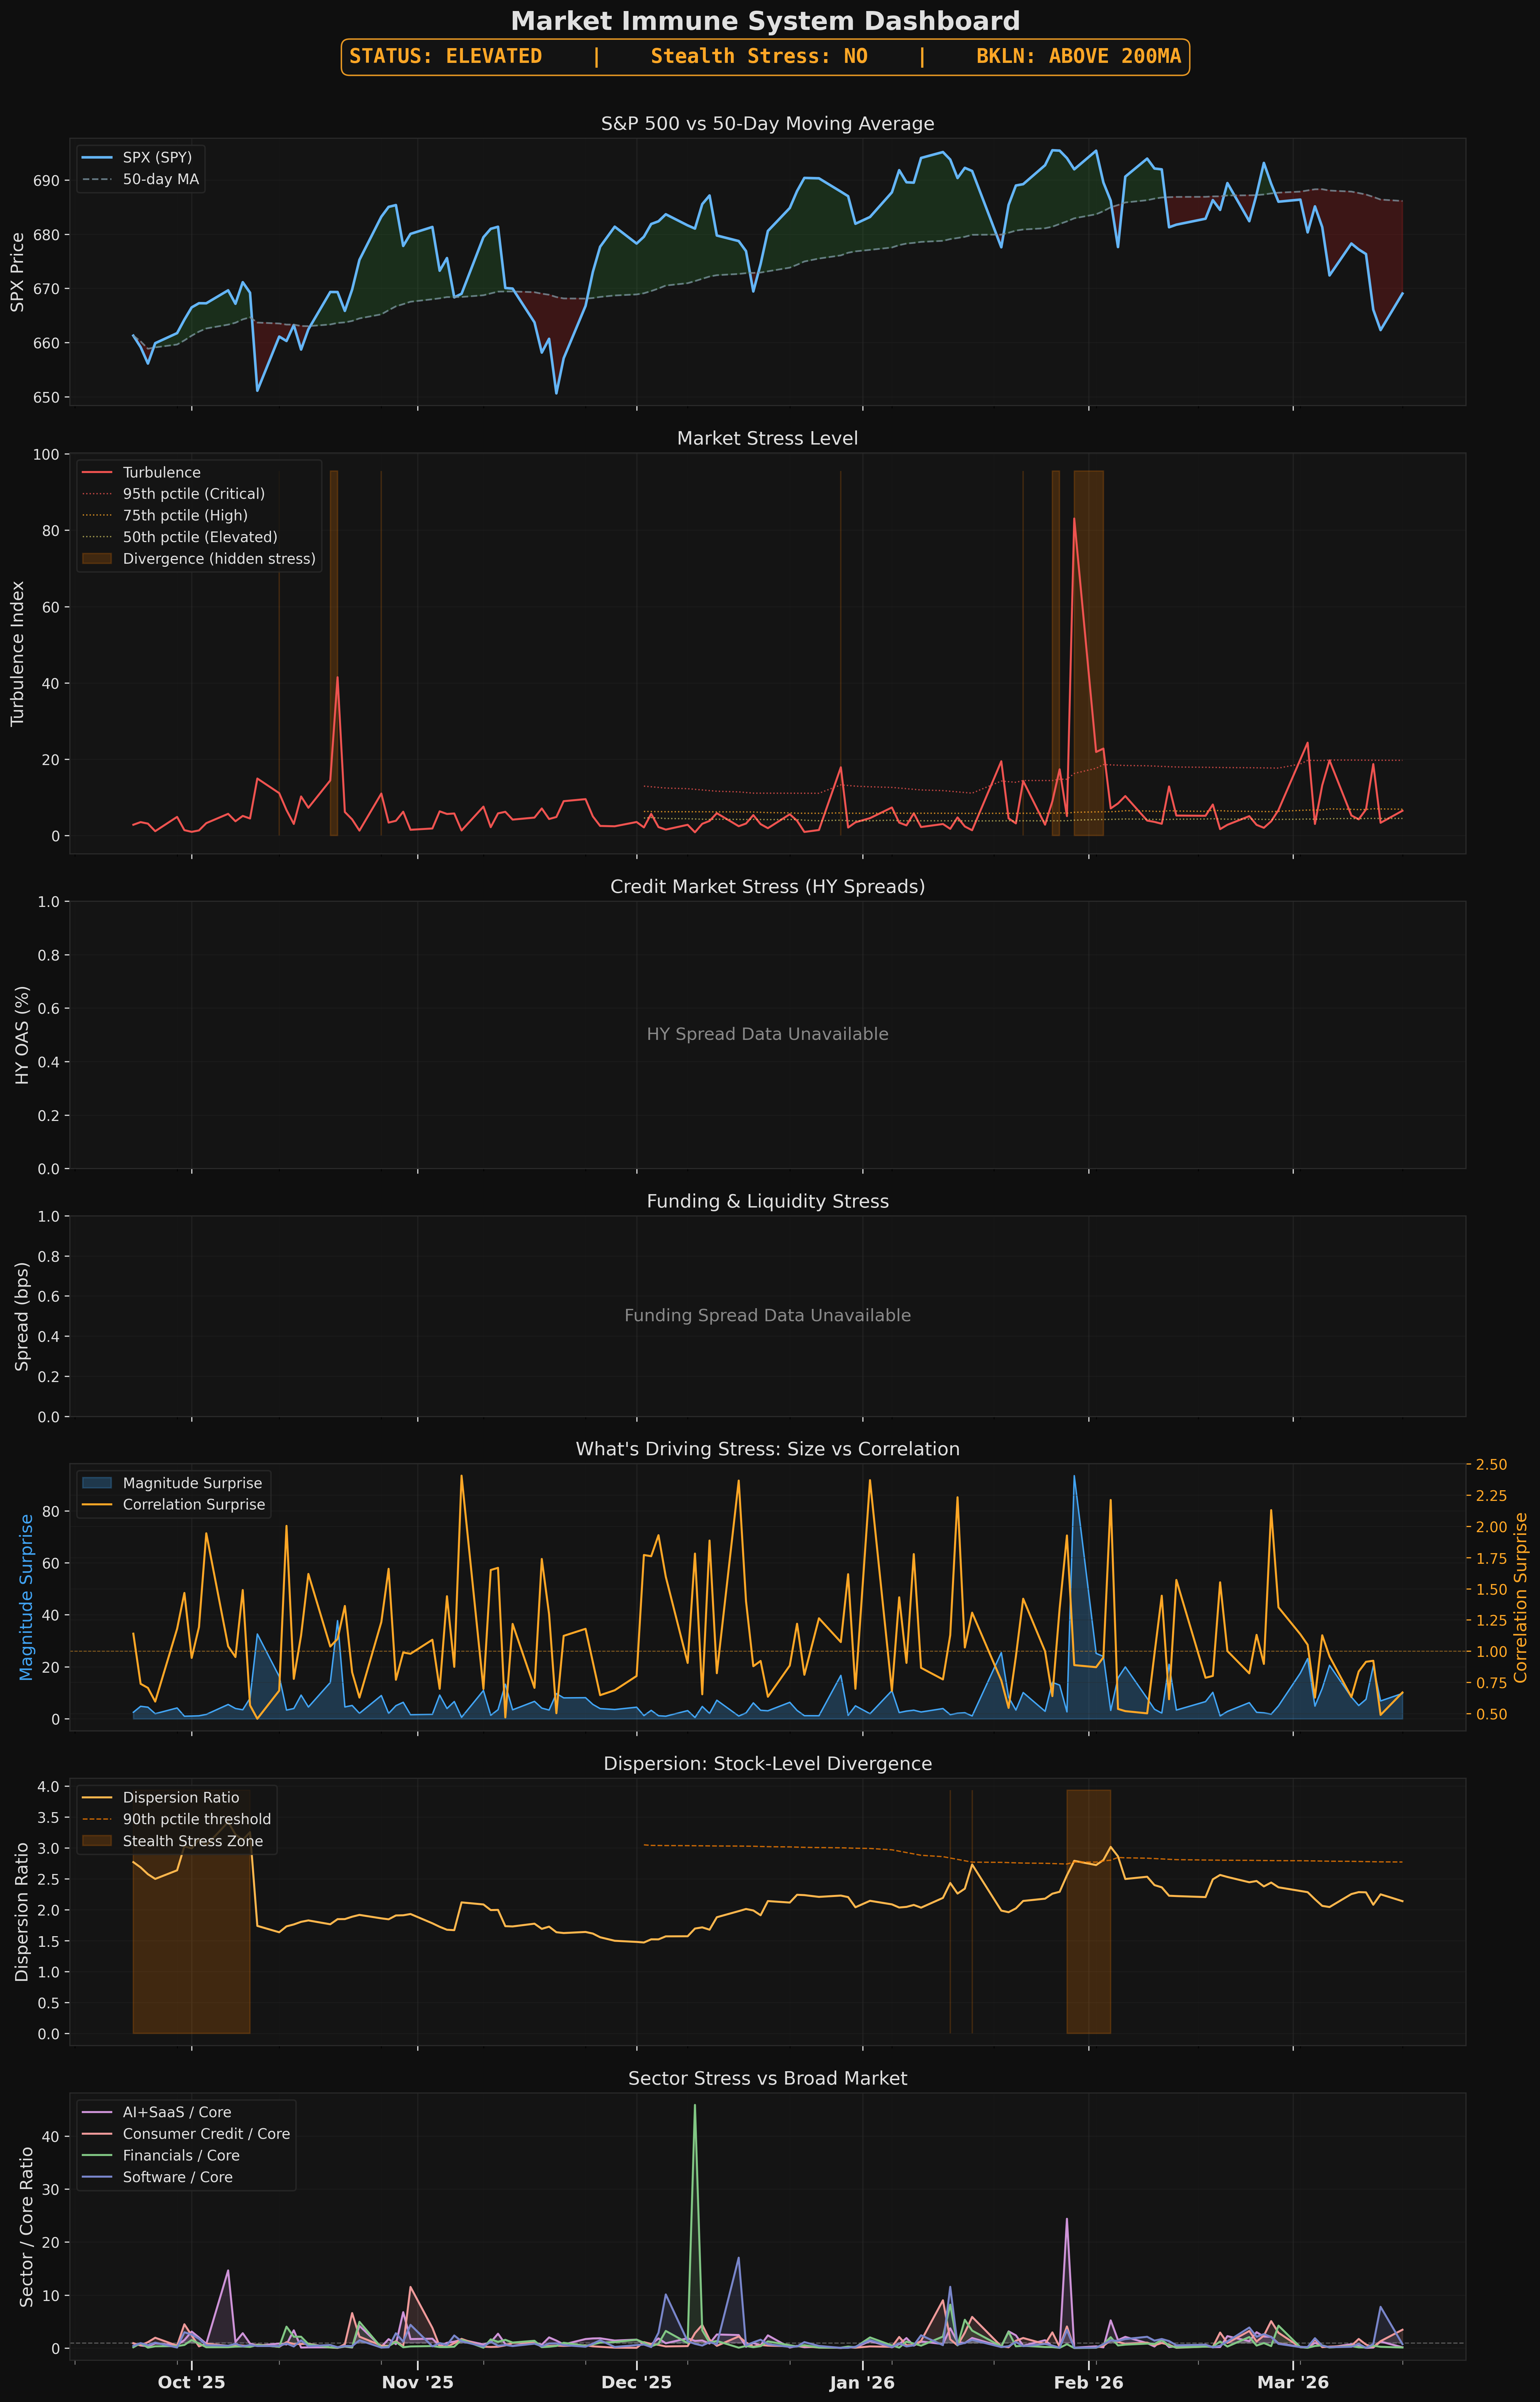
- [CURRENT STATE] ⬆ Turbulence HIGH -- cross-asset stress well above normal Measures how many different investments are moving in unusual ways at the same time — like a fever thermometer for the whole market
- [CURRENT STATE] ○ Dispersion NORMAL -- names moving in line with the index Tracks whether individual stocks are moving together or going in wildly different directions. High dispersion under a calm surface is a hidden warning sign
- [CURRENT STATE] ○ Software NORMAL -- software stress in line with market Compares how much software/tech stocks are swinging versus the overall market. When this sector is stressed beyond normal, it often spreads
- [FORWARD-LOOK] ○ BKLN ABOVE 200-day MA -- leveraged loans stable Tracks risky corporate loans (the kind private equity firms use for buyouts). When this drops below its long-term average, it signals that stress is spreading from stocks into corporate debt — a serious escalation
- [CURRENT STATE] ○ Breadth NEUTRAL -- balanced participation Measures whether the whole market is moving together, or if gains are concentrated in just a few big stocks. Narrow breadth (only a few stocks going up) is a warning that the rally is fragile
INTERPRETATION
The market is in a highly stressed regime. Turbulence is high but this signal describes current conditions, not forward risk. Historically, high-turbulence periods show the strongest mean-reversion (best 21-day forward returns). However, if credit stress is also elevated, the combination has materially worse outcomes. Check credit stress.
In plain English
In plain English: the market is very stressed right now. The key question is whether this stress is contained to stocks or spreading to bonds and lending markets. Check the Credit Stress report — if it's also elevated, this becomes a much more serious warning. If credit is calm, history says this is often a good buying opportunity.
RECOMMENDED ACTIONS (HIGH)
- Consider reducing position sizes
- Tighten trailing stops on all positions
- Raise cash allocation (Cash is the only asset that doesn't lose value in a crisis. Having cash ready means you can buy opportunities when the storm passes)
- Monitor daily for escalation to Critical
Detailed Metrics
Charts