Crypto Report
How to Read the Score
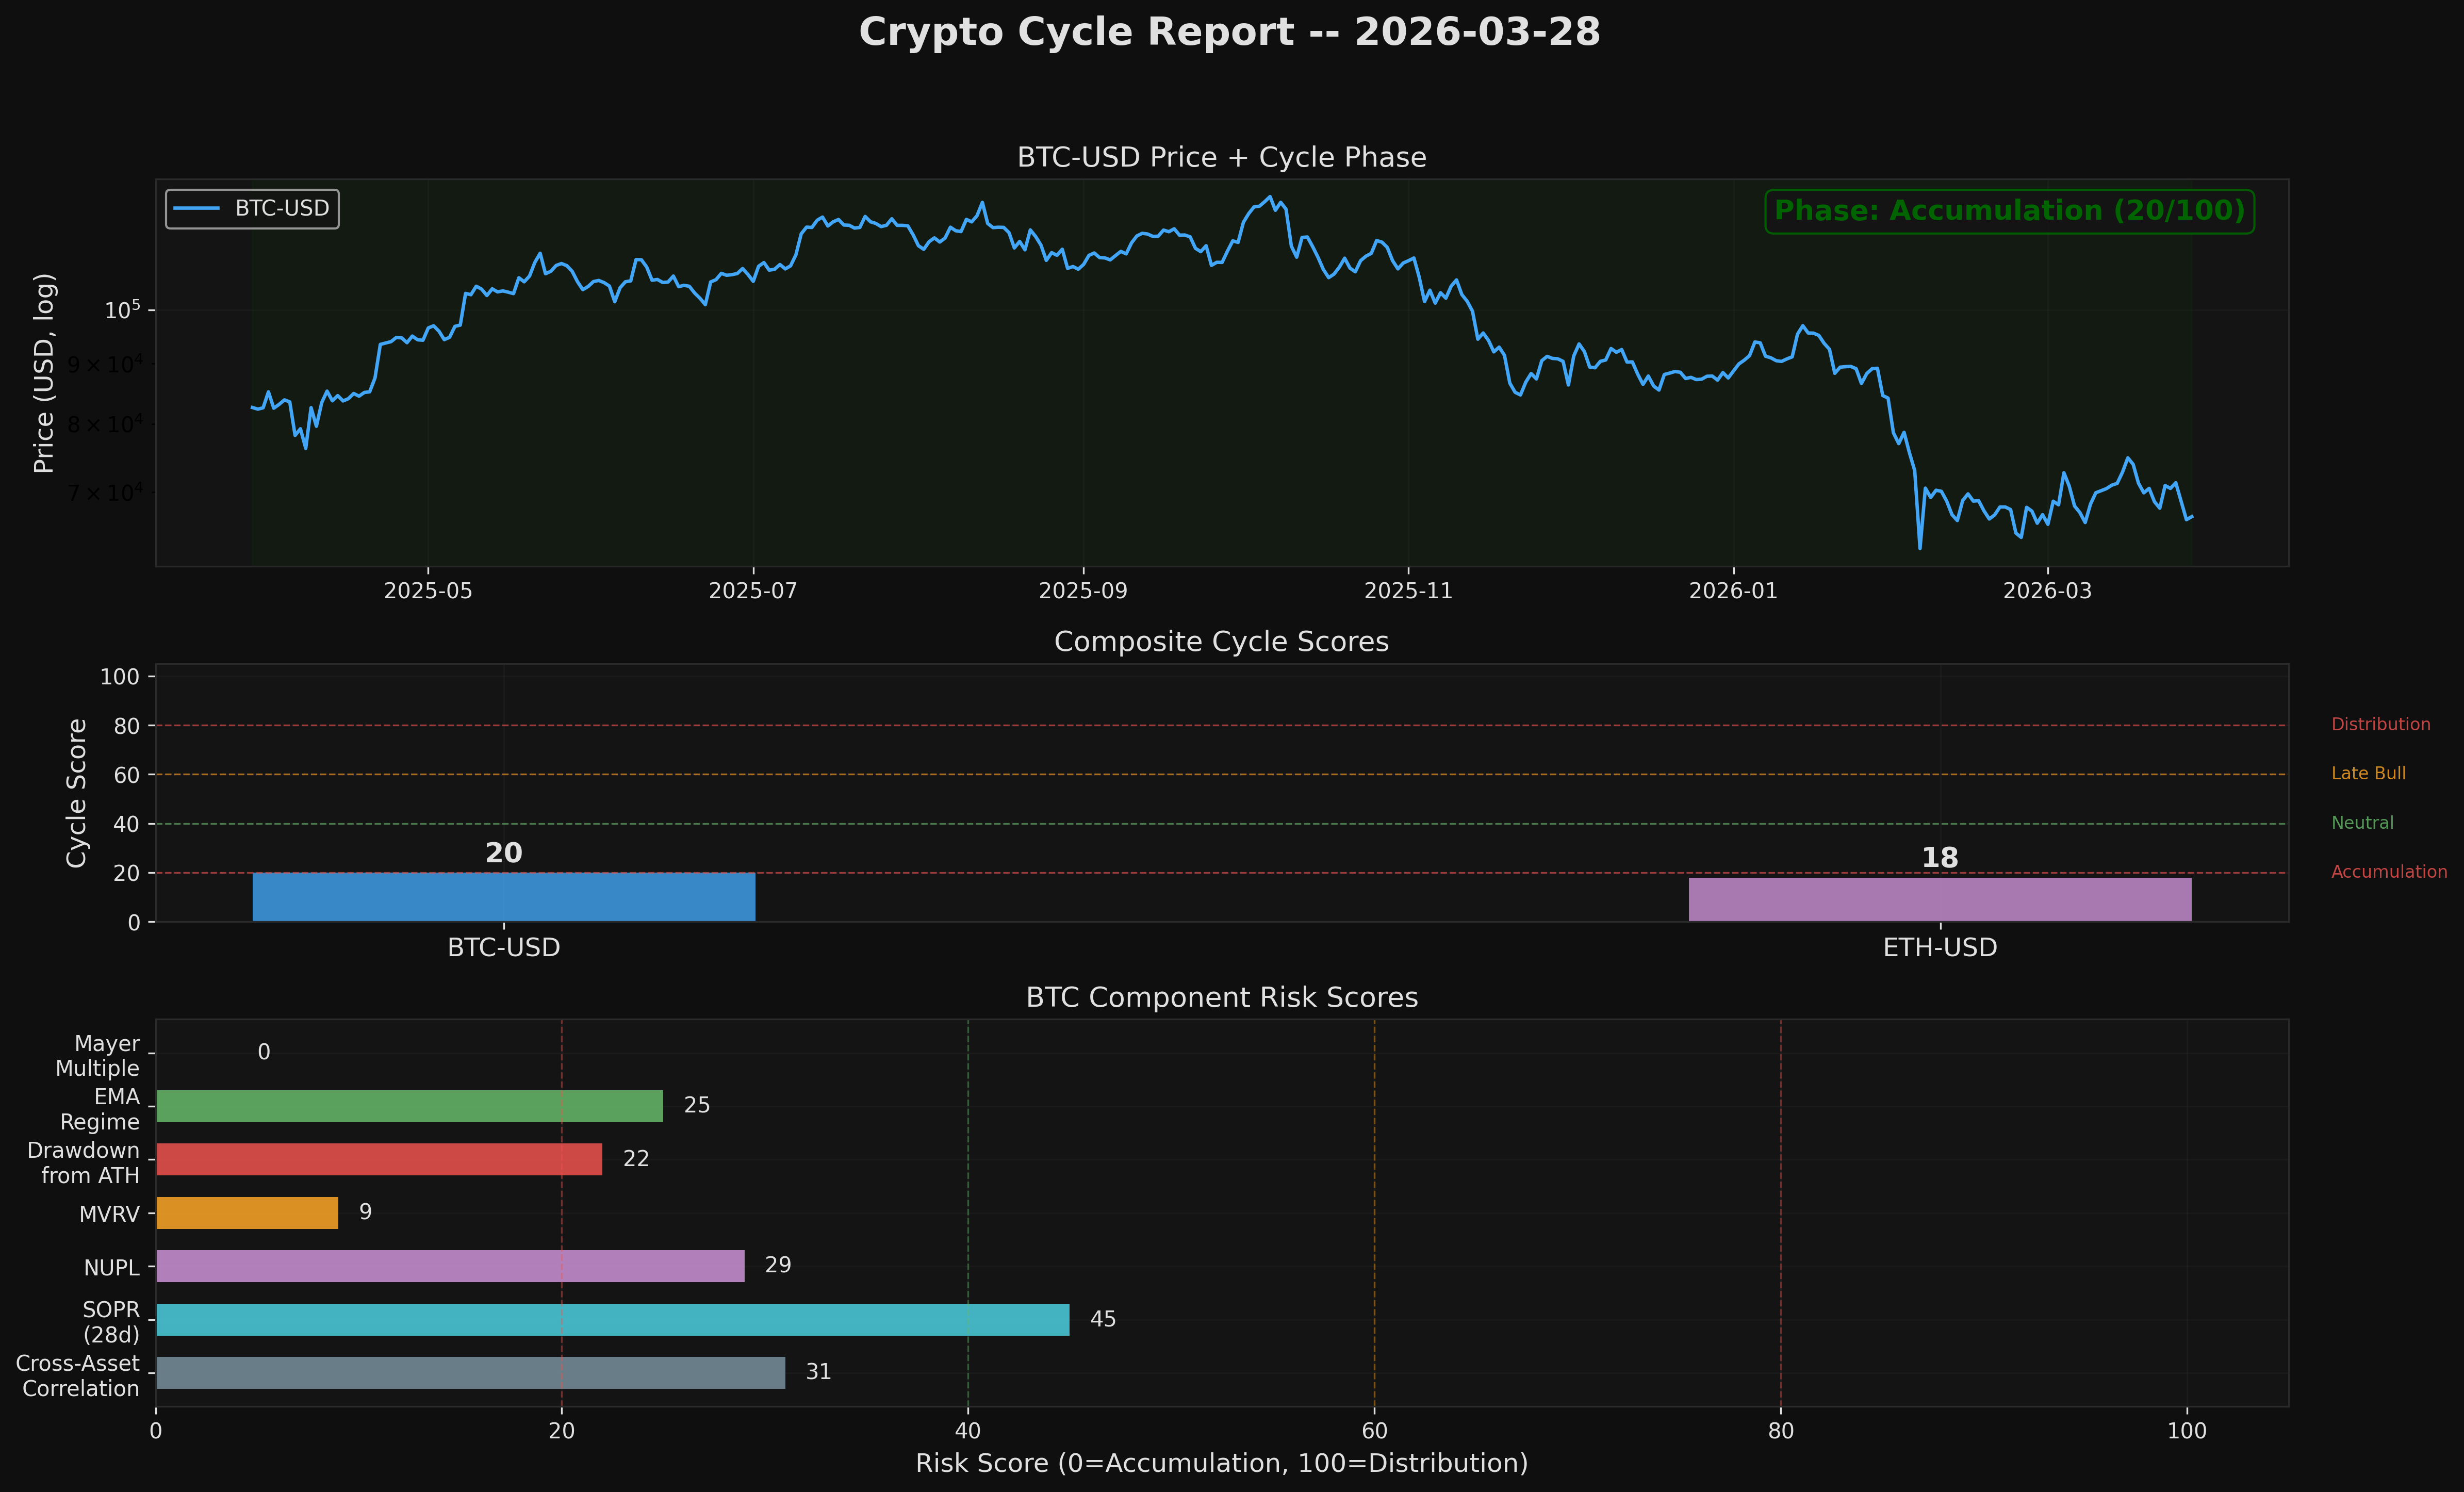
The composite score ranges from 0 to 100, where low = low risk = buying opportunity and high = high risk = distribution zone. A score of 22/100 is bullish, not broken.
BTC-USD
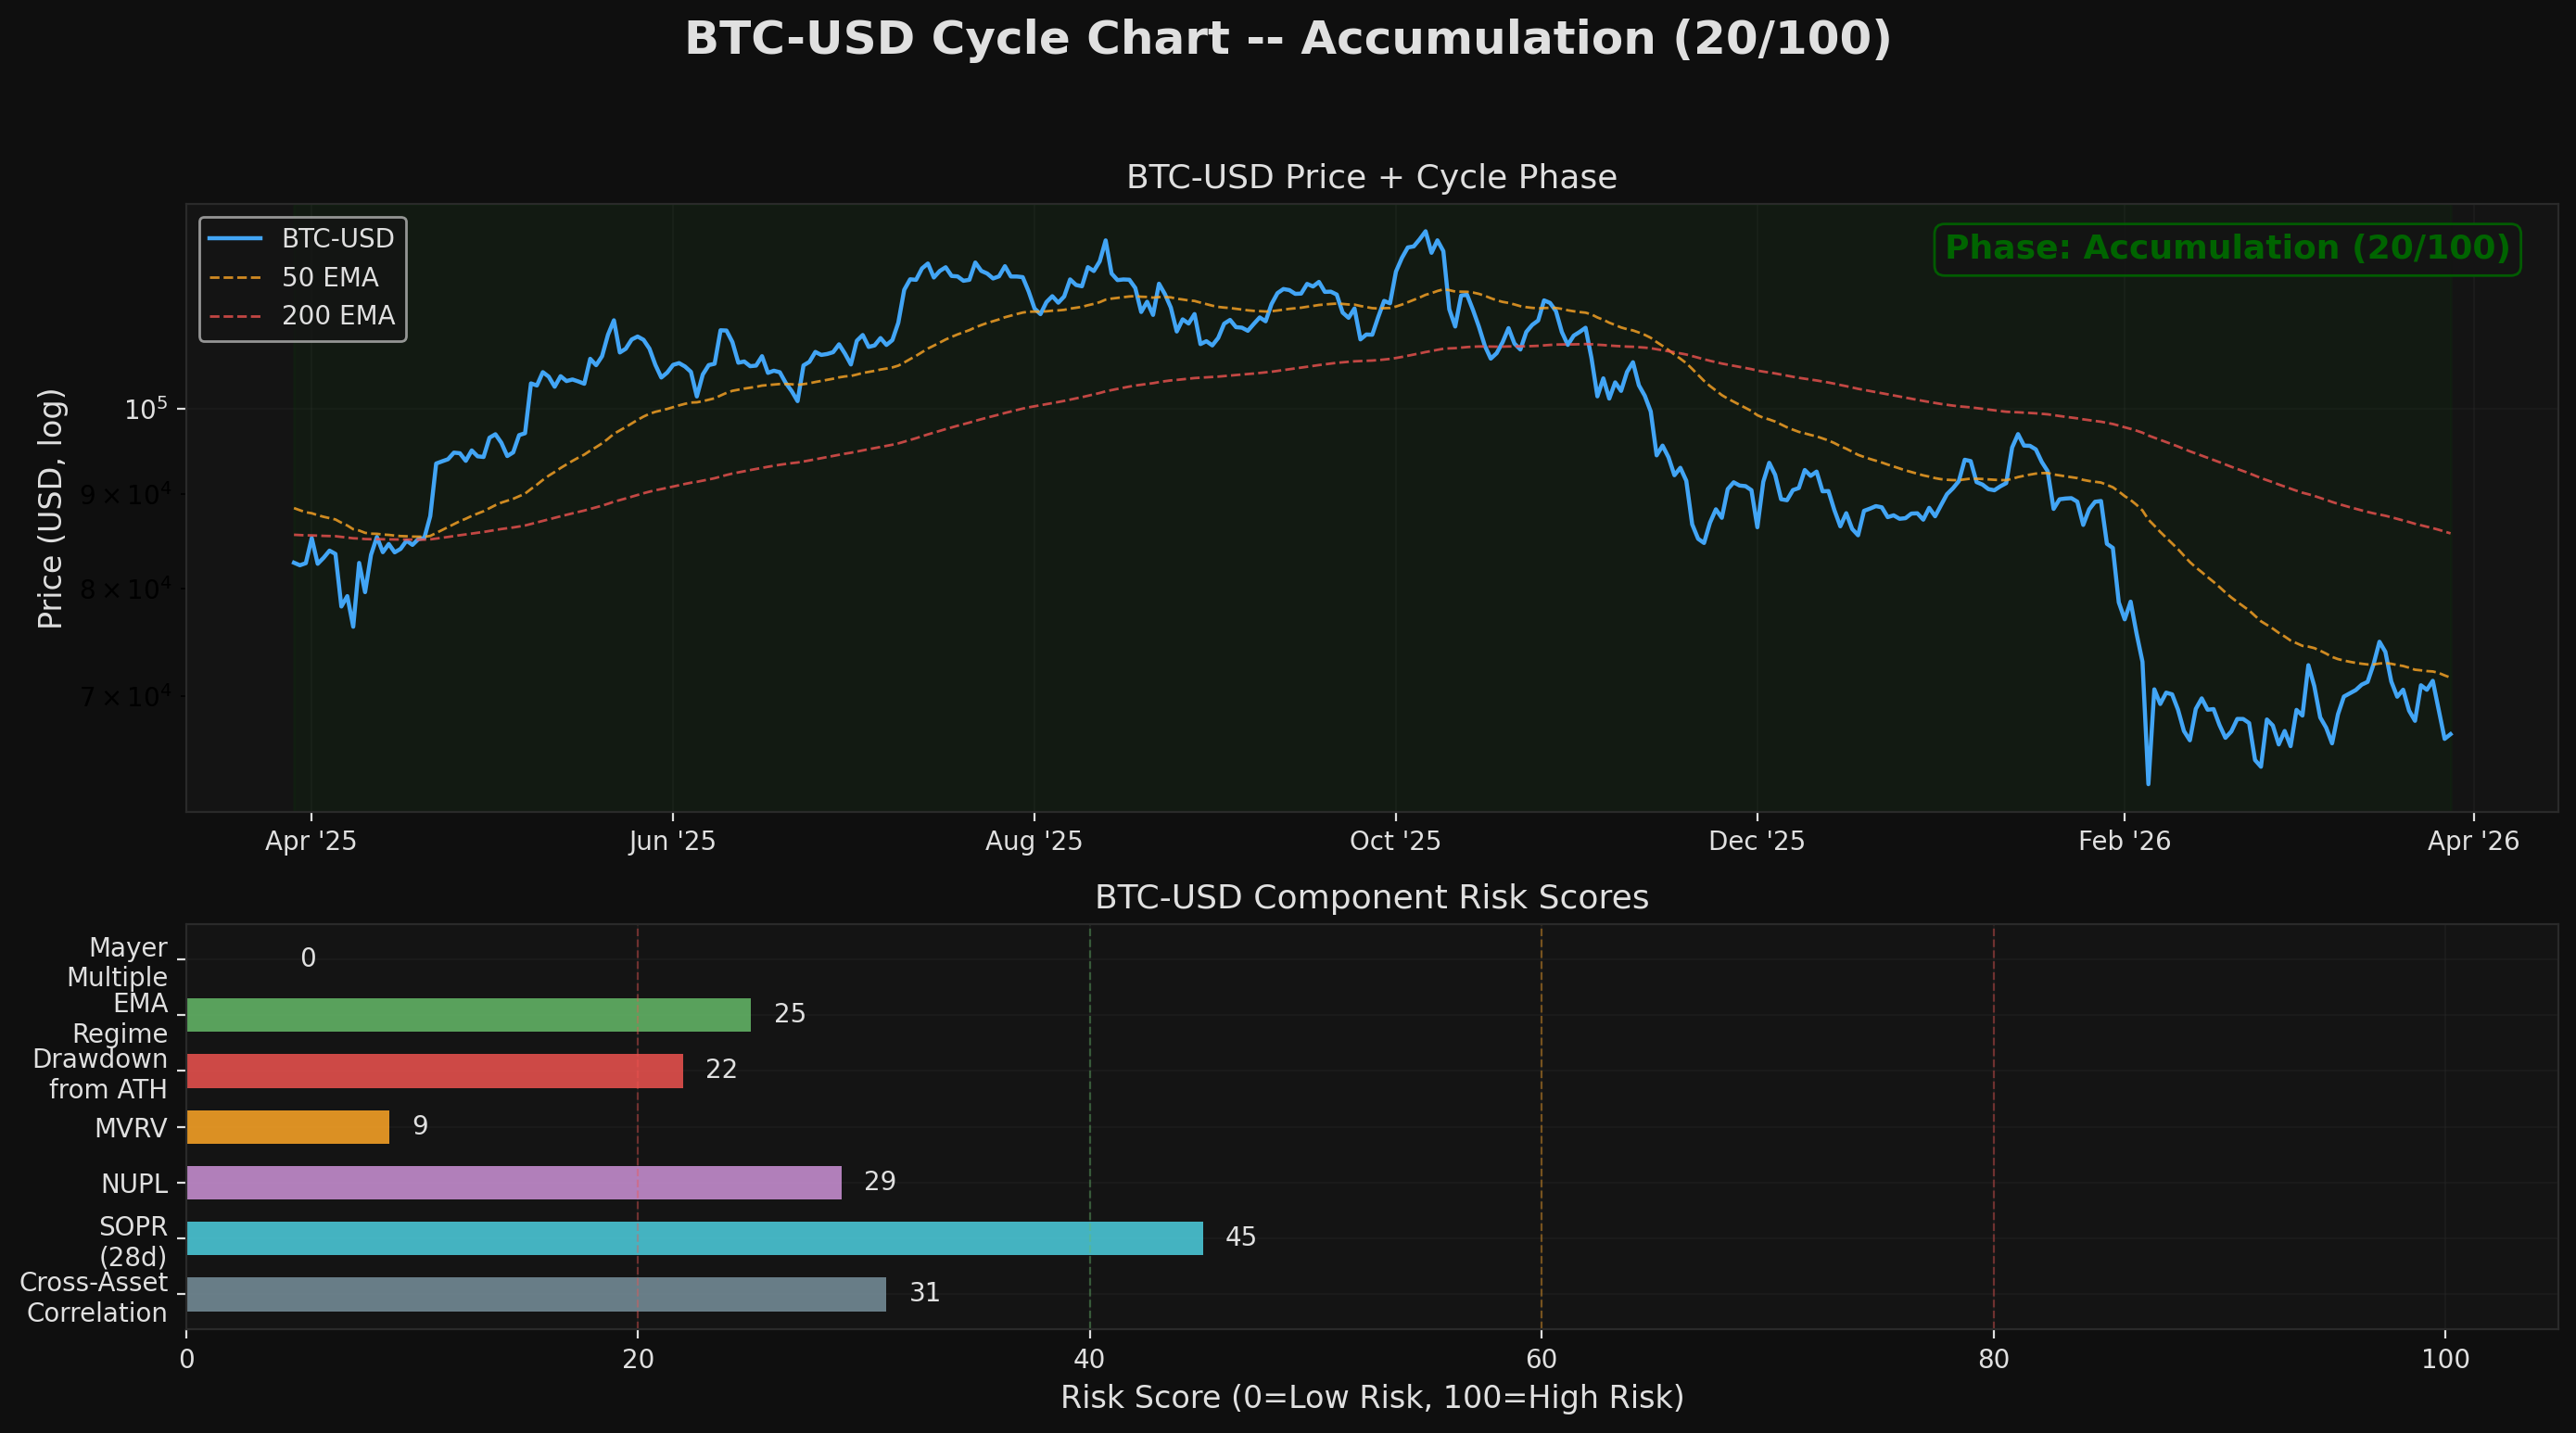
BTC-USD is in an accumulation phase -- 5 of 8 indicators point to below-average risk. The Mayer Multiple (0.73) shows price is 27% below its 200-day average, a level that has historically preceded rallies. On-chain metrics confirm: MVRV at 1.23 means the market isn't overheated. Price is 46.5% below its all-time high, a significant correction but historically recoverable. The main caution flag is the Bear EMA regime, meaning the trend is still down even as value builds. Score: 20/100 = very low risk, deep value zone.
Component Breakdown
| Signal | Value | Risk Score | Source |
|---|---|---|---|
|
Mayer Multiple
Price is 27% below its 200-day average -- historically a buying zone
|
0.731 (Oversold) | OHLCV | |
|
EMA Regime
Price is below both 50-day and 200-day moving averages -- trend is down
|
Bear | OHLCV | |
|
Drawdown from ATH
46.5% below all-time high -- significant correction, historically recoverable
|
-46.5% | OHLCV | |
|
MVRV
Market value is 23% above realized value -- moderate, not overheated
|
1.233 | api | |
|
NUPL
Network is slightly profitable -- far from euphoria levels
|
0.215 | api | |
|
SOPR
Coins are being spent at a slight loss on average -- typical of accumulation
|
0.9946 | api | |
|
Puell Multiple
Miners are earning below their yearly average -- revenue stress suggests reduced sell pressure
|
0.821 | api | |
|
Cross-Asset Corr
Crypto is strongly correlated with equities (0.52)
|
btc_spy=0.52, btc_dxy=-0.1 | OHLCV |
Context Overlay
- Immune System: CRITICAL
Turbulence: 10.13 | VIX: 31.0 | Consumer credit: NORMAL
- Credit Stress: HIGH (75.8/100)
Corporate: 96.4 | Consumer: 62.1 | Funding: 39.0
ETH-USD
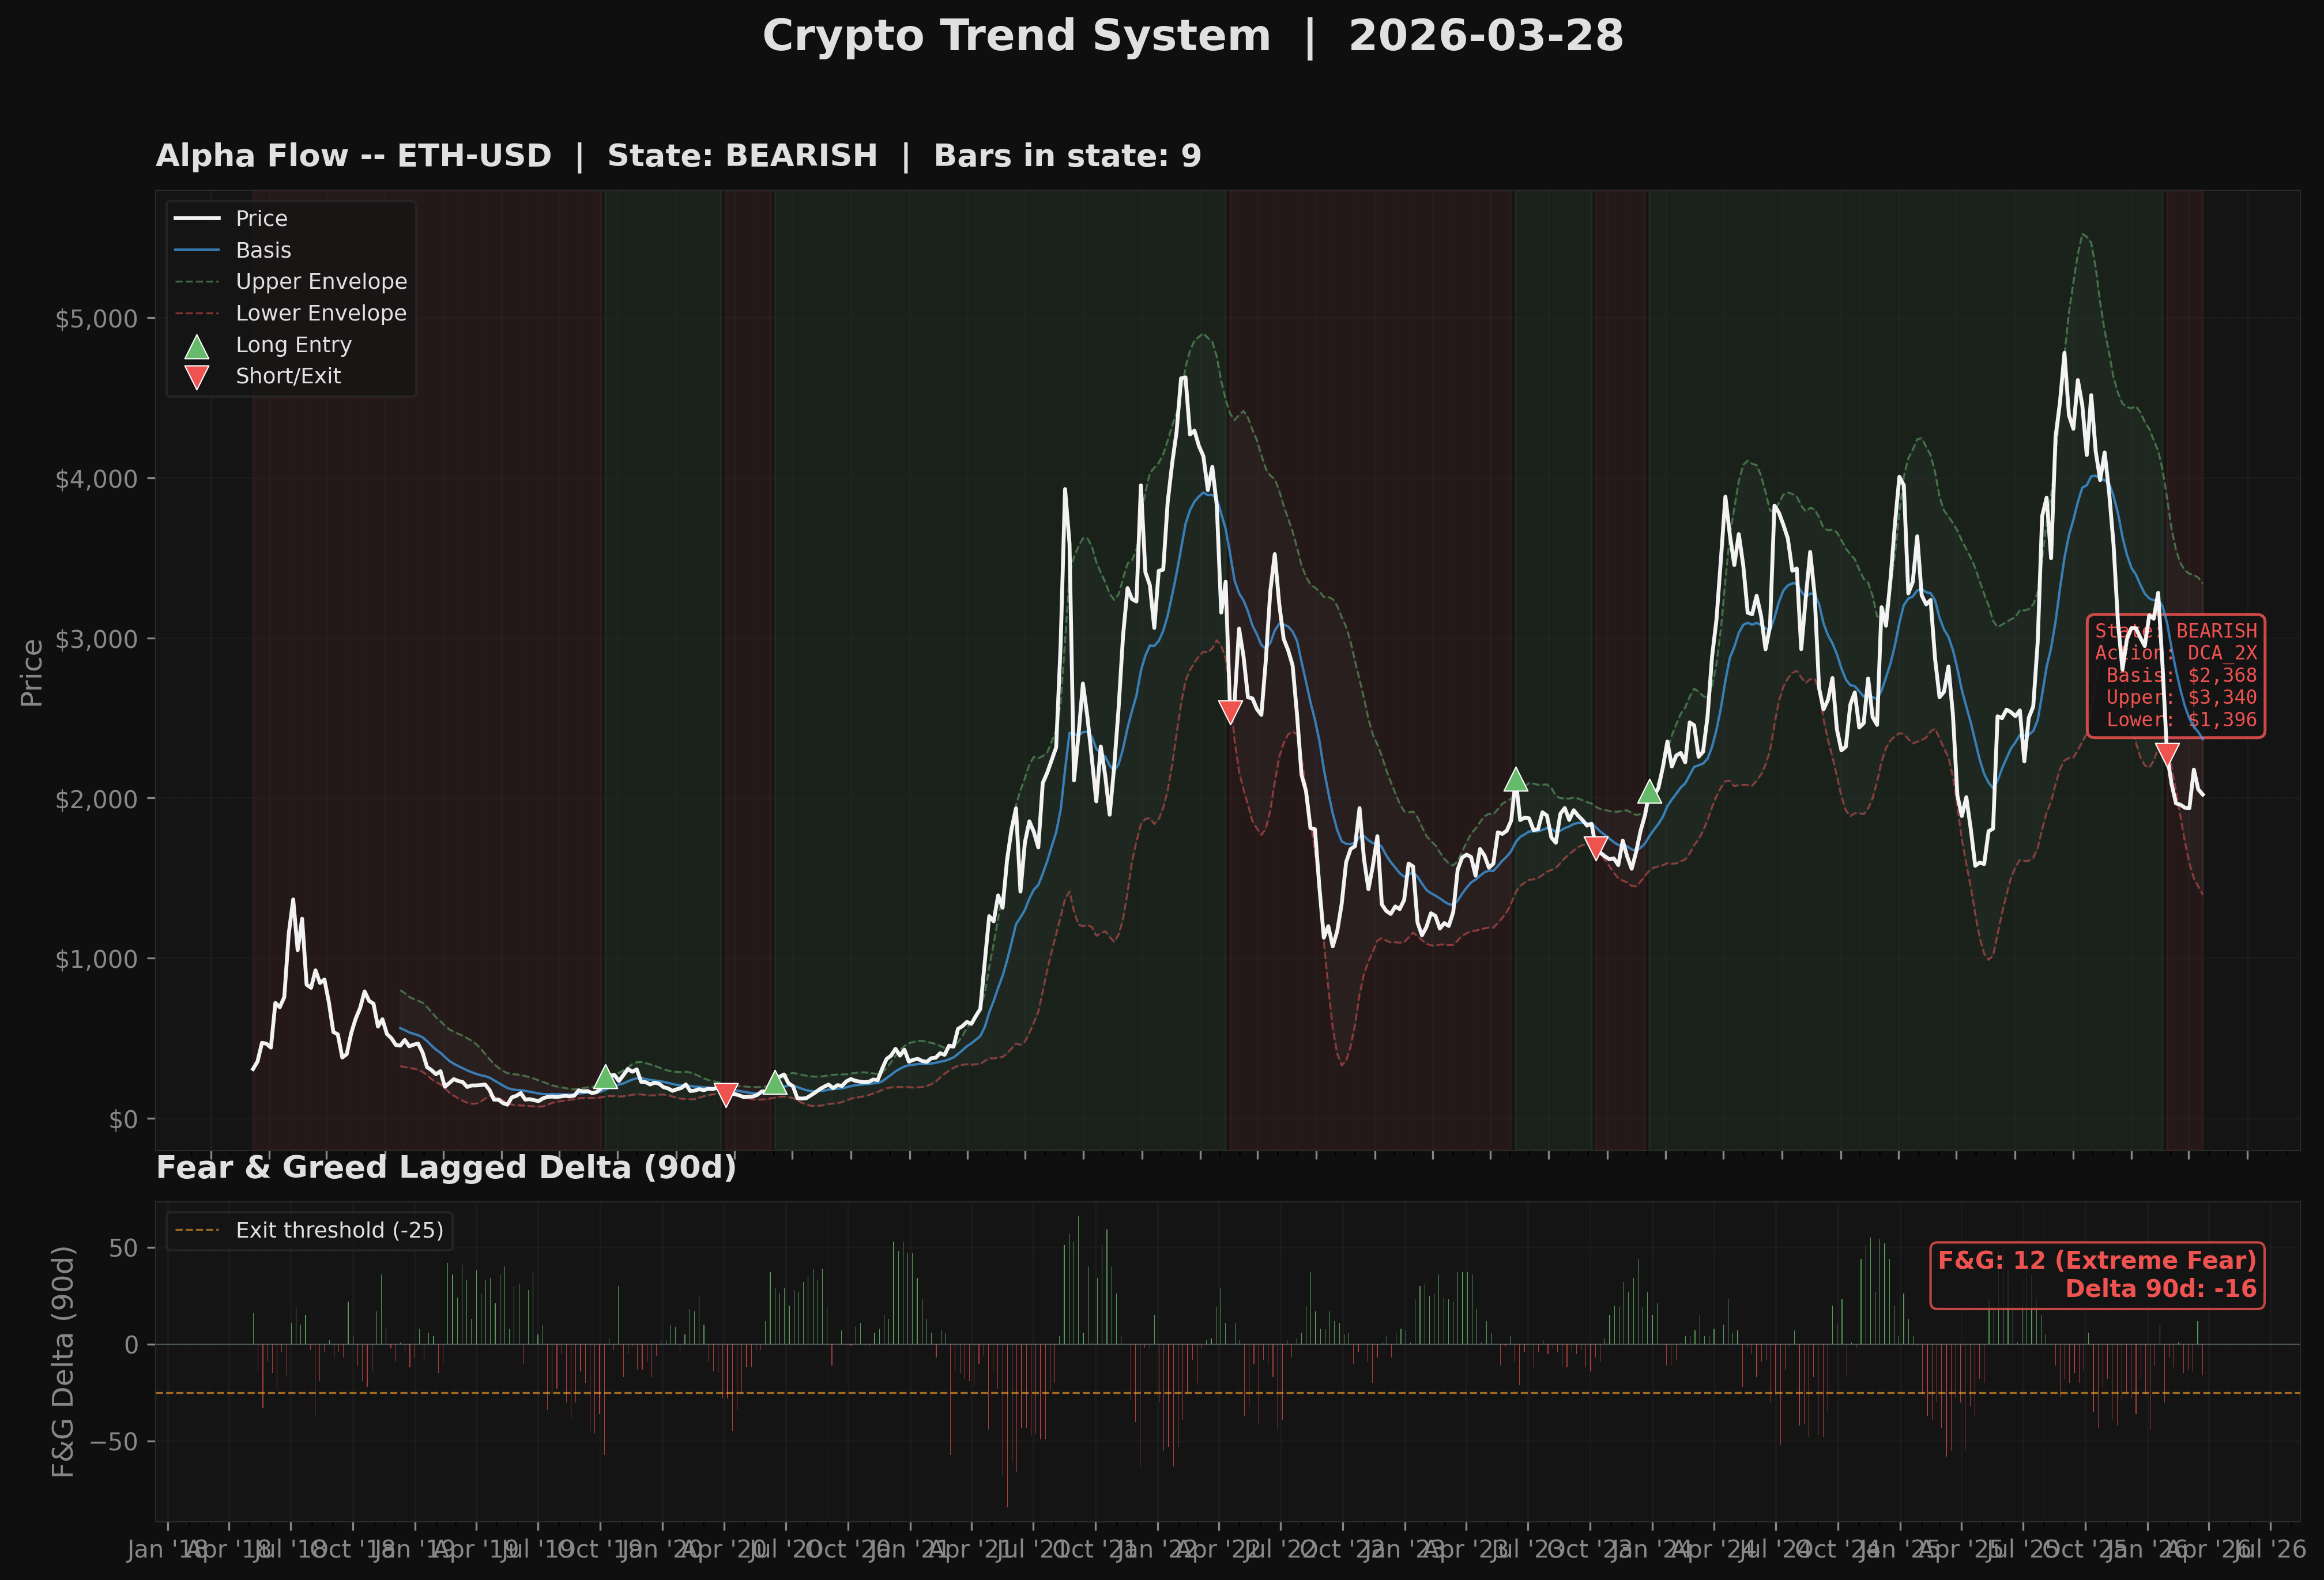
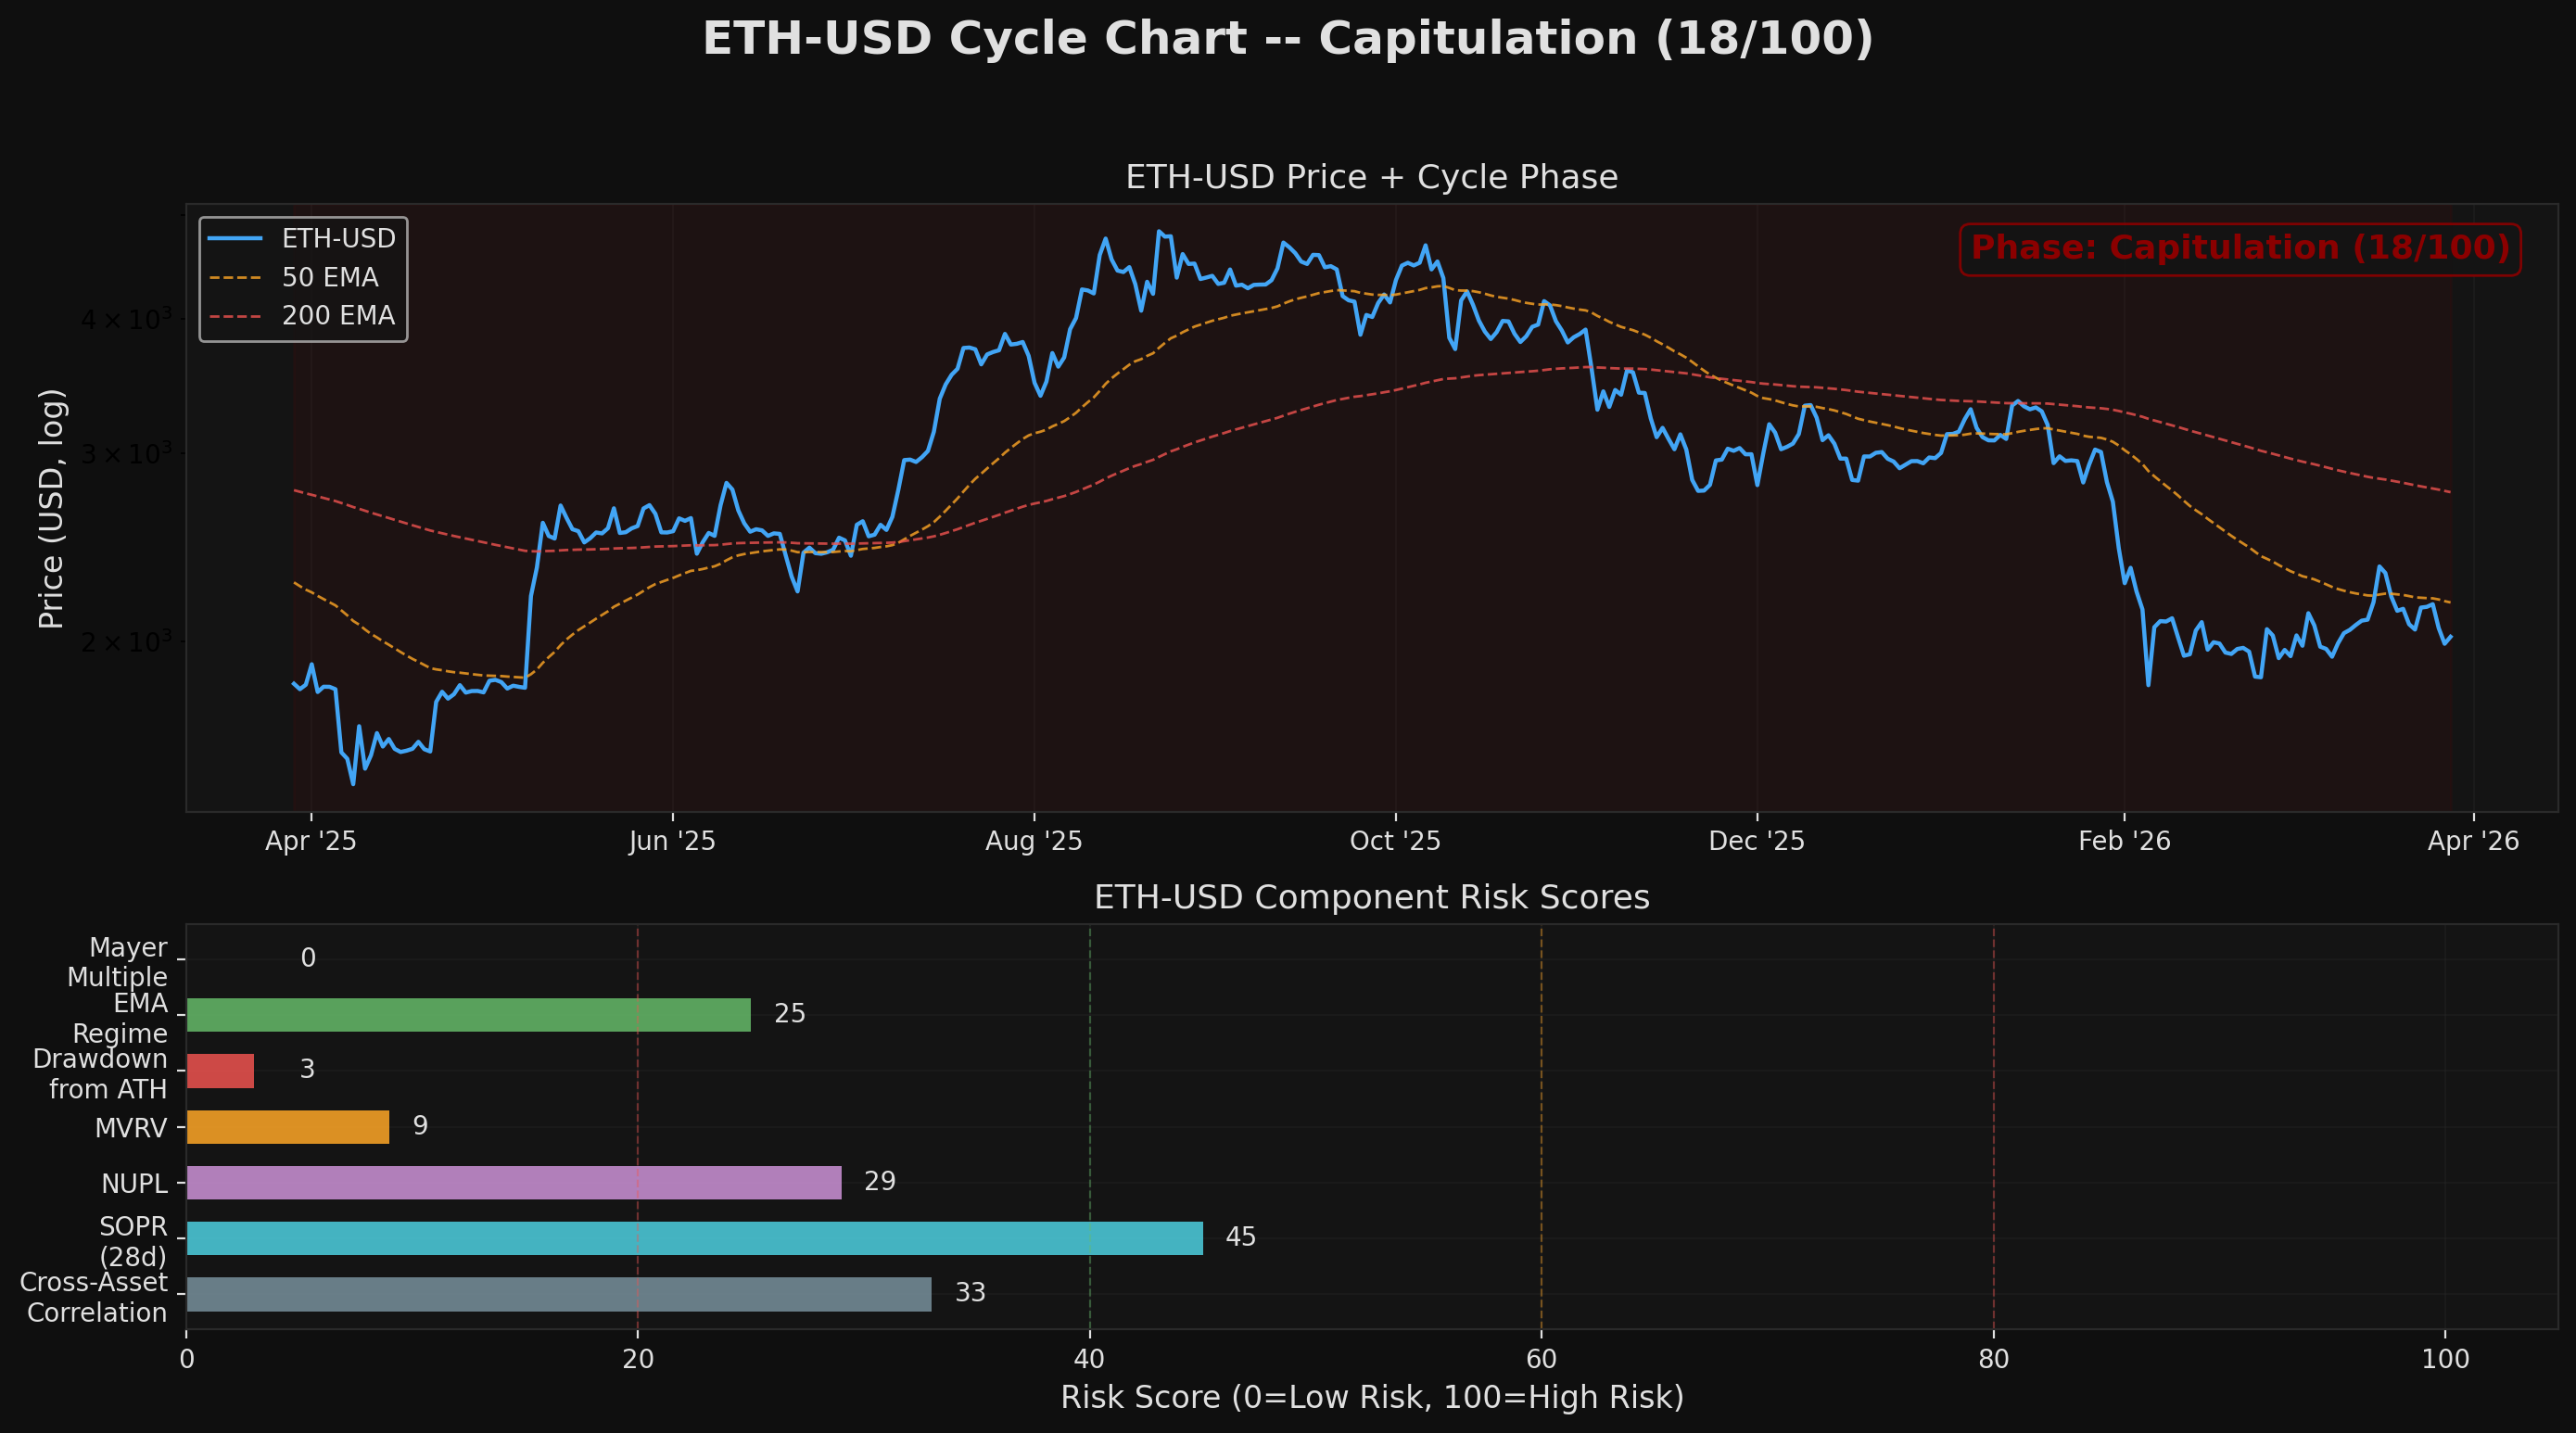
ETH-USD is in a capitulation phase -- 5 of 8 indicators point to below-average risk. The Mayer Multiple (0.65) shows price is 35% below its 200-day average, a level that has historically preceded rallies. Price is 58.2% below its all-time high -- deep bear territory that has historically been a strong accumulation zone. On-chain metrics confirm: MVRV at 1.23 means the market isn't overheated. The main caution flag is the Bear EMA regime, meaning the trend is still down even as value builds. Score: 18/100 = very low risk, deep value zone.
Component Breakdown
| Signal | Value | Risk Score | Source |
|---|---|---|---|
|
Mayer Multiple
Price is 35% below its 200-day average -- historically a buying zone
|
0.654 (Oversold) | OHLCV | |
|
EMA Regime
Price is below both 50-day and 200-day moving averages -- trend is down
|
Bear | OHLCV | |
|
Drawdown from ATH
58.2% below all-time high -- deep bear territory, extreme fear zone
|
-58.2% | OHLCV | |
|
MVRV
Market value is 23% above realized value -- moderate, not overheated
|
1.233 | proxy_btc | |
|
NUPL
Network is slightly profitable -- far from euphoria levels
|
0.215 | proxy_btc | |
|
SOPR
Coins are being spent at a slight loss on average -- typical of accumulation
|
0.9946 | proxy_btc | |
|
Puell Multiple
Miners are earning below their yearly average -- revenue stress suggests reduced sell pressure
|
0.821 | proxy_btc | |
|
Cross-Asset Corr
Crypto is strongly correlated with equities (0.51)
|
eth_spy=0.51, eth_dxy=-0.16 | OHLCV |
Context Overlay
- Immune System: CRITICAL
Turbulence: 10.13 | VIX: 31.0 | Consumer credit: NORMAL
- Credit Stress: HIGH (75.8/100)
Corporate: 96.4 | Consumer: 62.1 | Funding: 39.0
Interpretation
On-chain and technical signals suggest favorable risk/reward.
Suggested Actions
- Accumulate core positions on weakness
- Standard position sizing applies
Cycle Chart
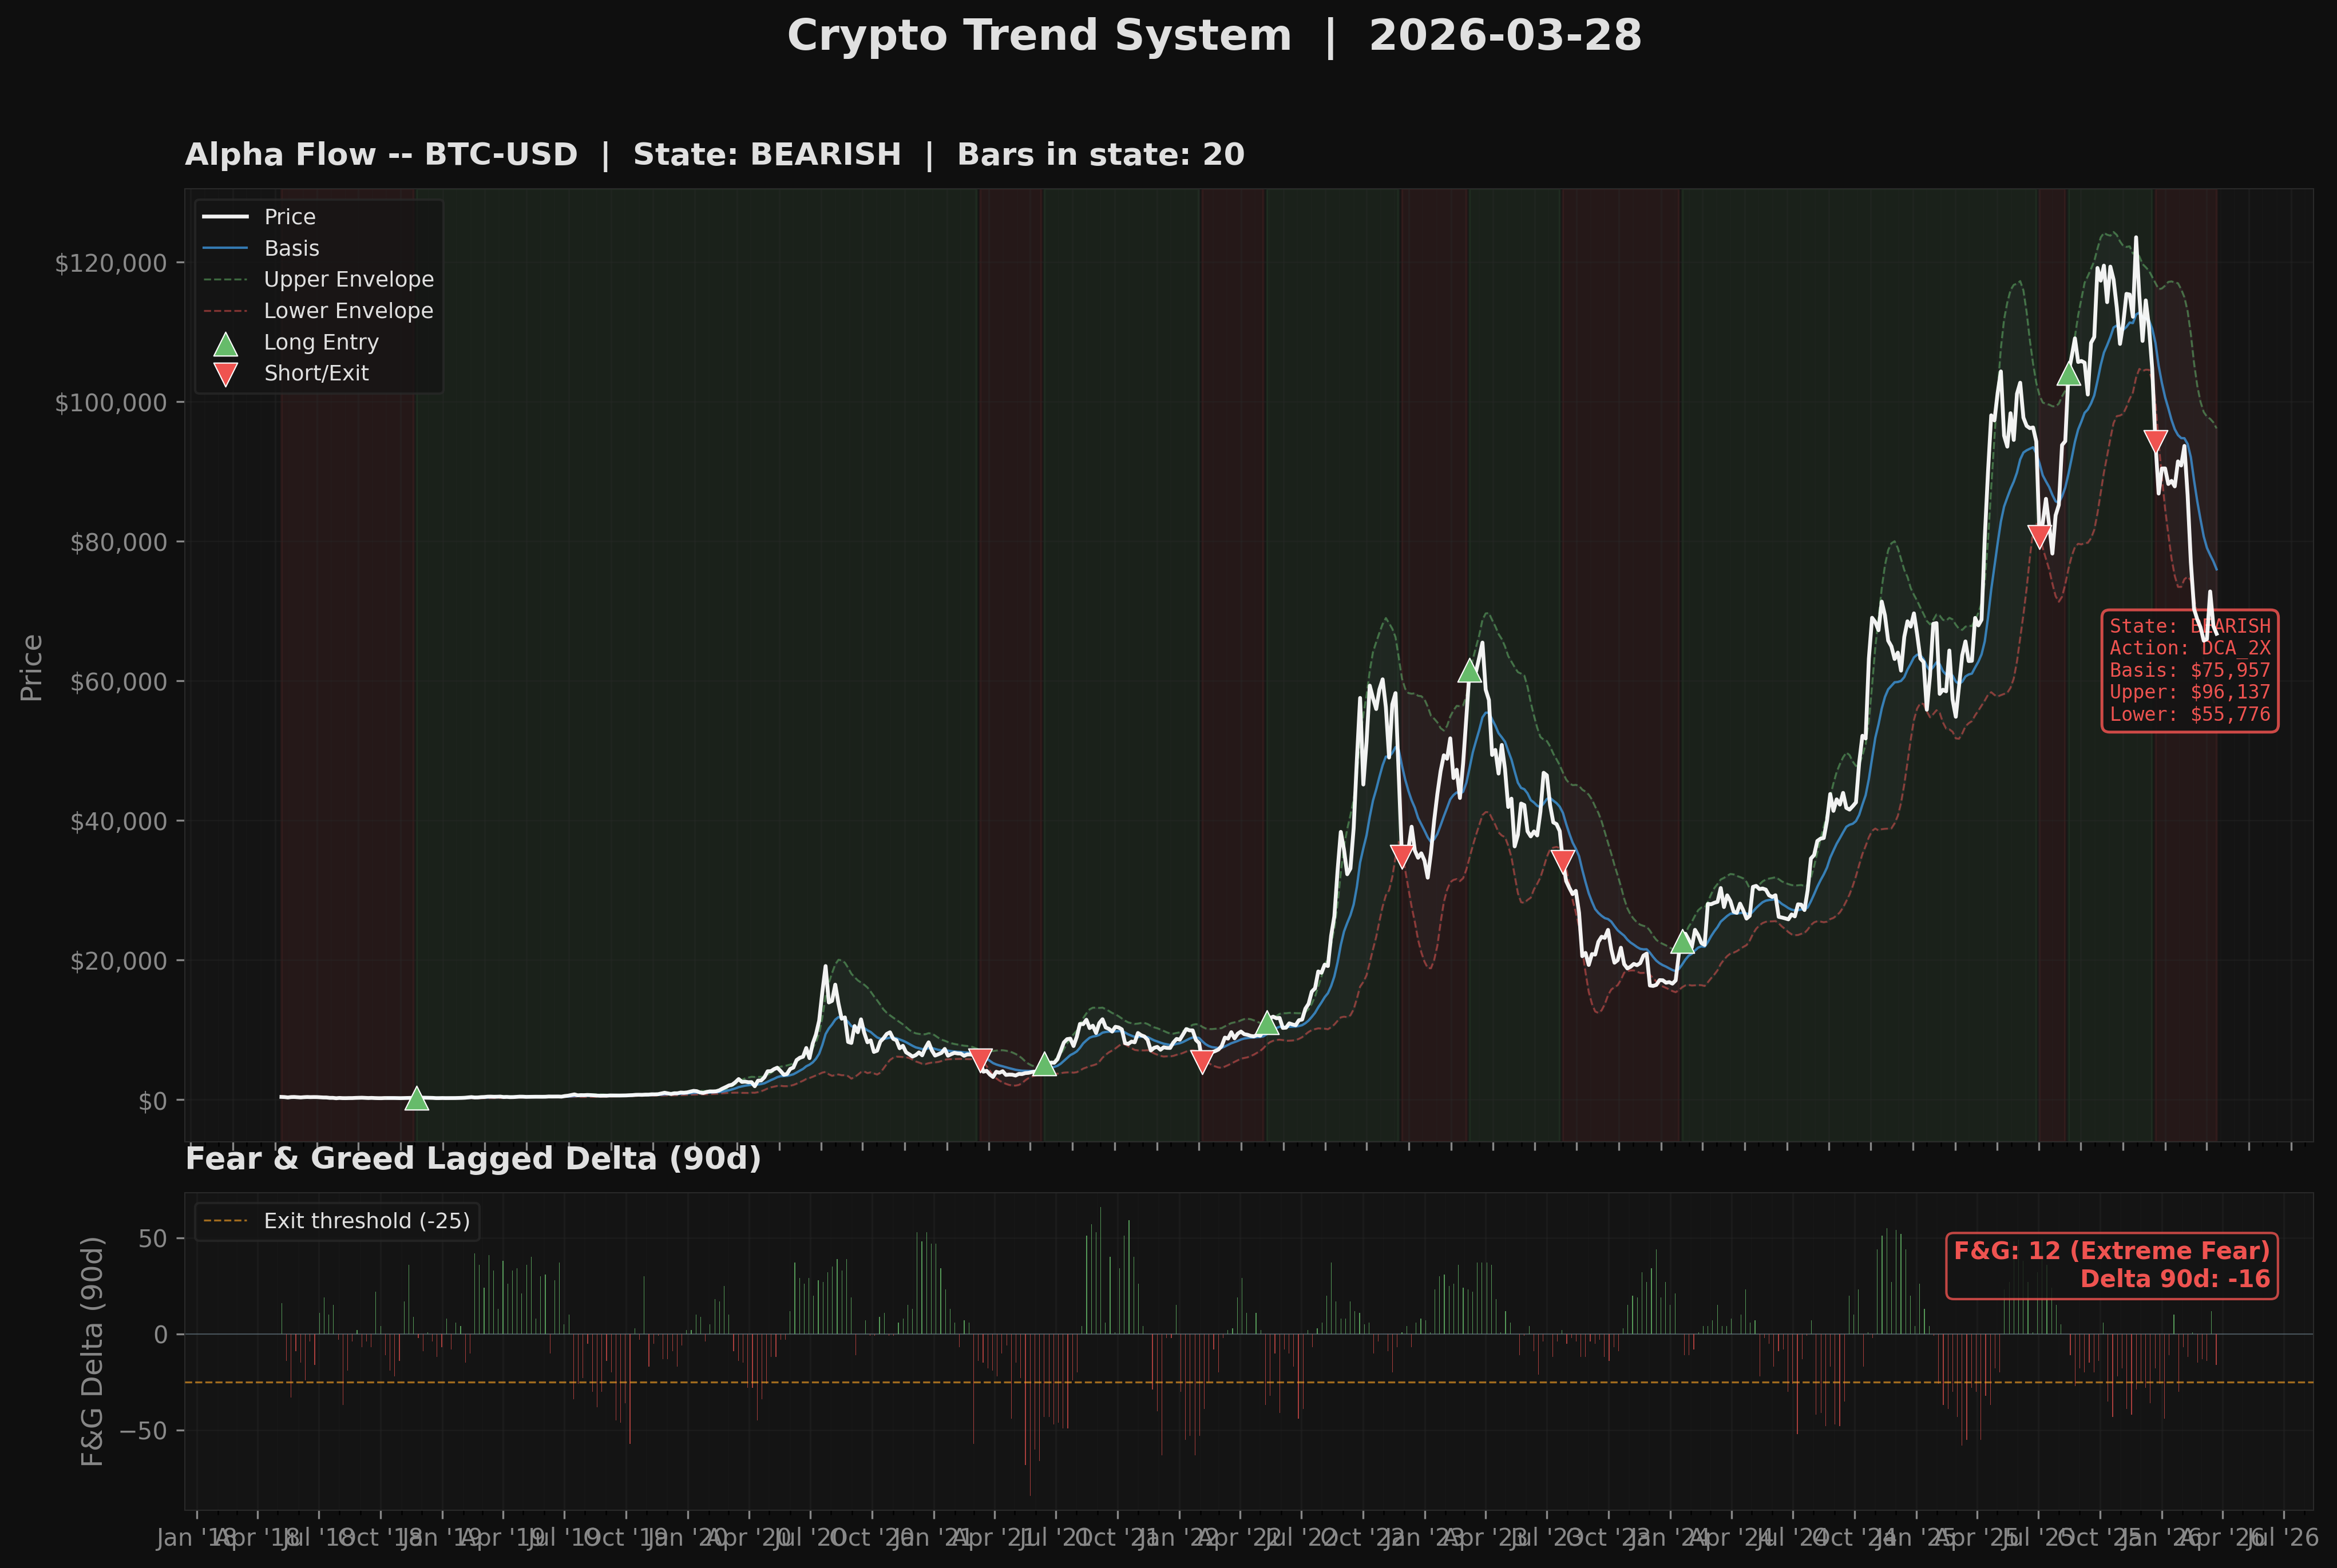
Trend System
BTC-USD
Alpha Flow
Fear & Greed
ETH-USD
Alpha Flow
Fear & Greed